Abstract
Ovarian cancer (OC) is the leading cause of gynecological cancer deaths. Extraordinary histologic and genetic heterogeneity presents as great hurdle to OC's diagnosis and treatment. MRPS12 (Mitochondrial Ribosomal Protein S12), encoding a 28S subunit protein, controls the decoding fidelity and susceptibility to aminoglycoside antibiotics. Our study aims to investigate the clinical significance and potential mechanism of MRPS12 in OC.
Oncomine, Tumor Immune Estimation Resource database (TIMER), and GEPIA databases were utilized to explore the expression level of MRPS12 in OC and normal tissues. Kaplan–Meier plotter was used to evaluate the influence of MRPS12 expression on OC patients’ survival. The potential biologic function and immune infiltration of MRPS12 in OC were analyzed by GSEA (Gene set enrichment analysis) and TIMER database, respectively.
MRPS12 was significantly highly expressed in OC (P < .05) compared with normal ovarian tissues. Its overexpression was also significantly related with poor overall survival in advanced FIGO stage (III+IV) patients, in serous OC and in those patients with TP53 mutation (P < .05). GSEA showed that HALLMARK_G2M_CHECKPOINT, BIOCARTA_CELLCYCLE_PATHWAY, HALLMARK_PI3K_AKT_MTOR_SIGNALING, BIOCARTA_P53_PATHWAY were significantly enriched in high-MRPS12-expression phenotype. MRPS12 expression was positively correlated with the infiltration of macrophages and neutrophils in OC.
These results reveal that MRPS12 could function as a potential oncogene and serve as a promising prognostic candidate in OC.
Keywords: mitochondrial ribosomal protein S12, oncomine database, ovarian cancer, prognosis, tumor immune estimation resource database
1. Introduction
Ovarian cancer (OC) is the leading common malignancies of female reproductive organs.[1] Due to the deep location in the pelvic cavity, the early stages of OC incline to be painless and often go undetected until the cancer has spread within the pelvis and abdomen.[2] Though CA125 (cancer antigen 125) may render help in early diagnosis of OC, there are exceptions to some borderline tumors, which do not lead to the elevation of CA125 levels and are not identifiable by ultrasound. At this late stage, OC is more difficult to treat and thus has the highest mortality rate.[1,3] Therefore, numerous studies are seeking for reliable biomarkers to detect OC early – before a woman has symptoms and to predict prognosis for OC patients so as to adopt in-time adjuvant radiation therapy and/or chemotherapy when necessary.
Given the fact that OC is a malignancy with high degree of histologic and genetic heterogeneity,[3] it is crucial to investigate the expression difference of MRPS12 (Mitochondrial Ribosomal Protein S12) between OC and normal tissues and its relationship with OC patients’ survival outcome on a larger scale of databases.
Mitochondrial ribosomes (mitoribosomes) are composed of a small 28S subunit and a large 39S subunit. MRPS12 is mapped on chromosome 19q13.2 and encodes a 28S subunit protein, which is a key element of the ribosomal small subunit and plays an important role in the decoding fidelity and susceptibility to aminoglycoside antibiotics.[4,5] In recent years, the mitochondria have been implicated as central executioners of cell death.[6] Tang et al[7] reported in human brain glioblastoma cells, MRPS12 expression decreased after the treatment of benzyl isothiocyanate to induce apoptosis. However, the potential role that MRPS12 plays in OC and its biological function have been poorly investigated.
The objective of our study was focused on the clinical significance of MRPS12 and its influence on the prognosis of patients with OC by investigation of various datasets, so as to provide more evidence for further study of the role that MRPS12 plays in the pathogenesis of OC.
2. Methods
2.1. Oncomine database extraction
Oncomine currently collects gene expression profiles and sample data from 500 cancer types and a wide range of cancer cell lines.[8] The present study set the screening conditions as follows:
-
1.
Search Gene: MRPS12;
-
2.
Primary filters: analysis type, differential analysis, cancer vs normal (as control group) analysis;
-
3.
Cancer Type, OC;
-
4.
Selecting threshold: P < .05, fold change >2, gene rank = top 10%.
All the datasets that meet the aforementioned criteria were extracted and replotted by R.
2.2. Survival analysis performed by Kaplan–Meier online database
The Kaplan-Meier plotter, an online database, is capable of evaluating the impact of 54k genes on survival in 21 cancer types, of which the largest datasets include breast (n = 6234), ovarian (n = 2190), lung (n = 3452), and gastric (n = 1440) cancer.[9] The effect of MRPS12 mRNA expression level as well as other clinical parameters on the survival outcome of OC patients was analyzed by this database. The screening conditions were:
-
1.
Cancer type: OC;
-
2.
Gene symbol: MRPS12;
-
3.
Survival: OS (overall survival); Survival: PFS (progression-free survival); Survival: post-progression survival.
The OC patients with low expression level of MRPS12 were thought as control group.
2.3. Gene expression landscape and immune infiltration analyzed by TIMER (Tumor Immune Estimation Resource) database
MRPS12 expression landscape across various cancer types and immune infiltration analysis in OC were analyzed by TIMER database.[10] The abundances of 6 immune infiltrates, including CD4+ T cells, CD8+ T cells, B cells, Macrophages, Neutrophils, and Dendritic cells, were estimated by TIMER algorithm. The screening conditions for gene expression landscape (normal tissues as control group) of various tumors were as follows:
-
1.
Diff Exp module;
-
2.
Gene symbol: MRPS12. The screening filters for immune infiltrates of MRPS12 in patients with OC were: 1. Gene module: MRPS12; 2. Cancer types: OC;
-
3.
Immune infiltrates: B Cell, CD8 + T Cell, CD4 + T Cell, Macrophage, Neutrophil, Dendritic.
2.4. Gene set enrichment analysis (GSEA)
TCGA (The Cancer Genome Atlas) OC (OV) cohort was downloaded from UCSC (University of California, Santa Cruz) Xena website. The cohort was separated into high and low-MRPS12 (as control group) phenotypes by its median expression. GSEA 4.0 software[11] was used for data analysis. The present study set c2.cp.biocarta.v7.0.symbols.gmt and h.all.v7.0.symbols.gmt [Hallmarks] as the gene-set database. Gene set permutations were set as 1000 times. We adopted the nominal P value and normalized enrichment score (NES) to sort the enriched pathways.
2.5. Statistic methods
The difference of MRPS12 expression level between normal ovarian tissues and OC tissues was evaluated by Student t test. GEPIA (Gene Expression Profiling Interactive Analysis) database was used to explore the differential expression of MRPS12 in ovarian cancer samples of TCGA-OV and in normal ovarian samples (as control group) from GTEx (The Genotype-Tissue Expression).[12] The influence of MRPS12 expression on the survival outcome in patients with OC was analyzed by Kaplan–Meier method and log-rank test. The correlation between immune infiltrates and MRPS12 expression was analyzed by Spearman test. P < .05 was defined as statistically significant difference.
3. Results
3.1. Expression landscape of MRPS12 in various human cancer types
A total of 445 various human cancer studies were detected in Oncomine database, of which 48 cases were significantly upregulated and 7 were downregulated (Fig. 1). As Figure 2 shows, MRPS12 expression in bladder urothelial carcinoma, breast invasive carcinoma, cholangiocarcinoma, colon adenocarcinoma, esophageal carcinoma, head and neck squamous cell carcinoma, kidney chromophobe, liver hepatocellular carcinoma, lung adenocarcinoma, lung squamous cell carcinoma, prostate adenocarcinoma, rectum adenocarcinoma, thyroid carcinoma, and uterine corpus endometrial carcinoma was higher compared with their adjacent normal tissues, with the exception of decreased MRPS12 expression in kidney renal clear cell carcinoma.
Figure 1.
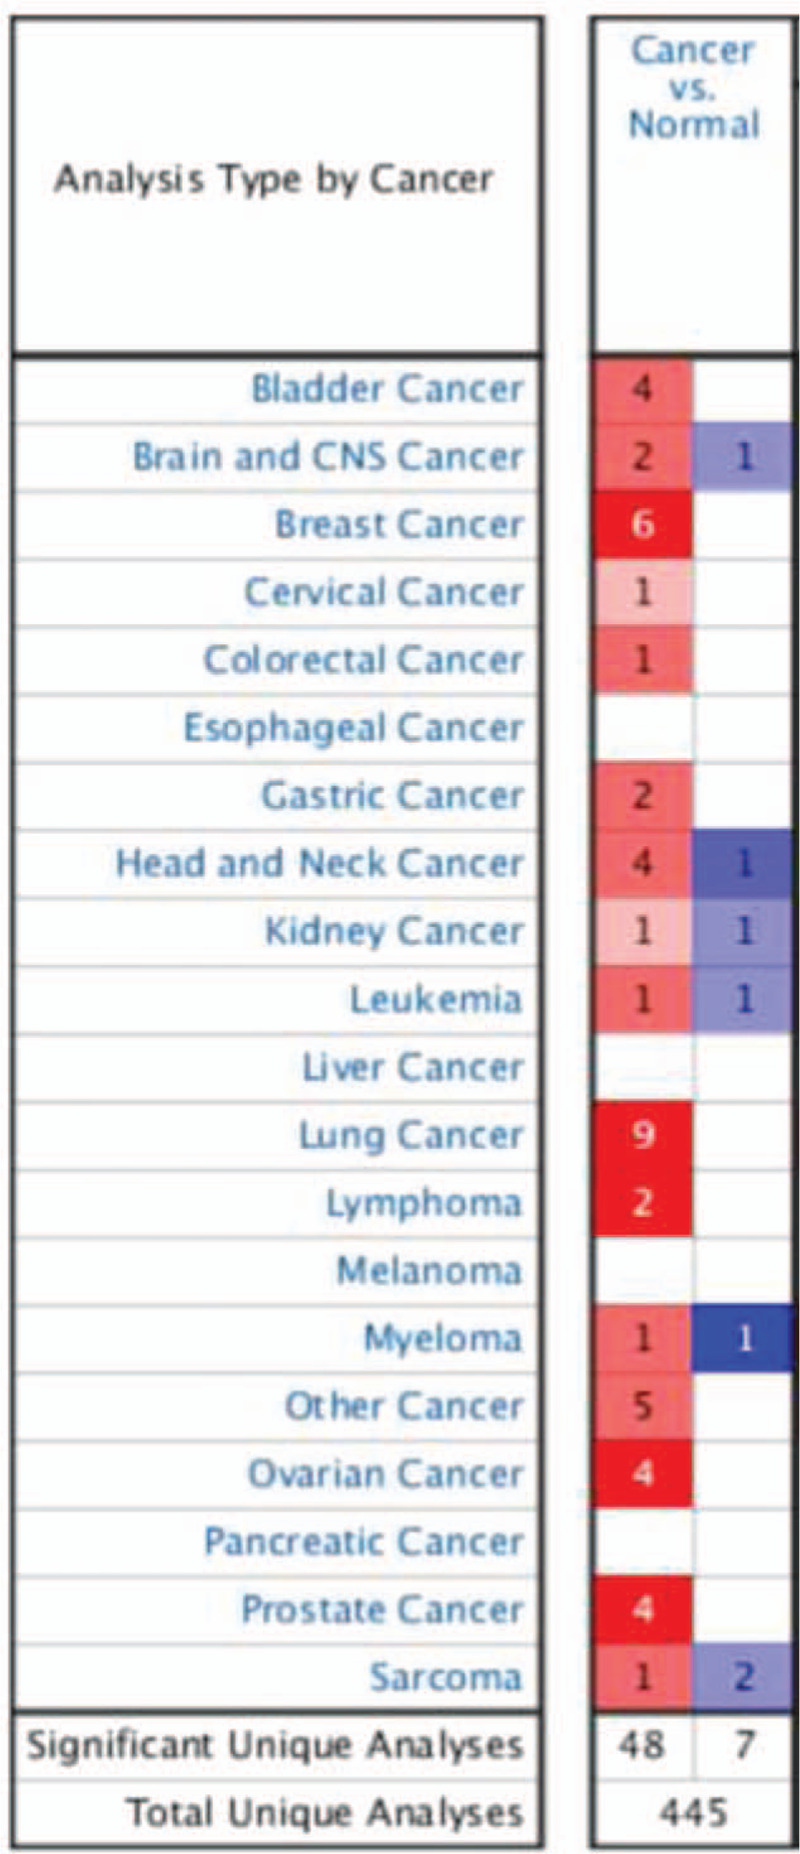
Expression landscape of MRPS12 in oncomine database; 445 studies of MRPS12 expression were detected in cancer tissues, of which 48 were up-regulated and 7 were down-regulated.
Figure 2.
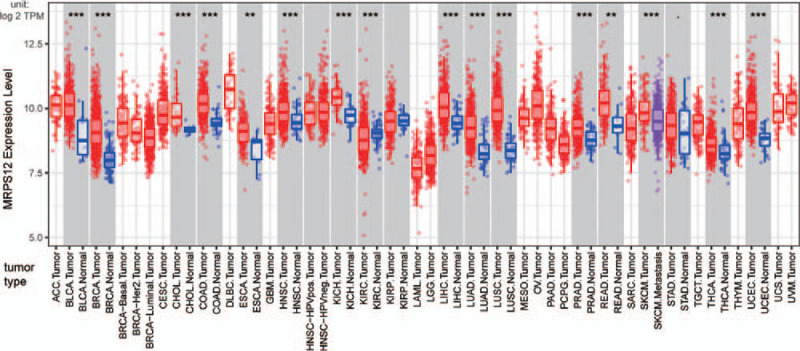
Expression landscape of MRPS12 in TIMER database; red box represents upregulation, blue box represents down regulation. (∗∗P < .01, ∗∗∗P < .001).
3.2. Meta-analysis of MRPS12 expression in ovarian cancer
As is shown in Figure 3, 8 studies were focused on the MRPS12 expression of OC by Oncomine database. When the P value was set as less than .05, fold change as 2 and gene rank as top 10%, 4 studies, that is, Bonome et al,[13] Yoshihara et al,[14] TCGA ovarian, Lu et al,[15] showed MRPS12 was significantly overexpressed in OC than that in normal ovarian tissues (Fig. 4A–D). Meta-analysis of the aforementioned datasets demonstrated the median rank of MRPS12 was 465.0(P = 8.68e–4).
Figure 3.
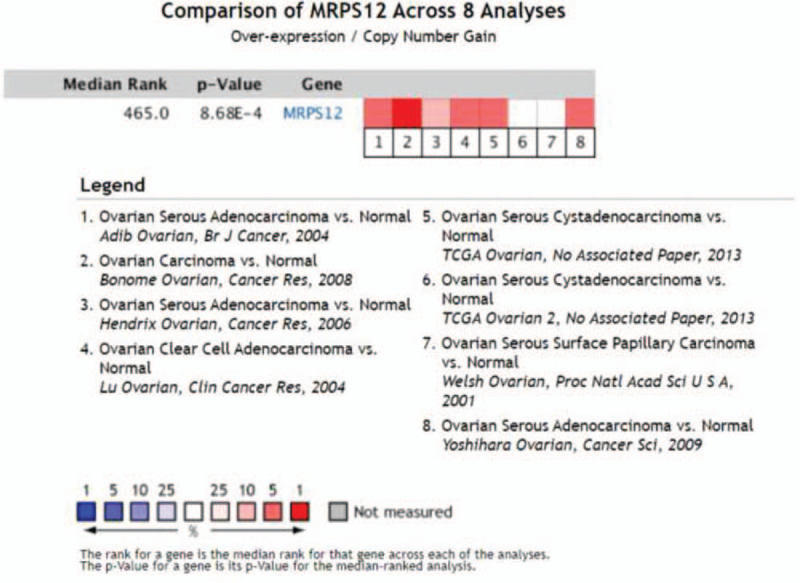
Comparison of MRPS12 gene across 8 ovarian cancer studies by oncomine.
Figure 4.
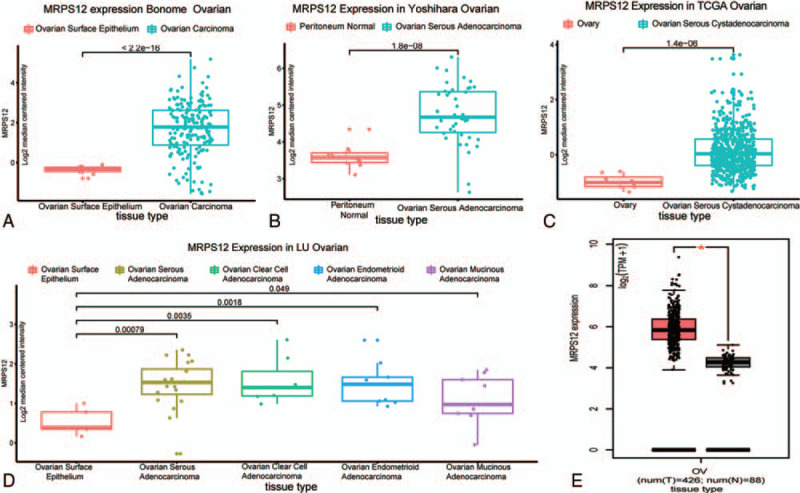
The expression of MRPS12 in ovarian cancer and in normal tissues. Bonome et al (A) Yoshihara et al (B), TCGA ovarian (C), Lu et al (D), GEPIA (E).
GEPIA database also revealed, compared with normal tissues in GTEx dataset, MRPS12 was significantly overexpressed in TCGA ovarian cancer cohort (Fig. 4E).
3.3. The influence of overexpressed MRPS12 on the OC patients’ survival
As Table 1 revealed, overexpressed MRPS12 was significantly associated with worse OS and PFS for OC patients (P < .05). Kaplan–Meier method showed in contrast with the OC patients with low MRPS12 expression, the OC patients with high MRPS12 expression tended to end up with poor survival outcome (Fig. 5).
Table 1.
The relationship between MRPS12 mRNA expression and median survival time OC patients.
| Medium survival time (months) | |||||
| Survival | Number of cases | Follow-up time (months) | Low expression | High expression | P value |
| OS | 1657 | 60 | 46 | 41.87 | .028∗ |
| 120 | 45.97 | 43 | .0038∗ | ||
| PFS | 1436 | 60 | 20 | 19.3 | .044∗ |
| 120 | 20.53 | 19.23 | .027∗ | ||
| PPS | 782 | 60 | 38.9 | 41.97 | .39 |
| 120 | 39.63 | 41 | .36 | ||
OS = overall survival, PFS = progression-free survival, PPS = postprogression survival.
Figure 5.
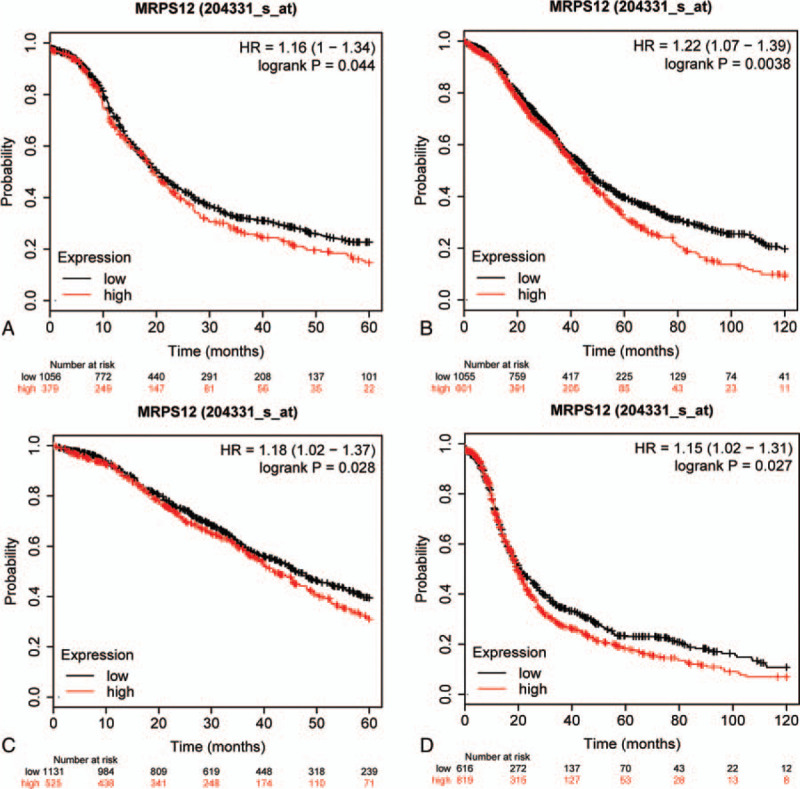
The influence of overexpressed MRPS12 on the survival of OC patients.(A) OS = 60 months. (B) OS = 120 months. (C) PFS = 60 months. (D) PFS = 120 months. OS = overall survival, PFS = progression-free survival.
In order to advance our understanding of the influence of MRPS12 expression on OC patients, we assessed the relationship between the MRPS12 expression as well as other clinical characteristics on OC patients survival by Kaplan–Meier database. As revealed in Table 2, overexpression of MRPS12 was significantly related with poor OS in advanced FIGO (The International Federation of Gynecology and Obstetrics) stage (III+IV) patients (P < .05), but with poor PFS in lower stage (FIGO I+II) patients. In addition, overexpressed MRPS12 was also significantly related with poor OS in serous OC and in those patients with TP53 (tumor protein p53) mutation (P < .05), but not significantly associated with PFS (P > .05).
Table 2.
Correlation of MRPS12 mRNA expression and clinical prognosis in OV with different clinicopathological factors by Kaplan–Meier plotter.
| Overall survival (n = )(time = 120months) | Progression-free survival (n = ) (time = 120months) | |||||
| Clinicopathological characteristics | N | Hazard ratio | P value | N | Hazard ratio | P value |
| STAGE | ||||||
| 1 + 2 | 179 | 1.52 (0.69–3.37) | .2986 | 163 | 1.86 (1.04–3.35) | .0347∗ |
| 3 + 4 | 1268 | 1.2 (1.03–1.39) | .0196∗ | 1081 | 1.13 (0.97–1.31) | .1204 |
| GRADE | ||||||
| 1 + 2 | 381 | 1.22 (0.89–1.68) | .2114 | 293 | 1.18 (0.87–1.61) | .2814 |
| 2 + 3 | 1024 | 1.16 (0.99–1.35) | .0602 | 1093 | 1.08 (0.93–1.26) | .3147 |
| Histology | ||||||
| Serous | 1232 | 1.19 (1.01–1.39) | .0374∗ | 1104 | 1.09 (0.94–1.26) | .2351 |
| Endometroid | 62 | 0.36 (0.06–2.18) | .2476 | 51 | 2.28 (0.81–6.41) | .107 |
| TP53 mutation | ||||||
| Mutated | 516 | 1.45 (1.15–1.82) | .0015∗ | 483 | 1.24 (0.98–1.55) | .0696 |
| Wild type | 106 | 0.63 (0.32–1.26) | .1856 | 84 | 0.7 (0.4–1.22) | .2065 |
3.4. The gene set enrichment analysis identified MRPS12-involved signaling pathway
To get an in-depth knowledge about the potential biological role that MRPS12 played in OC, TCGA ovarian cancer cohort was separated into 2 phenotypes based on the median expression level of MRPS12. GSEA analysis results (Fig. 6, Table 3) showed overexpression of MRPS12 was significantly related with the activation of the following pathway: HALLMARK_G2M_CHECKPOINT, BIOCARTA_CELLCYCLE_PATHWAY, HALLMARK_PI3K_AKT_MTOR_SIGNALING, BIOCARTA_P53_PATHWAY.
Figure 6.
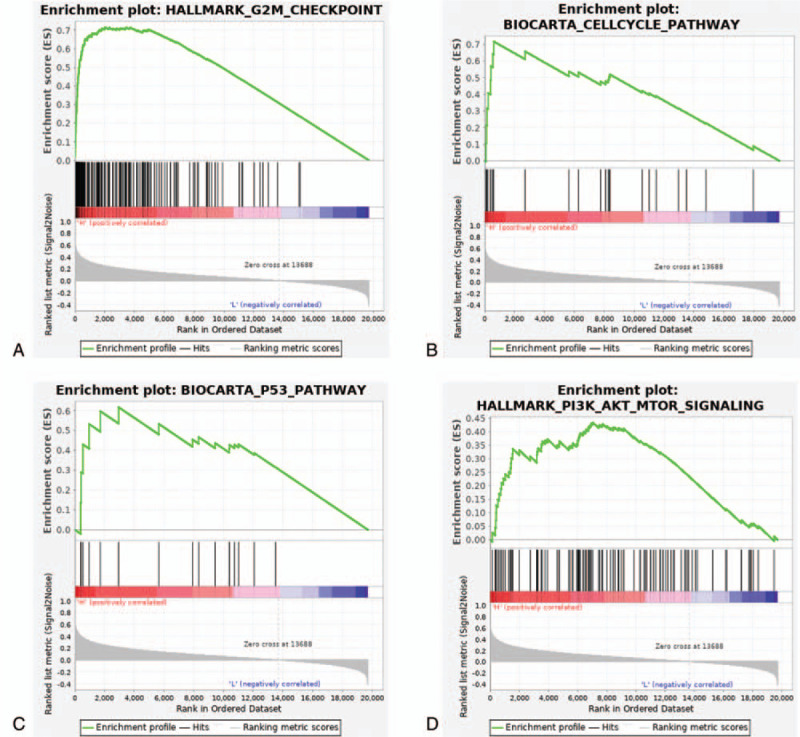
Enrichment plots in high-MRPS12-phenotype from gene set enrichment analysis (GSEA). (A) HALLMARK_G2M_CHECKPOINT, (B) BIOCARTA_CELLCYCLE_PATHWAY, (C) HALLMARK_PI3K_AKT_MTOR_SIGNALING, (D) BIOCARTA_P53_PATHWAY.
Table 3.
Genesets enriched in high-MRPS12-phenotype.
| MSigDB collection | Gene set name | NES | NOM P value | FDR q-value |
| c2.cp.biocarta.v7.0.symbols.gmt | BIOCARTA_G2_PATHWAY | 2.01 | .000 | 0.109 |
| BIOCARTA_CELLCYCLE_PATHWAY | 1.89 | .000 | 0.074 | |
| BIOCARTA_ATRBRCA_PATHWAY | 1.73 | .021 | 0.046 | |
| BIOCARTA_G1_PATHWAY | 1.66 | .012 | 0.071 | |
| BIOCARTA_G1_PATHWAY | 1.84 | .000 | 0.055 | |
| BIOCARTA_ATM_PATHWAY | 1.83 | .000 | 0.052 | |
| BIOCARTA_ATRBRCA_PATHWAY | 1.82 | .000 | 0.054 | |
| BIOCARTA_MCM_PATHWAY | 1.77 | .000 | 0.078 | |
| BIOCARTA_CARM_ER_PATHWAY | 1.74 | .002 | 0.099 | |
| BIOCARTA_EFP_PATHWAY | 1.71 | .010 | 0.123 | |
| BIOCARTA_PITX2_PATHWAY | 1.70 | .014 | 0.120 | |
| BIOCARTA_RACCYCD_PATHWAY | 1.65 | .018 | 0.156 | |
| BIOCARTA_VDR_PATHWAY | 1.65 | .019 | 0.151 | |
| BIOCARTA_IGF1MTOR_PATHWAY | 1.64 | .014 | 0.150 | |
| BIOCARTA_P53_PATHWAY | 1.63 | .006 | 0.154 | |
| h.all.v7.0.symbols.gmt [Hallmarks] | HALLMARK_MTORC1_SIGNALING | 1.91 | .004 | 0.113 |
| HALLMARK_MITOTIC_SPINDLE | 1.90 | .000 | 0.086 | |
| HALLMARK_E2F_TARGETS | 1.88 | .004 | 0.065 | |
| HALLMARK_G2M_CHECKPOINT | 1.88 | .000 | 0.055 | |
| HALLMARK_UNFOLDED_PROTEIN_RESPONSE | 1.86 | .008 | 0.053 | |
| HALLMARK_SPERMATOGENESIS | 1.70 | .006 | 0.116 | |
| HALLMARK_PI3K_AKT_MTOR_SIGNALING | 1.69 | .000 | 0.117 |
†NES = normalized enrichment score, NOM = nominal, FDR: false discovery rate. Gene sets with NOM P value< .05 and FDR q-value < 0.25 were considered significant.
3.5. Immune infiltration of overexpressed MRPS12 in OC
The interaction between cancer and immune system plays a critical role in the onset and progression of cancer. Then we evaluated the relationship between MRPS12 expression and infiltration of various immune cells in OC by TIMER database. As Figure 7 shows, MRPS12 expression significantly correlated with the infiltration levels of macrophages (P = 6.43e–06, partial.cor = 0.204) and neutrophils (P = 6.20e–04, partial.cor = 0.156).
Figure 7.

The association between the immune infiltration and MPRS12 expression in OC by TIMER database.
4. Discussion
MRPS12 is mapped on chromosome 19q13.2 and encodes a 28S subunit protein which belongs to the ribosomal protein S12P family. Previous literature has reported MRPS12 is a crucial element of the ribosomal small subunit and controls the decoding fidelity and susceptibility to aminoglycoside antibiotics.[4,5] Our study observed MRPS12 was significantly upregulated in various kinds of human tumors compared to their adjacent normal tissues. Until now, no study has been focused on the role of MRPS12 in any kinds of tumors before. The objective of our study was to investigate the expression, and the clinical significance of MRPS12 in ovarian cancer on larger scale of databases.
The initiation and progression of tumor is an aberrant and complicated pathophysiological process, resulting in altered expression of numerous genes. Therefore, it is of great importance to explore the expression of MPRS12 on larger scale of datasets available online to generalize our findings. In Oncomine database, MRPS12 was significantly upregulated in OC than normal tissues in 4 datasets out of 8 datasets in total (P < .05, fold change >2, gene rank = top 10%). In GEPIA database (TCGA-OV was set as tumor group, GTEx as normal group), MRPS12 was also significantly highly-expressed in OC than normal tissues.
As to the effect of MRPS12 on the survival outcome of OC patients, Kaplan–Meier plotter database showed the OS (60 months, 120 months) and PFS (60 months, 120 months) of OC patients with overexpressed MRPS12 were significantly reduced than those with downregulated MRPS12 (P < .05). Besides, overexpressed MRPS12 was also significantly related with poor OS in advanced FIGO stage (III + IV) patients, in serous OC and in those patients with TP53 mutation (P < .05). Therefore, it is speculated that MRPS12 functions as a potential oncogene in OC and has the potential to be a prognostic biomarker.
Until now, there is no study focusing on the specific biologic function and molecular mechanism of overexpressed MRPS12 in tumorigenesis of any tumor. To that end, our study performed GSEA analysis in TCGA-OV cohort. GSEA identified that in high-MRPS12-expression cohort, HALLMARK_G2M_CHECKPOINT, BIOCARTA_CELLCYCLE_PATHWAY, HALLMARK_PI3K_AKT_MTOR_SIGNALING, BIOCARTA_P53_PATHWAY were significantly activated (P < .05). Additionally, mitochondrial dysfunction has been reported to be implicated in the induction of apoptosis and has even been indicated to play a central role in the apoptotic pathway.[16,17] Therefore, it is assumed that overexpressed MRPS12 could exert crucial effect on mitochondrion-related apoptosis of ovarian cells through the aforementioned pathways and then promotes the initiation and development of OC, which provides new direction for future study.
Emerging literature has discovered the tumor-infiltrating lymphocytes, such as tumor-associated macrophages (TAMs) and tumor-infiltrating neutrophils (TINs), could affect the prognosis and efficacy of chemotherapy and immunotherapy.[18,19] Through TIMER database, we observed that MRPS12 expression was positively related with the infiltration of macrophages (P = 6.43e–06, partial.cor = 0.204) and neutrophils (P = 6.20e–04, partial.cor = 0.156). These results indicate the potential role of MRPS12 in association with TAM and TIN in the onset and progression of OC.
However, our study has certain limitations, but recommends new directions. The evaluation of MRPS12 expression was based on the RNA level, which sometimes did not match the protein level. For this reason, immunohistochemistry is needed to confirm our results of NCAPH expression in EC tumors. Besides, our study did not study the effect of upregulation of NCAPH on the EC cell proliferation, migration and invasion abilities, growth curve, wound healing, transwell and other experiments are thus needed to understand its functional role. Although our study has incorporated several datasets available online to support our findings, the sample size in this study is still limited and a study on larger scale of samples is urgently needed for validation.
In summary, our study discovered a novel biomarker MRPS12 and elucidated its prognostic potential in OC by online public databases. The biologic function and immune infiltration were also explored to clarify the potential mechanisms of its overexpression underlying the oncogenesis of OC. As a result, our study proposed MRPS12 could function as a potential oncogene in OC and is a novel and promising prognostic candidate.
Author contributions
Conceptualization: Xiaofeng Qiu, Fengying Wang.
Data curation: Yuhuan Bai.
Formal analysis: Xiaofeng Qiu, Dongxia Guo, Fengying Wang.
Methodology: Dongxia Guo, Juan Du.
Resources: Juan Du.
Software: Yuhuan Bai.
Writing – original draft: Xiaofeng Qiu.
Writing – review & editing: Fengying Wang.
Footnotes
Abbreviations: FIGO = The International Federation of Gynecology and Obstetrics, GSEA = Gene set enrichment analysis, MRPS12 = Mitochondrial Ribosomal Protein S12, OC = Ovarian cancer, OS = overall survival, PFS = progression-free survival, TCGA = The Cancer Genome Atlas, TIMER = Tumor Immune Estimation Resource database, TP53 = tumor protein p53, UCEC = Uterine Corpus Endometrial Carcinoma.
How to cite this article: Qiu X, Guo D, Du J, Bai Y, Wang F. A novel biomarker, MRPS12 functions as a potential oncogene in ovarian cancer and is a promising prognostic candidate. Medicine. 2021;100:8(e24898).
Ethics approval was not applicable to this study, since all the results of this study were analyzed and generated by public online databases.
The authors have no funding and conflicts of interests to disclose.
The datasets generated during and/or analyzed during the current study are publicly available.
References
- [1].Bray F, Ferlay J, Soerjomataram I, et al. Global cancer statistics 2018: GLOBOCAN estimates of incidence and mortality worldwide for 36 cancers in 185 countries. CA Cancer J Clin 2018;68:394–424. [DOI] [PubMed] [Google Scholar]
- [2].Lheureux S, Gourley C, Vergote I, et al. Epithelial ovarian cancer. Lancet 2019;393:1240–53. [DOI] [PubMed] [Google Scholar]
- [3].Karnezis AN, Cho KR, Gilks CB, et al. The disparate origins of ovarian cancers: pathogenesis and prevention strategies. Nat Rev Cancer 2017;17:65–74. [DOI] [PubMed] [Google Scholar]
- [4].Pacheu-Grau D, Perez-Delgado L, Gomez-Diaz C, et al. Mitochondrial ribosome and Meniere's disease: a pilot study. Eur Arch Otorhinolaryngol 2012;269:2003–8. [DOI] [PubMed] [Google Scholar]
- [5].Emperador S, Pacheu-Grau D, Bayona-Bafaluy MP, et al. An MRPS12 mutation modifies aminoglycoside sensitivity caused by 12S rRNA mutations. Front Genet 2014;5:469–82. [DOI] [PMC free article] [PubMed] [Google Scholar]
- [6].Rego AC, Oliveira CR. Mitochondrial dysfunction and reactive oxygen species in excitotoxicity and apoptosis: implications for the pathogenesis of neurodegenerative diseases. Neurochem Res 2003;28:1563–74. [DOI] [PubMed] [Google Scholar]
- [7].Tang N-Y, Chueh F-S, Yu C-C, et al. Benzyl isothiocyanate alters the gene expression with cell cycle regulation and cell death in human brain glioblastoma GBM 8401 cells. Oncol Rep 2016;35:2089–96. [DOI] [PubMed] [Google Scholar]
- [8].Rhodes DR, Kalyana-Sundaram S, Mahavisno V, et al. Oncomine 3.0: genes, pathways, and networks in a collection of 18,000 cancer gene expression profiles. Neoplasia 2007;9:166–80. [DOI] [PMC free article] [PubMed] [Google Scholar]
- [9].Nagy A, Lanczky A, Menyhart O, et al. Validation of miRNA prognostic power in hepatocellular carcinoma using expression data of independent datasets. Sci Rep 2018;8:9227–36. [DOI] [PMC free article] [PubMed] [Google Scholar]
- [10].Li T, Fan J, Wang B, et al. TIMER: a web server for comprehensive analysis of tumor-infiltrating immune cells. Cancer Res 2017;77:e108–10. [DOI] [PMC free article] [PubMed] [Google Scholar]
- [11].Subramanian A, Tamayo P, Mootha VK, et al. Gene set enrichment analysis: a knowledge-based approach for interpreting genome-wide expression profiles. Proc Natl Acad Sci U S A 2005;102:15545–50. [DOI] [PMC free article] [PubMed] [Google Scholar]
- [12].Tang Z, Kang B, Li C, et al. GEPIA2: an enhanced web server for large-scale expression profiling and interactive analysis. Nucleic Acids Res 2019;47:W556–60. [DOI] [PMC free article] [PubMed] [Google Scholar]
- [13].Bonome T, Levine DA, Shih J, et al. A gene signature predicting for survival in suboptimally debulked patients with ovarian cancer. Cancer Res 2008;68:5478–86. [DOI] [PMC free article] [PubMed] [Google Scholar]
- [14].Yoshihara K, Tajima A, Komata D, et al. Gene expression profiling of advanced-stage serous ovarian cancers distinguishes novel subclasses and implicates ZEB2 in tumor progression and prognosis. Cancer Sci 2009;100:1421–8. [DOI] [PMC free article] [PubMed] [Google Scholar]
- [15].Lu KH, Patterson AP, Wang L, et al. Selection of potential markers for epithelial ovarian cancer with gene expression arrays and recursive descent partition analysis. Clin Cancer Res 2004;10:3291–300. [DOI] [PubMed] [Google Scholar]
- [16].Ly JD, Grubb DR, Lawen A. The mitochondrial membrane potential [deltapsi (m)] in apoptosis; an update. Apoptosis 2003;8:115–28. [DOI] [PubMed] [Google Scholar]
- [17].Yan Junfang, Xie Yi, Wang Fang, et al. Carbon ion combined with tigecycline inhibits lung cancer cell proliferation by inducing mitochondrial dysfunction. Life Sci 2020;263:118586. [DOI] [PubMed] [Google Scholar]
- [18].Zhang H, Liu H, Shen Z, et al. Tumor-infiltrating neutrophils is prognostic and predictive for postoperative adjuvant chemotherapy benefit in patients with gastric cancer. Ann Surg 2018;267:311–8. [DOI] [PubMed] [Google Scholar]
- [19].Waniczek D, Lorenc Z, Snietura M, et al. Tumor-associated macrophages and regulatory T cells infiltration and the clinical outcome in colorectal cancer. Arch Immunol Ther Exp (Warsz) 2017;65:445–54. [DOI] [PMC free article] [PubMed] [Google Scholar]


