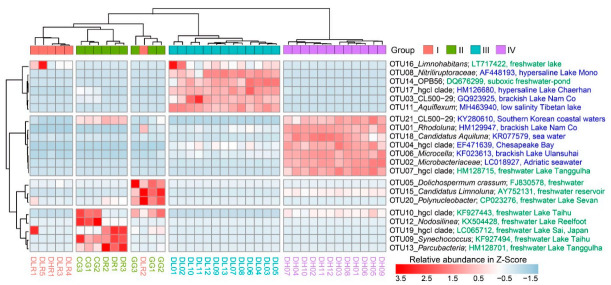
Figure 4.
Heatmap of the 21 most abundant OTUs (mean relative abundance > 1%; descending order from OTU01 to OTU21 in abundance) among freshwater rivers (Group I), freshwater lakes (Group II), low-brackish Lake Dalinor (Group III), and high-brackish Lake Daihai (Group IV). The most related counterpart of each OTU was compared using BLAST in the database of the National Center for Biotechnology Information (NCBI). The NCBI access number, and the habitat from which the organism was isolated, are given after the taxonomic information and the OTU number. Information in green denotes that the clones were isolated from freshwater, and information in blue denotes that the clones were isolated from brackish or marine habitats.

