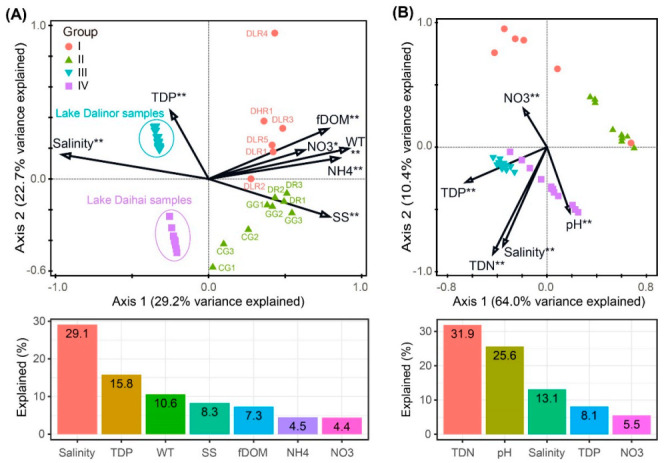
Figure 5.

Redundancy analyses (RDA) ordination plots showing the significant environmental factors in structuring variations in (A) bacterial community composition, and (B) predicted bacterial functional composition. Bar plots are presented below each RDA plot panel, showing the variation explained by each factor. Significance levels: * corrected p-value < 0.05, ** corrected p-value < 0.01. TDP, total dissolved phosphorus; WT, water temperature; SS, suspended solids; fDOM, fluorescent dissolved organic matter; NH4, ammonia nitrogen; NO3, nitrate; TDN, total dissolved nitrogen.
