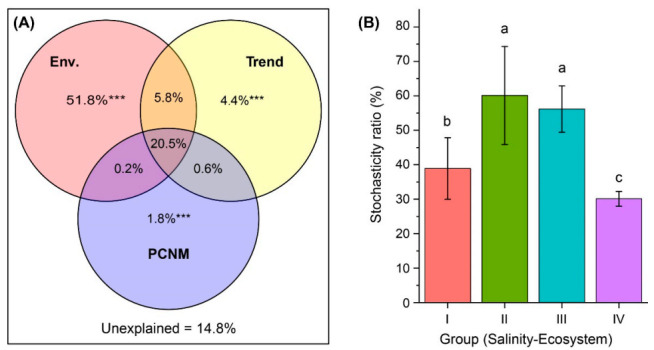
Figure 6.

Drivers of bacterial community composition (BCC) and assembly. (A) Venn diagram presenting the partitioning results for the variations in BCC by environmental variables (Env.), and the spatial variables of linear trend and principal coordinates of neighbor matrices (PCNM). The fraction values displayed are computed from adjusted R-squares. *** Permutation test p-value = 0.001. (B) Relative importance of stochastic mechanism in community assembly in freshwater rivers (Group I, mean salinity = 0.21‰), freshwater lakes (Group II, mean salinity = 0.44‰), low-brackish Lake Dalinor (Group III, mean salinity = 6.22‰), and high-brackish Lake Daihai (Group IV, mean salinity = 11.36‰). Different lower-case letters indicate significant differences (p < 0.01) among groups.
