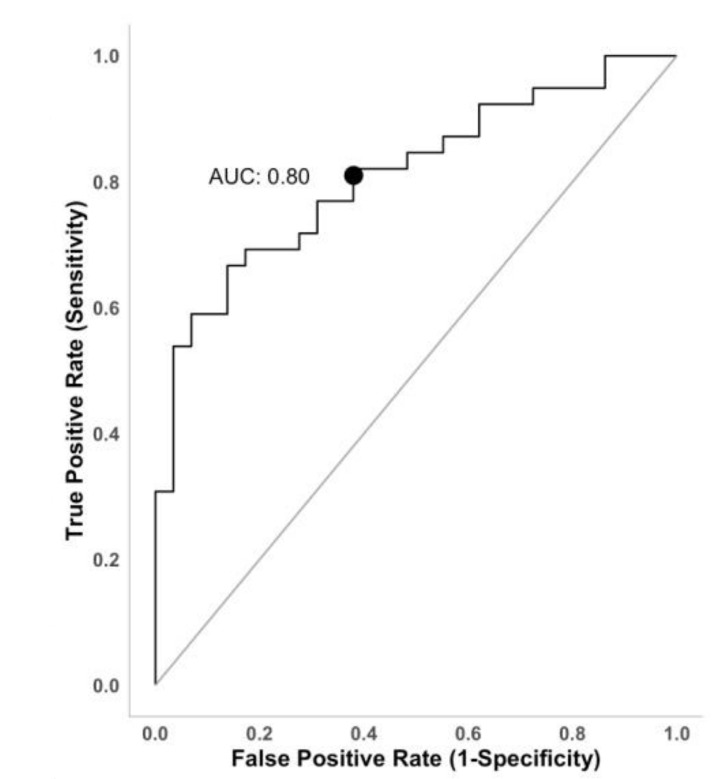
Figure 3.
ROC curve representing the diagnostic accuracy of model 2.Area under the curve (AUC) = 0.80. The sensitivity of the model was 82% meaning the ability of the model to properly recognize the subjects that consumed processed food. Specificity was 62%, indicating that 62 out of 100 non-processed food consumers were properly identified. The accuracy of the model was 75%.

