

Abstract
We examined whether driving behavior can predict preclinical Alzheimer’s disease (AD). Data from 131 cognitively normal older adults with cerebrospinal fluid (CSF) and/or positron emission tomography (PET) biomarkers were examined with naturalistic driving behavior. Receiver operating characteristic curves were used to predict the highest 10%, 25%, and 50% of values for CSF tau/Aβ42, ptau181/Aβ42, or amyloid PET. Six in vivo driving variables alone yielded area under the curves (AUC) from 0.64–0.82. Addition of age, Apolipoprotein ε4, and neuropsychological measures to the models improved the AUC (0.81 to 0.90). Driving can be used as novel neurobehavioral marker to identify presence of preclinical AD.
Keywords: Aging drivers, Alzheimer’s disease, biomarkers, driving decline, preclinical
INTRODUCTION
Alzheimer’s disease (AD) is the most common cause of dementia and cognitive impairment and is associated with impaired driving performance [1, 2]. Preclinical AD is the asymptomatic stage (~15–20 years), when early AD pathology is present, but the individual remains cognitively normal. Identifying the biological presence of AD at its earliest stage is currently accomplished using molecular biomarkers obtained via imaging and lumbar puncture [3, 4]. However, these methods present challenges in widespread use due to cost, acceptability, and availability.
Driving behavior, a widespread everyday activity, may provide a neurobehavioral marker of preclinical AD. Driving is the prevalent means of transportation for adults aged 65 and above, and the number of older drivers will continue to grow as the older adult population rapidly increases, along with the number of persons with symptomatic AD. By 2050, 88 million United States citizens are expected to be 65 years or older and 25% of all drivers will be in this age group [5]. Among cognitively normal older adults, elevated cerebrospinal fluid (CSF) tau/Aβ42 and ptau181/Aβ42 levels and widespread amyloid plaques on PET imaging are associated with increased numbers of driving errors on a road test [6]. Additionally, higher CSF tau/Aβ42 and ptau181/Aβ42 levels predict which participants will be the earliest to fail or to receive a “Marginal” or “Pass” rating on the road test when retested in the future [7]. Notably, this research found no baseline differences in cognitive functioning between persons with and without preclinical AD, suggesting that the preclinical stage of AD may have a subtle functional impact on complex behaviors such as driving which go unnoticed or undetected using traditional neuropsychological measures [6, 7].
Validation of new biomarkers typically includes determining the degree to which the candidate biomarker predicts AD neuropathology as reflected in molecular biomarkers. For example, the usefulness of plasma Aβ42/40 has been tested by examining its concordance with traditional CSF and PET biomarkers [8, 9]. We therefore sought to determine whether driving behavior discriminates older adults with and without preclinical AD. We also examined whether adding measures of age, Apolipoprotein E (APOE) genotype, and neuropsychological test scores improved the ability of the driving-based models to identify preclinical AD.
METHODS
Participants
Participants were enrolled in longitudinal studies on aging and dementia conducted at the Washington University Knight Alzheimer’s Disease Research Center and in a longitudinal driving study (R01AG056466). All participants were cognitively normal as determined by a score of 0 on the Clinical Dementia Rating (CDR®), were 65 years old or older, had a valid driver’s license, drove at least once per week, and had in vivo CSF collection and/or amyloid imaging. The study protocol was approved by the Washington University Human Research Protection Office, and written informed consent was obtained.
CSF biomarkers
Aβ42, tau, and phosphorylated tau181 (ptau181) analytes were measured using enzyme linked immunosorbant assay (ELISA) (INNOTEST; Fujirebio [formerly Innogenetics], Ghent, Belgium). Sample acquisition, processing, and storage have been described elsewhere [9]. Values of Aβ42 were adjusted using assay- and date-specific cutoffs that accounted for upward drift in INNOTEST immunoassay Aβ42 values over time [9]. Ratios were computed for Aβ42 with tau and ptau181 (tau/Aβ42; ptau181/Aβ42) and used for analyses, given our prior work supporting their strong associations with driving [7].
Imaging biomarker
Participants completed PET imaging [10] to determine amyloid burden using either Pittsburgh Compound B (PiB) or florbetapir (F-AV-45) radiotracers in a Siemens 962 HR+ECAT PET or Biograph 40 scanner (Siemens/CTI, Knoxville, KY). Amyloid burden was expressed in centiloids based on the mean cortical standardized uptake value ratio with partial volume correction via regional spread function [PIB MCSUVR RSF ≥ 16.4 and AV45 MCSUVR RSF ≥ 20.6] [11–13].
Clinical and neuropsychological tests
Participants completed annual clinical assessments which included the CDR, Mini-Mental State Examination, APOE genotyping, and neuropsychological measures (Animal Naming, Trail Making Test A and B, and the Selective Reminding Free Recall Test).
Naturalistic driving
A GPS data logger (G2 Tracking Device™, Azuga Inc, San Jose, CA) was plugged into the vehicle’s onboard diagnostics–II port and data collected every 30 seconds. This methodology, the Driving Real World In-Vehicle Evaluation System (DRIVES), collected data each time a vehicle was driven [14]. An aggressive action was triggered after surpassing a set threshold for hard braking (decrease of 8 miles per hour in one second), sudden acceleration (increase of 8 miles per hour in one second), or speeding (driving more than ≥6 miles per hour above posted speed limit). Aggressive actions (hard braking, sudden acceleration, and speeding) were recorded anytime they occurred during a trip, regardless of standard sampling. Data were collected between 7/1/15 and 4/30/19. A ‘trip’ was defined as data gathered from the period of ‘ignition on’ to ‘ignition off’. The date and distance of each trip, the time spent traveling, and the route were recorded. The mean value per month was calculated for each driving variable for each participant.
Statistical analysis
Data from participants with CSF and/or PET biomarkers within two years before or six months after the installation date of DRIVES were selected for analysis. Clinical data from the assessment date closest to date of DRIVES installation were used. Logistic regression was employed to generate receiver operating characteristic (ROC) curves to determine the ability of the DRIVES variables to identify preclinical AD as reflected by CSF tau/Aβ42, ptau181/Aβ42, or amyloid PET. To address multi-collinearity concerns, six DRIVES variables with a r <0.65 were selected (trips per month, miles per trip and average trips with: hard braking, speeding, sudden acceleration, night driving). For each biomarker, three sets of models were run identifying participants with the highest 10%, highest 25%, and highest 50% of values for that biomarker.
The modeling strategy was similar to that used by others when testing the ability of a novel biomarker to distinguish between clinical groups [8, 15]. First, the discriminant ability of the novel biomarker(s) alone is tested to discover whether it is significantly greater than chance (AUC = 0.50), and if so, the point estimate of discrimination (AUCs range from 0 to 1, with higher AUCs reflecting better discriminant ability). Later modeling steps examine whether the predictive ability of the novel biomarkers(s) alone can be enhanced by adding additional variables, such as age and APOE4 [8, 15]. In each model, the DRIVES variables were entered first, then age (midpoint taken across driving period), then APOE ε4 positivity, and then the neuropsychological test scores. Since preliminary modeling indicated no effects of sex and education on identification of biomarker positivity, they were not included in the final models. Statistical analyses were conducted in SAS version 9.4 (SAS Institute Inc.).
RESULTS
Participants (n = 131) were older (Mean = 72.2), highly educated (Mean = 16.5), and the majority were male (52.7%) and white (84.7%) (Table 1). The AUC (95% confidence interval [CI]) for predicting “high” molecular biomarker values from DRIVES variables alone ranged from 0.64 (0.53–0.75) to 0.82 (0.71–0.94) (Fig. 1); and improved significantly with the addition of age alone (Fig. 1D and E, p <0.010), age and APOE4 (Fig. 1F-I, p < 0.022), and age, APOE4, and the neuropsychological test scores (Fig. 1A, B), depending on the specific biomarkers and cutoff used. In the final models including all variables, the AUCs (95% CI) ranged from 0.81 (0.74–0.88) to 0.90 (0.81–0.99) (Fig. 1).
Table 1.
Demographics (N = 131)*
| Age (y) | 74.2 ± 4.8 |
| Education (y) | 16.5 ± 2.3 |
| Women, N (%) | 62 (47.3%) |
| Race, Caucasian, N (%) | 111 (84.7%) |
| APOE ε4+, N | 44 (33.6%) |
| MMSE (out of 30) | 29.2 ± 1.0 |
| Neuropsychological tests | |
| Selective Reminding Test – Free Recall Subtest | 31.3 ± 6.1 |
| Animal Naming | 21.1 ± 4.8 |
| Trailmaking A (s) | 31.3 ± 9.2 |
| Trailmaking B (s) | 80.0 ± 33.3 |
| DRIVES variables | |
| Number of trips per month | 109.7 ± 43.0 |
| Miles per trip (miles) | 7.2 ± 3.5 |
| Percentage of trips at night | 5.6 ± 4,8 |
| Percentage of trips with any hard braking | 8.7 ± 6.3 |
| Percentage of trips with any speeding | 9.2 ± 9.6 |
| Percentage of trips with any sudden acceleration | 4.4 ± 7.1 |
APOE ε4, Apolipoprotein E ε4; MMSE, Mini-Mental State Examination.
Mean ± Standard Deviation or count (percentage).
Fig. 1.
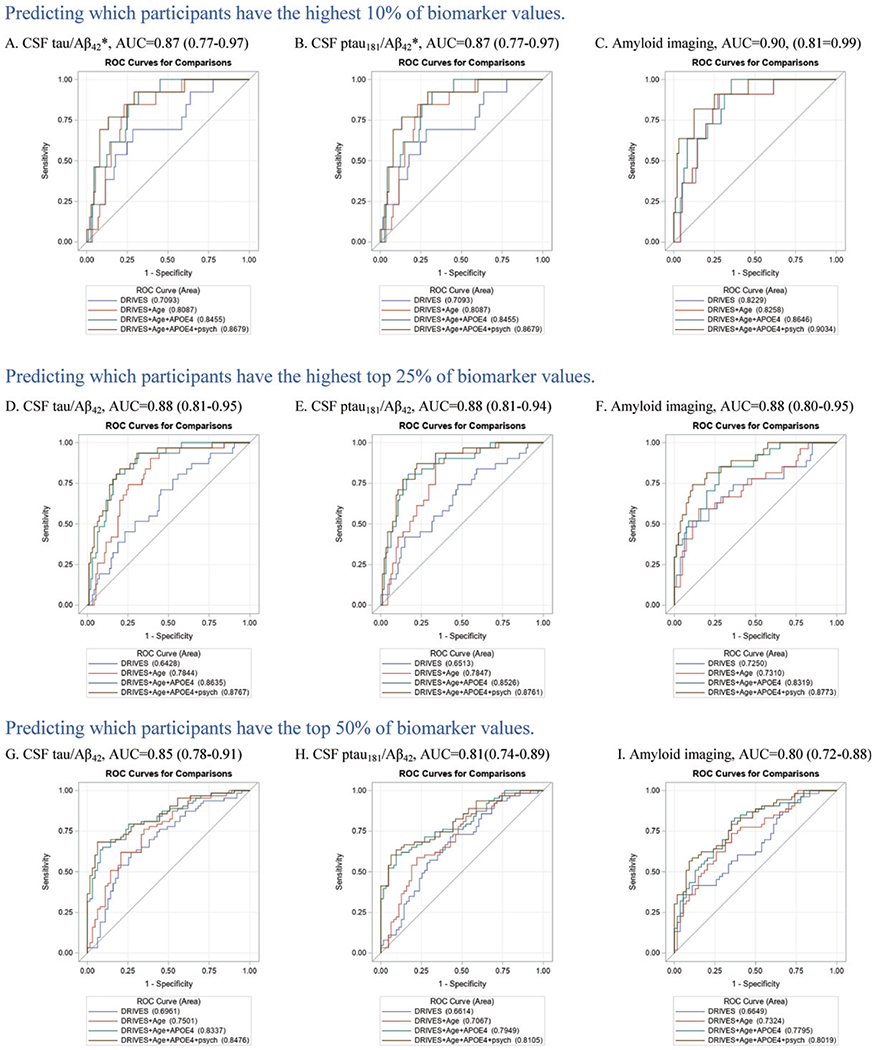
Final area under the receiver operating curves (AUC) and 95% confidence intervals for each biomarker and each cutoff examined. Legends show the AUC as each variable type is added to the model: blue = driving variables, red = age, cyan = apolipoprotein ε4 status, brown = psychometric test scores. *This cutoff resulted in the same participants being assigned to each group for the CSF tau/Aβ42 and ptau181/Aβ42 biomarkers.
DISCUSSION
Our findings suggest that driving behaviors may ultimately serve as neurobehavioral markers for identifying preclinical AD. We found that the predictive value of driving behavior can be improved by including characteristics of the individual such as age, APOE4 status, and neuropsychological test scores. As with previous work testing conventional biomarkers as predictors of cognitive status [8, 9], the ability of driving behavior to identify preclinical AD is dependent on the cutoff used to determine preclinical AD. However, for all biomarkers and all cutoffs, the driving variables together with age alone resulted in an acceptable (AUC 0.70–0.80) level of accuracy in identifying preclinical AD [16]. With the addition of APOE status and neuropsychological test scores, the predictive ability of all models increased to the excellent range (AUCs 0.80–0.90) [16].
Despite the technophilic enthusiasm of automated/driverless vehicles, widespread adoption and implementation are weighed down by cost, security, trust, privacy, reliability, and liability—human driving will continue to be the prevailing means for decades [17]. Our prior work suggests that changes in driving performance and behavior precede changes in cognitive functioning during preclinical AD [7, 18]. Since cognitive impairment symptoms may occur up to 12 years prior to an AD diagnosis [19], identifying changes in driving behavior may also move up the time to a clinical diagnosis. Further, it is possible that driving behaviors could be used to track changes in AD progression as an older adult converts to symptomatic AD.
Future research aimed at using everyday driving as a behavioral marker of AD should explore additional statistical modeling techniques to determine optimal combinations of variables, and examine additional easily-obtained variables not studied here, that may further enhance identification accuracy. Longitudinal studies should also test whether driving behaviors can predict the time to an incident dementia diagnosis. Our study participants were predominantly white and well-educated, and future work should examine the generalizability of these results to other samples. In addition to its potential use as a biomarker of preclinical AD, measurement of driving behavior among older adults has other protective benefits. Alerts indicating unsafe driving behaviors can be transmitted to the driver and/or their family member in real-time, likely increasing safety and decreasing crash risk. Drivers with AD who become disoriented or lost can be found quickly and returned home safely.
In conclusion, this proof-of-concept study indicates that the biological presence of AD can be identified by unobtrusively measuring driving behavior, a common, but complex daily activity. These findings provide a foundation for the development of novel neurobehavioral biomarkers of AD. Additional studies are needed to examine how driving behavior predicts time to a future dementia diagnosis.
ACKNOWLEDGMENTS
This research was funded by the National Institute on Aging [NIA, R01AG043434, R01AG056466, R01AG067428, R01AG068183, P50AG005681, P01AG003991, P01AG026276]; Fred Simmons and Olga Mohan, the Farrell Family Research Fund and the Charles and Joanne Knight Alzheimer Research Initiative of the Washington University Knight Alzheimer Disease Research Center (ADRC). The authors would like to express their gratitude to the research volunteers who participated in the studies from which these data were obtained and their supportive families. The authors would like to thank the Clinical, Biomarker and Imaging Cores at the Knight Alzheimer Disease Research Center for sample and data collection.
Authors’ disclosures available online (https://www.j-alz.com/manuscript-disclosures/20-1294r1)
REFERENCES
- [1].Roe CM, Ances BM, Head D, Babulal GM, Stout SH, Grant EA, Hassenstab J, Xiong C, Holtzman DM, Benzinger TLS, Schindler SE, Fagan AM, Morris JC (2018) Incident cognitive impairment: Longitudinal changes in molecular, structural and cognitive biomarkers. Brain 141, 3233–3248. [DOI] [PMC free article] [PubMed] [Google Scholar]
- [2].Alzheimer’s Association (2018) 2018 Alzheimer’s disease facts and figures. Alzheimers Dement 14, 367–429. [Google Scholar]
- [3].Jack CR Jr, Bennett DA, Blennow K, Carrillo MC, Dunn B, Haeberlein SB, Holtzman DM, Jagust W, Jessen F, Karlawish J (2018) NIA-AA Research Framework: Toward a biological definition of Alzheimer’s disease. Alzheimers Dement 14, 535–562. [DOI] [PMC free article] [PubMed] [Google Scholar]
- [4].Sperling RA, Karlawish J, Johnson KA (2013) Preclinical Alzheimer disease—the challenges ahead. Nat Rev Neurol 9, 54–58. [DOI] [PMC free article] [PubMed] [Google Scholar]
- [5].The Federal Interagency Forum on Aging-Related Statistics, Older Americans 2016: Key indicators of well-being,Federal Interagency Forum on Aging-Related Statistics, https://agingstats.gov/docs/LatestReport/Older-Americans-2016-Key-Indicators-of-WellBeing.pdf.
- [6].Roe CM, Barco PP, Head DM, Ghoshal N, Selsor N, Babulal GM, Fierberg R, Vernon EK, Shulman N, Johnson A, Fague S, Xiong C, Grant EA, Campbell A, Ott BR, Holtzman DM, Benzinger TLS, Fagan AM, Carr DB, Morris JC (2017) Amyloid imaging, cerebrospinal fluid biomarkers predict driving performance among cognitively normal individuals. Alzheimer Dis Assoc Disord 31, 69–72. [DOI] [PMC free article] [PubMed] [Google Scholar]
- [7].Roe CM, Babulal GM, Head DM, Stout SH, Vernon EK, Ghoshal N, Garland B, Barco PP, Williams MM, Johnson A (2017) Preclinical Alzheimer’s disease and longitudinal driving decline. Alzheimers Demen (N Y) 3, 74–82. [DOI] [PMC free article] [PubMed] [Google Scholar]
- [8].Schindler SE, Bollinger JG, Ovod V, Mawuenyega KG, Li Y, Gordon BA, Holtzman DM, Morris JC, Benzinger TLS, Xiong C (2019) High-precision plasma β-amyloid 42/40 predicts current and future brain amyloidosis. Neurology 93, e1647–e1659. [DOI] [PMC free article] [PubMed] [Google Scholar]
- [9].Schindler SE, Gray JD, Gordon BA, Xiong C, Batrla-Utermann R, Quan M, Wahl S, Benzinger TLS, Holtzman DM, Morris JC (2018) Cerebrospinal fluid biomarkers measured by Elecsys assays compared to amyloid imaging. Alzheimers Dement 14, 1460–1469. [DOI] [PMC free article] [PubMed] [Google Scholar]
- [10].Su Y, D’Angelo GM, Vlassenko AG, Zhou G, Snyder AZ, Marcus DS, Blazey TM, Christensen JJ, Vora S, Morris JC (2013) Quantitative analysis of PiB-PET with FreeSurfer ROIs. PLoS One 8, e73377. [DOI] [PMC free article] [PubMed] [Google Scholar]
- [11].Su Y, Flores S, Hornbeck RC, Speidel B, Vlassenko AG, Gordon BA, Koeppe RA, Klunk WE, Xiong C, Morris JC, Benzinger TLS (2018) Utilizing the Centiloid scale in cross-sectional and longitudinal PiB PET studies. Neuroimage Clin 19, 406–416. [DOI] [PMC free article] [PubMed] [Google Scholar]
- [12].Su Y, Flores S, Wang G, Hornbeck RC, Speidel B, Joseph-Mathurin N, Vlassenko AG, Gordon BA, Koeppe RA, Klunk WE, Jack CR Jr., Farlow MR, Salloway S, Snider BJ, Berman SB, Roberson ED, Brosch J, Jimenez-Velazques I, van Dyck CH, Galasko D, Yuan SH, Jayadev S, Honig LS, Gauthier S, Hsiung GR, Masellis M, Brooks WS, Fulham M, Clarnette R, Masters CL, Wallon D, Hannequin D, Dubois B, Pariente J, Sanchez-Valle R, Mummery C, Ringman JM, Bottlaender M, Klein G, Milosavljevic-Ristic S, McDade E, Xiong C, Morris JC, Bateman RJ, Benzinger TLS (2019) Comparison of Pittsburgh compound B and florbetapir in cross-sectional and longitudinal studies. Alzheimers Dement (Amst) 11, 180–190. [DOI] [PMC free article] [PubMed] [Google Scholar]
- [13].Su Y, Blazey TM, Snyder AZ, Raichle ME, Marcus DS, Ances BM, Bateman RJ, Cairns NJ, Aldea P, Cash L, Christensen JJ, Friedrichsen K, Hornbeck RC, Farrar AM, Owen CJ, Mayeux R, Brickman AM, Klunk W, Price JC, Thompson PM, Ghetti B, Saykin AJ, Sperling RA, Johnson KA, Schofield PR, Buckles V, Morris JC, Benzinger TLS (2015) Partial volume correction in quantitative amyloid imaging. Neuroimage 107, 55–64. [DOI] [PMC free article] [PubMed] [Google Scholar]
- [14].Babulal GM, Traub CM, Webb M, Stout SH, Addison A, Carr DB, Ott BR, Morris JC, Roe CM (2016) Creating a driving profile for older adults using GPS devices and naturalistic driving methodology. F1000Res 5, 2376. [DOI] [PMC free article] [PubMed] [Google Scholar]
- [15].Gaetani L, Höglund K, Parnetti L, Pujol-Calderon F, Becker B, Eusebi P, Sarchielli P, Calabresi P, Di Filippo M, Zetterberg H, Blennow K (2018) A new enzyme-linked immunosorbent assay for neurofilament light in cerebrospinal fluid: Analytical validation and clinical evaluation. Alzheimers Res Ther 10, 8. [DOI] [PMC free article] [PubMed] [Google Scholar]
- [16].Mandrekar JN (2010) Receiver operating characteristic curve in diagnostic test assessment. J Thorac Oncol 5, 1315–1316. [DOI] [PubMed] [Google Scholar]
- [17].Kaur K, Rampersad G (2018) Trust in driverless cars: Investigating key factors influencing the adoption of driverless cars. J Eng Technol Manage 48, 87–96. [Google Scholar]
- [18].Roe CM, Stout SH, Rajasekar G, Ances BM, Jones JM, Head DM, Benzinger TLS, Williams MM, Davis JD, Ott BR, Warren DK, Fagan AM, Babulal GM (2019) A 2.5 year longitudinal assessment of naturalistic driving in preclinical Alzheimer disease. J Alzheimers Dis 68, 1625–1633. [DOI] [PMC free article] [PubMed] [Google Scholar]
- [19].Bature F, Guinn BA, Pang D, Pappas Y (2017) Signs and symptoms preceding the diagnosis of Alzheimer’s disease: A systematic scoping review of literature from 1937 to 2016. BMJ Open 7, e015746. [DOI] [PMC free article] [PubMed] [Google Scholar]