

Abstract
The coronaviruses are a deadly family of epidemic viruses that can spread from one individual to another very quickly, infecting masses. The literature on epidemics indicates that the early diagnosis of a coronavirus infection can lead to a reduction in mortality rates. To prevent coronavirus disease 2019 (COVID-19) from spreading, the regular identification and monitoring of infected patients are needed. In this regard, wireless body area networks (WBANs) can be used in conjunction with machine learning and the Internet of Things (IoT) to identify and monitor the human body for health-related information, which in turn can aid in the early diagnosis of diseases. This paper proposes a novel coronavirus-body area network (CoV-BAN) model based on IoT technology as a real-time health monitoring system for the detection of the early stages of coronavirus infection using a number of wearable biosensors to examine the health status of the patient. The proposed CoV-BAN model is tested with five machine learning-based classification methods, including random forest, logistic regression, Naive Bayes, support vector machine and multi-layer perceptron classifiers, to optimize the accuracy of the diagnosis of COVID-19. For the long-term sustainability of the sensor devices, the development of energy-efficient WBAN is critical. To address this issue, a long-range (LoRa)-based IoT program is used to receive biosensor signals from the patient and transmit them to the cloud directly for monitoring. The experimental results indicate that the proposed model using the random forest classifier outperforms models using the other classifiers, with an average accuracy of 88.6%. In addition, power consumption is reduced when LoRa technology is used as a relay node.
Keywords: Coronavirus, COVID-19, WBAN, Machine learning, IoT, Biosensors
Introduction
As humanity aspires and marches towards a better life, several concerns pose serious challenges. Human health is one such concern and undoubtedly poses the most difficult challenge of all. Although medical science and technology have made great progress, resulting in remarkable improvements to health care systems worldwide, health disorders appear far more prevalent than ever. Cardiovascular and respiratory diseases affect large portions of the population. In addition, the incidence of diabetes, hyperthyroidism, cancer, etc. is growing rapidly, much to the concern of everyone in the health care industry. These diseases are still manageable since they have been around for many years. However, pandemics hit human health and the health care system worst because they are infectious, and the development of a cure/vaccines is a time-consuming process that results in high costs in terms of both resources and human lives. According to a 2016 survey from the World Health Organization (WHO), “various coronaviruses” [1] have been found in the past decade, e.g. SARS-CoV, which had an outbreak from 2002 to 2003 [2], HCoV-HKU1 and HCoV-NL63, isolated in 2004 [3], and MERS-CoV, isolated in 2012 [4]. Figure 1 represents contagious disease in terms of death percentage from https://www.who.int/. In this scenario, a technology that can detect early symptoms of a disease is most desired as it can ensure the safety of the susceptible persons.
Fig. 1.
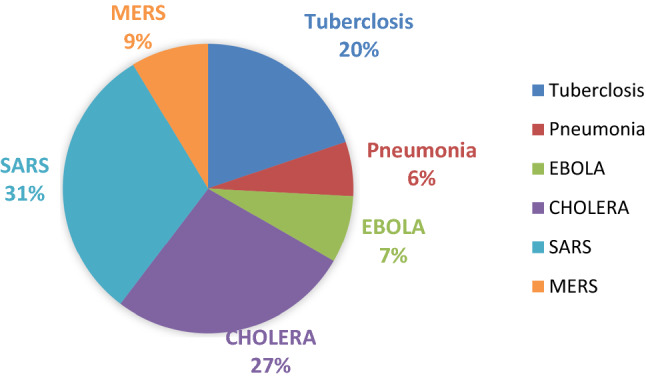
Representation of contagious diseases in terms of death percentage
Coronavirus Disease (COVID)
Whenever we think of mass deaths, either natural calamities or lethal weapons come to mind. However, another deadly and far more dangerous enemy because of its size and enigmatic nature is viruses. In recent months, the world has seen how a minuscule organism called Coronavirus can push the entire human race to the verge of extinction. Coronavirus is a lethal contagious virus that travels very fast. [1]. The infected person has symptoms of the common cold, cough, fever, nausea, body pain, difficulty breathing, sore throat, etc. [5]. In 2002–2003, a virus similar to corona called SARS [6] affected the world on an epidemic. In the case of SARS, the source was a bat and pangolins. MERS [7] is another similar type of coronavirus which spreads in the Middle East during the year(s) 2012–2013.
Corona is of a new type. It was first detected in the seafood market in Wuhan city of China on 31 December 2019. The present virus has been named as 2019-nCoV (novel coronavirus); the word novel means new. This virus is so unique that the researchers could not even think of a name. Coronavirus is zoonotic, meaning it is transmitted between animals and humans (animals suffer from respiratory, gastrointestinal, cardiovascular and neurological diseases). Subsequently, this virus spreads through human-to-human contact or exposure to a person suffering from this virus. The rate of fatality and an infected person from COVID-19 is shown in Fig. 2 from https://www.who.int/.
Fig. 2.

Graphical representation the rate of fatality and an infected person from COVID-19 up to 7 May 2020
It particularly needs time when the coronavirus increase has led to an epidemic where potential suspects are quarantined at isolated places. This poses an immediate threat to doctors and health care professionals who are in the vicinity of infected patients.
Once patient treatment is started, real-time monitoring of his or her health can be performed from a distance using a WBAN without the need to replace health care professionals in the close vicinity of the patient.
WBANs are a recent technology that can transmit the real-time health status of the patient and observe and transmit health-related data to a server. The present study makes use of a WBAN integrated with machine learning and the IoT to improve the efficiency of the WBAN in the diagnosis of diseases and to monitor patient health data by enhancing the energy consumed by biosensors employed in the network.
Wireless Body Area Networks with Machine Learning for Diagnosis of COVID-19
WBAN using machine learning is one of the talented tools that has many varieties of applications for the e-health care sector [8]. The proposed model is to detect whether an individual is suffering from COVID-19 or common cold based on the symptoms. The model is primarily based on the continuous observation of patients suffering from COVID-19.
The main functions of the proposed machine learning model are to collect data of essential body symptoms such as temperature, respiratory and oxygen levels from the cloud and classify the user (patient) on their basis in the following two categories: (i) COVID (User Infected with coronavirus), (ii) common cold (User having common cold). In the final step, continuous monitoring of COVID-19 infected persons is undertaken by the proposed IoT-based CoV-BAN model. For this purpose, logistic regression, Naive Bayes, random forest, support vector machine and multi-layer perceptron algorithm are used for calculating the user's level of infection.
Wireless Body Area Networks with the Internet of Things for Monitoring of COVID-19 Patients
WBAN belongs to category of continuous health monitoring systems known as external monitoring health care systems (eHealth), which are used to perform local monitoring and controlling. These systems aim at treating the sick without their having required to visit the hospitals frequently. Obviously, it saves precious time and emergency situations can be avoided.
The main challenge in WBAN is energy consumption as biosensors suffer from charge leaking problem so they need to replace after a certain period if biosensors are implanted inside the body; otherwise, they need to be recharged. This paper demonstrates a CoV-WBAN framework of the energy-efficient IoT model for the real-time health monitoring system for detection of an early stage of Coronavirus, which uses the three wearable biosensors such as temperature, pulse and pressure sensor to examine the health status of the patient. These biosensors generate biomedical signals including body temperature, data related to respiratory symptoms and oxygen levels. This model consists of Arduino, MySignals hardware programmed to receive the biosensor signals and transmit these to the cloud through low-power LoRa technology with minimal consumption of energy. A cloud server is used to collect, manage and transfer data, while back-end servers are responsible for demonstrating real-time data for the simulation and monitoring of the patients.
Related Work
The present section highlights the contribution of various researches employing WBAN in medical diagnosis and health care applications using machine learning-based classification with IoT. Related work is divided into two sections which are related to coronavirus disease 2019 pandemic and integration of machine learning and IoT in WBAN.
Coronavirus Disease 2019 Pandemic
Coronavirus disease 2019 (COVID-19), first identified in Wuhan, China, is caused by SARS-CoV-2. Due to the rapid spread of this virus across international borders, the WHO declared the COVID-19 outbreak a pandemic on 11 March 2020. A total of 1,279,722 COVID-19 cases have been reported globally according to the WHO as of 7 April 2020 as shown in Fig. 2. Huang et al. [9] presented a case study of the outbreak curves of COVID-19 cases from 23 January 2020 to 11 February 2020 in mainland China. They found significant differences in the ratio of cure and mortality between high- and low-income regions. Sun et al. [10] presented case study of pandemic coronavirus outbreak and analyse infectious disease knowledge about COVID-19. Driggin et al. [11] presented the evaluation of the clinician-reviewed and preprint research referring to COVID-19. Shi et al. [12] detailed study of imaging feature of CT scan and combine the clinical laboratory results may help diagnose COVID-19 pneumonia at early stage. Thevarajan et al. [13] contribute the novelty to identifying the scope and kinetics of immune responses during a non-serious COVID-19 case.
Integration of Machine Learning and IoT in WBAN
In recent years, many wireless body area network-based systems have been developed for e-health monitoring. The present section highlights the contribution of various studies employing WBAN in medical diagnosis and health care.
Notably, several outbreaks in recent years have led to increased attention to machine learning, IoT, cloud computing and WBAN. Zhou et al. [14] presented a case study on the diagnosis of COVID-19 using univariable and multivariable logistic regression. Additional examples include studying the Ebola virus outbreak using the J48 decision tree algorithm [15], the chikungunya outbreak using Fuzzy C-means clustering [16], the Zika virus outbreak using the fuzzy k-nearest neighbour algorithm [17], the MERS-CoV infection outbreak using a Bayesian belief network [18] and a pneumonia outbreak using a deep-learning framework [19, 20]. Punj et al. [21] presented a small overview of IoT functionality and its affiliation with the sensing and wireless techniques to implement the health care products in WBAN. Various machine learning algorithms for real-time health diagnosis application in WBAN were presented by [22, 23]. In [24], the authors gave a brief overview of 3D model wearable network. In [25, 26], the authors presented a detailed study on recently developing technologies machine learning, IoT, cloud computing android-based e-health applications and analysed the trials in designing a good health care system to make early-stage detection of disease and its diagnosis. Yang Z et al. [27] presented a wearable ECG monitoring system based on IoT to display the real-time ECG of the patient. Varatharajan et al. [28] proposed a DTW (dynamic time warping) algorithm for monitoring the gait signals for infected by Alzheimer's disease. Ramano et al. [29] proposed a prototype named as WEALTHY for health monitoring. It has a textile-based wearable interface and appropriate for gathering the information of biomedical like respiration rate, ECG activity, temperature and oxygen saturation level. Boulis et al. [30] presented a wireless system based on Internet of Things, which is used to deal with management problems and remote health diagnosis. The system consists of sensing, transferring, warehouse and applying on different functions for diagnosing the current health status and access the system anytime. Romero et al. [31] presented an efficient IoT approach based on computational intelligence for diagnosing Parkinson’s disease by using wearable devices for health care. This system focused on the acquisition of data and processing of signals for monitoring and continuous analysis through the wearable sensors. Shaaby et al. [32] detailed the study of machine learning models for health care. Guezguez et al. [33] proposed cloud-based WBAN model for health applications. Soliman et al. [34] presented a brief overview of the risk factor in Saudi Arab during a mass gathering in pilgrimage like Hajj and Umrah Pilgrim to control the MERS-COV. The techniques are summarized in Table 1 in terms of their advantages and disadvantages.
Table 1.
Summary of various techniques in terms of their advantages and disadvantages
| Authors | Year | Technique used | Advantages | Disadvantages | Refs. |
|---|---|---|---|---|---|
| Sandhu et al | 2015 | IoT using geographic positioning system | Middle East Respiratory Syndrome-Coronavirus (MERS-CoV) infection outbreak | Energy consumption parameters not considered | [18] |
| Kim et al | 2015 | Multi-hop WBAN scheme including multi-channel TDMA | Enhance transmission efficiency | Lack of synchronisation mechanism | [35] |
| Yang et al | 2016 | ECG monitoring system using long-range device | Wearable ECG monitoring system | Low packet transmission rate | [27] |
| Vogt et al | 2016 | Bluetooth low energy sensor for MRI scans | Lower energy consumption for WBAN | Considers less complex network scenarios | [36] |
| Maity et al | 2017 | Human Body Communication (HBC), Commercial-Off The-Shelf (COTS) | Minimizes the fitness function and root mean squared current error function | Only assumes a mesh topology | [37] |
| Abhishek Majumdar et al | 2018 | Kyasanur forest disease classification framework using neural network | Higher potential for finding the optimal solution | Not validated on residual energy functions | [22] |
| Hamid et al | 2018 | Radio frequency identification system | Dynamic approach for mobile network selection problem | Energy harvesting was not done properly | [38] |
| Kyungyong et al | 2019 | IoT and cloud for medicine management | Mobile health service in the form of a chat-bot to quickly deal with changes in human body | Higher computation time | [39] |
| Jabeen et al | 2019 | SVM, Naïve Bayes, random forest, multi-layer perceptron | Cardiovascular disease prediction | No work done upon routing link metrics | [40] |
| Raj et al | 2020 | Opportunistic energy-efficient routing algorithm | Improved performance compared to other existing protocols | Only assumes four biosensors in human body | [41] |
| Abdul et al | 2020 | Convolutional neural networks and auxiliary classifier generative adversarial network | Enhance the accuracy of COVID-19 detection with minimal data | Considers less generative adversarial network scenarios and training | [42] |
Proposed Model
The architecture of the proposed CoV-BAN model is delineated in Fig. 3. It consists of three parts:
-
i.
Part I Smart health device
-
ii.
Part II Diagnosis using machine learning
-
iii.
Part III Monitoring through IoT-WBAN
Fig. 3.

Architecture of the proposed CoV-BAN model for the diagnosis and monitoring of COVID-19 patients
Part I The user registers with the system via a mobile application using some personal details, including name, mobile number, date of birth, address, etc. After registering, the user can optionally enter the details of his or her symptoms, such as breathing or muscle issues, high fever, cough and stomach issues, or indicate that he or she is asymptomatic. The coronavirus symptoms and their respective responses are shown in Table IV. All the user's personal and health-related information is stored in the cloud database.
Part II The CoV-BAN model collects data from the cloud to determine whether a person is suffering from COVID-19 or the common cold. If the model indicates that the user is infected with COVID-19, three biosensors from the IoT-WBAN are fitted to the body of the user for continuous monitoring, as shown in Fig. 3.
Part III In this part, three biosensors, i.e. temperature sensor, pulse sensor and pressure sensor are connected to Arduino Uno and MySignals hardware kit and both devices are directly connected with long-range (LoRa) technology. The module SX1272 LoRa has to be linked to the Arduino, allowing transmissions with another module SX1272 LoRa. All health-related information sent to the patient’s private account at cloud through Wi-Fi (ESP 8266).
All health-related information can be visualized on a mobile phone or personal digital assistant with Android or iPhone apps. A cloud application programming interface provides access to the user's private account, previously stored on a medical server. The proposed model monitors and regularly checks the user until he or she recovers. Algorithm 1 shows the tasks performed by the proposed model for the diagnosis and monitoring of COVID-19 patients. Table 2 displays the list of abbreviations used in the description and development of the proposed model.
Table 2.
List of abbreviations used in the paper
| S no. | Abbreviation | Description |
|---|---|---|
| 1 | COVID-19 | Coronavirus Disease-19 |
| 2 | WBAN | Wireless Body Area Networks |
| 3 | IoT | Internet of Things |
| 4 | COV-BAN | Coronavirus-Body Area Networks |
| 5 | RFID | Radio Frequency Identification |
| 6 | UD | User Database |
| 7 | LoRa | Long-Range (low-power wide area network (LPWAN) technology |
Data Collection Component
This component is utilized to gather individual data and significant disease symptoms. Data of 493 COVID infected patients and 206 common cold patients are collected with their symptoms from cloud, and a random forest model is developed using that data. After that, every new user registers with the system by providing the personal details with symptoms and proposed machine learning model is predicted as COVID patient or common cold infected (Tables 3, 4).
Table 3.
Personal information of users
| S. no | Attributes | Description |
|---|---|---|
| 1 | Name | User name |
| 2 | DOB | User date of birth |
| 3 | Mob | User mobile number |
| 4 | Age(In Years) | Age of user |
| 5 | Gender | Gender of the user |
| 6 | Address | Patient home address |
| 7 | User email address |
Table 4.
Coronavirus symptoms and their respective responses
| Symptoms | Values |
|---|---|
| Breathing Issues | Yes/No |
| High Fever | Yes/No |
| Asymptomatic(Showing no symptoms) | Yes/No |
| Muscular Issues | Yes/No |
| Headache | Yes/No |
| Stomach Issues | Yes/No |
| Cough | Yes/No |
Algorithm to generate synthetic dataset:
Fetching dataset of COVID-19 patients
Filtering out which of them are provided with symptoms
Generating probability distribution of each symptom w.r.t. others.
Categorizing all symptoms to 6 categories(Breathing Issues, Muscular Issues, High Fever, Cough, Stomach Issues, Asymptomatic)
Putting Yes/No values according to original dataset
Mixing with dataset of people suffering from common cold and getting a hybrid dataset out of it.
Data Classifying Component
This component classifies the user based on the symptoms entered into two categories:
i. COVID (User Infected with coronavirus).
ii. Common cold (User having a common cold).
Classification is done by the random forest algorithm using a tenfold CV (cross-validation). A tree-based algorithm is utilized that provides visuals of the classification of given symptoms. As given in Fig. 4 generated by Weka 3.8.4, each client is categorized as COVID (Coronavirus Infected) or common cold. The main attribute that identifies the difference is breathing issues. If a person is having breathing problems, high fever and cough, then there are very high chances that the user is COVID infected.
Fig. 4.

A tree visualization of classification for COVID
Monitoring Component for COVID-19 Infected Peoples Using Proposed CoV-BAN Model
Coronavirus infected people require monitoring for 15–20 days under the proposed CoV-BAN model with the help of the health department. This paper demonstrates a framework of the energy-efficient IoT-based WBAN model for real-time health monitoring system, which uses the number of wearable biosensors to examine the health status of the patient. These biosensors generate biomedical signals, including body temperature, data related to respiratory symptoms and oxygen levels, as shown in Fig. 3.
Following are the main components used in the architecture of CoV-BAN:
DS18B20 is sealed digital temperature probes that precisely measures the temperatures of the subject body with a simple 1-Wire interface. Its usable temperature range is 55 °C to 125 °C (− 67°F to + 257°F). It required only one digital pin for communication. The Range of accuracy is from − 10 °C to + 85 °C. It can be used within 3.0 V to 5.5 V power/data.
SpO2 sensor measures at the periphery of the subject body, usually a finger. Pulse oximeter noninvasively detects the oxygen saturation of the blood. The sensor comprises of a red and an infrared light source, photodetectors, pulsating arterial bed. Oxygenated haemoglobin (O2Hb) and deoxygenated haemoglobin (HHb) absorbs red and infrared light differently. Saturation of haemoglobin in arterial blood can be measured by calculating light absorption variations caused by arterial blood flow pulsations.
The AMS5915 pressure sensor senses data related to respiratory symptoms. The pressure sensors are respirator and breath detection equipment in the medical field. The operating voltage of the sensor is 3.3 V and pressure range from 0–5 mbar up to 0–1 bar.
Arduino is an open-source framework used to develop projects in the field of IoT. Arduino comprises a programmable electronic circuit board and a piece of computer-operated software used to write and submit computer code to the circuit board.
MySignals hardware chip consists of sensors port and measures the biometric parameters such as temperature rate, pulse rate and respiratory rate.
Long range (LoRa) is a wireless modulation technology, based on Semtech proprietary (chirp spread spectrum) with operates in the licence-free ISM bands with 868 MHz and 915 MHz frequency. It is a low-power wide area network (LPWAN) technology that is designed for end-devices powered by batteries that can either be mobile or installed at a static location. LoRa technology delivers powerful features like long range, low power consumption and safe data transmission for IoT-WBAN applications. In the proposed model, LoRa-based devices work on a module that communicates to a location called a LoRa gateway. A LoRa gateway is used as a relay node to provide the connection between the IoT-BAN model and the network server [43]. The architecture of LoRa technology for the proposed model is displayed in Fig. 5.
Fig. 5.

The architecture of LoRa technology for the proposed model
Materials and Methods
Logistic Regression Algorithm
It is utilized to provide observations to a set of classes. It changes the yield using logistic sigmoid function to return a likelihood value [44]. A minimized cost function ( is developed for accurate classification as Eq. (1) and simultaneously update all θ_j in Eq. (2).
| 1 |
To minimize the cost function, gradient descent is run on each parameter as per following Eq. (2).
| 2 |

Naive Bayes Algorithm
Naive Bayes is a probabilistic machine learning algorithm that is utilized in several classification problems. The name naive is given because it assumes the features that go in the model are independent of each other [45] as Eq. (3):
| 3 |
where is posterior probability,
is likelihood, is class prior probability, and is predictor prior probability.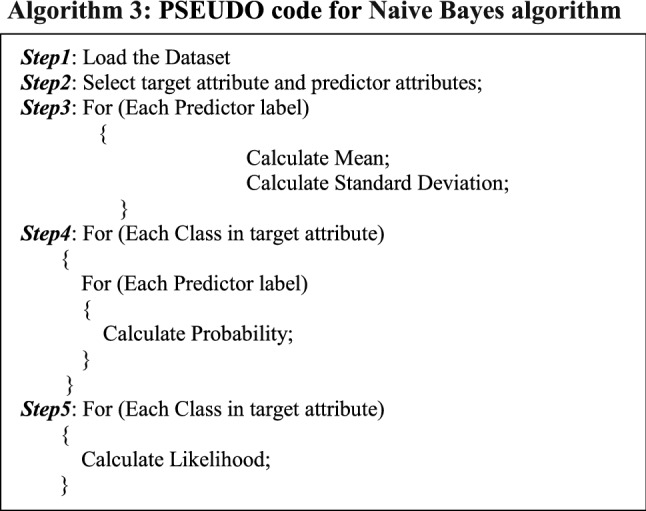
Random Forest
A random forest is a machine learning algorithm that fits a number of decision tree classifiers on various sub-samples of the dataset and uses averaging to improve the predictive accuracy and control over-fitting.
It is composed of a group of tree-structured classifiers that are independent and identically distributed random vectors, where each tree casts a single vote for the most popular category [46]. The algorithmic model applies the extensive approach of bootstrap aggregating, also called bagging, to the tree learners. Provided training set P = p1,…, pn with responses Q = q1,…, qn bagging continuously (T times) selects an arbitrary sample with substitution of the training set and fits trees to provided samples:
For t = 1,…, T:
Sample, with replacement, n training instances P, Q; call these Pt, Qt.
The regression tree t will be trained on Pt, Qt.
After the training process, predictions for concealed samples p′ can be constructed by averaging the predictions from every discrete regression tree on p′. In Eq. (4), is the average sum of predictions from all the individual regression tree on p′.
| 4 |
Bagging process guides to better model execution because this reduces the variance of the model. The predictions using a single tree are sensitive to noise present in the training set. On the other hand, the average of many tree is less sensitive to noise if trees are not correlated. Directly training many trees on a single training set will give strongly correlated trees. Furthermore, an estimate of the unreliability of the prediction can be built as to the standard deviation of the predictions from the individual regression samples on p′ as shown in Eq. (5).
| 5 |
The count of trees, T, is an independent framework. Usually, a few hundred to several thousand samples are consumed and they depend on the nature and size of the training set. Optimal count of trees T will be found using cross-validation.
Support Vector Machine Algorithm
Support vector machine (SVM) is an advanced methodology for machine learning based on the statistical research hypothesis [47, 48]. Due to excellent advancement and great precision, SVM is used to design a sophisticated classification model. It is based on a restricted count of samples in the information accommodated in the existing training data to get the effective classification results. For the nonlinear distinct case, we can use a nonlinear operator φ(z) to delineate information into a high-dimensional feature space, to develop optimized hyper-plane in feature space. Discriminant function is elucidated as given Eq. (6):
| 6 |
Generally, we tend not to realize φ(z) the precise expression, it is troublesome to perceive the distribution and the count of high-dimensional space dimensions after samples mapped to it. In high-dimensional space, the hyper-plane cannot be solved. Since only dot product is taken into consideration by SVM theory in high-dimensional feature space. The dot product can be specified directly by its correlated kernel function in Eq. (7):
| 7 |
With the inner product in place of the dot product in the optimal classification plane, we tend to remodel the initial feature space to a new feature space to obtain a new optimization function using Eq. (8):
| 8 |
where , i = 1,2,3…l.
After solving the above problems, we can get the subsequent optimal classification function SVM using Eq. (9):
| 9 |
where b is the classification threshold, we can get its value from any one of the support vectors, or get its value by taking the average of two categories from any pair of support vector.
Multi-layer Perceptron Algorithm
Multi-layer perceptron (MLP) makes robust classifiers that may layout higher-level execution in contrast with other classifiers but are usually condemned for the count of independent variables [40, 49]. Often, variables are set with the assistance of either a validation set or cross-validation procedures. MLPs are global function approximators; therefore, they will be used to build mathematical models. Classification is a specific example of regression in which the response variable is categorical so that MLPs make an effective classifier. Learning happens in the perceptron by altering connection weights after every piece of information is executed, depends on the number of errors in the output as compared to the anticipated result. Genuine perceptrons are an exceptional example of synthetic neurons that works on the threshold activation function. They can employ random activation functions. A genuine perceptron executes binary classification, MLP neurons are free to either execute regression or classification and rely on the activation function
The two common sigmoid activation functions are described in Eqs. (10) and (11)
| 10 |
| 11 |
where is the output of the neuron and is the weighted amount of the input relations.
Performance Matrices for the Proposed Model
The accuracy of several classifications on the basis of the following terms:
True Positives (TP) Rate Correctly classified features.
False Positives (FP) Rate Wrongly classified features.
Precision Out of all, the positive classes are anticipated accurately, how many are actually positive [45]. Precision is calculated as Eq. (12):
| 12 |
Recall Out of all the positive classes, are anticipated accurately. It should be maximized as possible [45]. The recall is calculated as Eq. (13):
| 13 |
Accuracy Out of all the classes, are anticipated accurately. It should be maximized as possible.
Sensitivity is the degree of the proportion of actual positive stances that got anticipated as positive.
Sensitivity is calculated as Eq. (14):
| 14 |
where TP = True Positives; FN = False Negatives.
Specificity is the measure of a proportion of actual negatives that got predicted as negative.
Specificity is calculated as Eq. (15):
| 15 |
where TN = True Negatives; FP = False Positives.
F-measure It is troublesome to compare two or more classifiers with low precision and high recall or vice-versa [45]. So to make them comparable, F-score is utilized. F-score measures Recall and Precision at the same time. It uses Harmonic Mean by punishing the extreme values more. F-measure is calculated as Eq. (16):
| 16 |
Matthews Correlation Coefficient (MCC) Some nice properties of MCC can be easily derived from this formula: when the classifier is idealized (FP = FN = 0) the value of MCC is 1, showing ideal positive correlation. On the other hand, if the classifier misclassifies (TP = TN = 0), we get a value of − 1, representing perfect negative correlation (in this case, just simply reverse the classifier’s outcome to get the ideal classifier). MCC takes into consideration all four values in the confusion matrix, and a high value (near to 1) implies that both classes are predicted well, even if one class is disproportionately under- (or over-) represented. MCC is calculated as Eq. (17):
| 17 |
Receiver Operating Characteristic (ROC) Curve ROC curve is a performance measurement for the classification problem at different threshold settings. ROC is a likelihood bend and AUC (Area Under the Curve) represents degree of separability. It defines how much model is capable of differentiating among classes.
Precision–Recall Curve (PRC) A precision–recall curve is a graph of the precision (y-axis) vs recall (x-axis) at different thresholds.
Error Rate (ERR) Error rate is calculated as the number of all incorrect predictions divided by the total number of the dataset. The best error rate is 0.0, whereas the worst is 1.0. Error rate is calculated as the total number of two incorrect predictions (FN + FP) divided by the total number of a dataset (P + N). MCC is calculated as Eq. (18):
| 18 |
Brier Score It is another accuracy metric that aids to understand the accuracy of probabilistic predictions. In other words it explains the correctness of predictions arrived. More the brier score, less the accuracy of model. Brier score is calculated as Eq. (19):
| 19 |
Integration of IoT with Proposed CoV-BAN
The whole architecture of the proposed model is based on RFID (Radio Frequency Identification) technology for transmission by using low-powered SX1272 LoRa, which makes use of continuous intermittent behaviour of biomedical signal to save energy more aggressively. Arduino and MySignals chip, after receiving the readings from the biosensor will correspond to a threshold value set as per norms of COVID-19 symptoms. The pseudocode for energy calculation of proposed CoV-BAN model is shown as Algorithm 7.
Experimentation and Performance Analysis
The proposed CoV-BAN model is actualized using the following three phases:
Evaluation of data through random forest, logistic regression, Naive Bayes, SVM and MLP classifiers
Calculation of the accuracy of the proposed model in the diagnosis of COVID-19 patients
Performance analysis concerning the energy of the proposed model
Evaluation of Data Through Random Forest, Logistic Regression, Naive Bayes, SVM and MLP Classifiers
The greatest effort was spent obtaining COVID patient data. There was an acute shortage of datasets available for the algorithm. Hence, the data were fetched from the cloud using a mobile application, from COVID suspects to train the model and obtain the results. A total of 493 patients were infected with COVID; 390 records indicated fever; 6 records indicated no symptom; 108 records indicated breathing issues is 108; records indicated cough is 242; 108 records indicated muscular issues; 19 records indicated stomach issues; and 16 records indicated headache. Table 5 shows the probability distribution of symptoms.
Table 5.
Probability distribution of symptoms
| Symptoms | Probabilities |
|---|---|
| Fever | 0.79 |
| Breathing Issues | 0.21 |
| Asymptomatic | 0.01 |
| Cough | 0.49 |
| Stomach Issues | 0.04 |
| Muscular Issues | 0.22 |
| Headache | 0.03 |
Data of coronavirus is classified into distinctive categories utilizing different classifiers (random forest, logistic regression, Naive Bayes, SVM and MLP) in Weka 3.8.4 as shown in Fig. 4. To evaluate the efficiency of each classifiers, a tenfold CV is applied. Table 6 shows the confusion matrix for random forest, logistic regression, Naive Bayes, SVM and MLP classifiers with four distinctive combinations of anticipated and actual values. Weka 3.8.4 measures the data and provides different statistical results, as given in Tables 7 and 8. Table 7 indicates the thorough accuracy of every category that is defined by the random forest, logistic regression, Naive Bayes, SVM and MLP shows the percentage of each performance measure and the weighted average is the average of both class attributes at specific weights. It is extremely useful for measuring TP rate (correctly classified by classifier), FP rate (correctly classified by classifier), Recall, Precision, Specificity, Accuracy and especially AUC–ROC Curve. Some advanced parameters like Kappa statistic (KS), Mean absolute error (MAE), Root mean squared error (RMSE), Root relative squared error (RRSE) are also measured. Table 8 shows a detailed summary of random forest, logistic regression, Naive Bayes, SVM and MLP algorithm along with tenfold CV.
Table 6.
Confusion matrix for random forest, logistic regression, Naive Bayes, SVM and MLP Actual
| Actual | ||||
|---|---|---|---|---|
| Predicted | a (COVID) | b (Common Cold) | ||
| Confusion matrix Random Forest | a (COVID) | TP = 414 | FP = 79 | |
| b (Common Cold) | FN = 1 | TN = 205 | ||
| Confusion matrix logistic regression | a (COVID) | TP = 435 | FP = 58 | |
| b (Common Cold) | FN = 88 | TN = 118 | ||
| Confusion matrix Naive Bayes | a (COVID) | TP = 450 | FP = 43 | |
| b (Common Cold) | FN = 89 | TN = 117 | ||
| Confusion matrix SVM | a (COVID) | TP = 434 | FP = 59 | |
| b (Common Cold) | FN = 87 | TN = 119 | ||
| Confusion matrix MLP | a (COVID) | TP = 416 | FP = 77 | |
| b (Common Cold) | FN = 8 | TN = 198 | ||
a = COVID, b = Common Cold, Total Tuples = 699, TP which means the patients who are actually COVID infected and are predicted COVID infected, FP which means the patients who are having common cold but predicted COVID infected, FN which means the patients who are COVID infected but predicted to have a common cold, TN which means the patients who have common cold and predicted common cold
Table 7.
Detailed accuracy category wise for random forest, logistic regression, Naive Bayes, SVM and MLP classifiers
| TP | FP | Precision | Recall | F-Measure | MCC | ROC Area | PRC Area | Class | |
|---|---|---|---|---|---|---|---|---|---|
| Detailed accuracy category wise for Random Forest | |||||||||
| 0.840 | 0.005 | 0.998 | 0.840 | 0.912 | 0.775 | 0.948 | 0.978 | COVID | |
| 0.995 | 0.160 | 0.722 | 0.995 | 0.837 | 0.775 | 0.948 | 0.862 | Common Cold | |
| Weighted Average | 0.886 | 0.051 | 0.916 | 0.886 | 0.890 | 0.775 | 0.948 | 0.944 | |
| Detailed accuracy category wise for Logistic Regression | |||||||||
| 0.882 | 0.427 | 0.832 | 0.882 | 0.856 | 0.478 | 0.864 | 0.950 | COVID | |
| 0.573 | 0.118 | 0.670 | 0.573 | 0.618 | 0.478 | 0.864 | 0.585 | Common Cold | |
| Weighted Average | 0.791 | 0.336 | 0.784 | 0.791 | 0.786 | 0.478 | 0.864 | 0.843 | |
| Detailed accuracy category wise for Naive Bayes | |||||||||
| 0.913 | 0.432 | 0.835 | 0.913 | 0.872 | 0.522 | 0.846 | 0.932 | COVID | |
| 0.573 | 0.087 | 0.731 | 0.568 | 0.639 | 0.522 | 0.846 | 0.687 | Common Cold | |
| Weighted Average | 0.791 | 0.330 | 0.804 | 0.811 | 0.804 | 0.522 | 0.846 | 0.860 | |
| Detailed accuracy category wise for SVM | |||||||||
| 0.880 | 0.422 | 0.833 | 0.880 | 0.856 | 0.479 | 0.729 | 0.818 | COVID | |
| 0.578 | 0.120 | 0.669 | 0.578 | 0.620 | 0.479 | 0.729 | 0.511 | Common Cold | |
| Weighted Average | 0.791 | 0.333 | 0.785 | 0.791 | 0.786 | 0.479 | 0.729 | 0.727 | |
| Detailed accuracy category wise for MLP | |||||||||
| 0.844 | 0.039 | 0.981 | 0.884 | 0.907 | 0.751 | 0.953 | 0.982 | COVID | |
| 0.961 | 0.156 | 0.720 | 0.961 | 0.823 | 0.751 | 0.953 | 0.854 | Common Cold | |
| Weighted Average | 0.878 | 0.073 | 0.904 | 0.878 | 0.883 | 0.751 | 0.953 | 0.944 | |
Table 8.
Detailed summary for the random forest, logistic regression, Naive Bayes, SVM and MLP along with tenfold CV
| Parameters | Random forest | Logistic regression | Naive Bayes | SVM | MLP |
|---|---|---|---|---|---|
| Correctly Classified Tuples | 619(88.555\%) | 553(79.113\%) | 567(81.1159\%) | 553(79.113\%) | 614(87.840\%) |
| Incorrectly Classified Tuples | 80(11.445\%) | 146(20.887\%) | 132(18.8841\%) | 206(20.887\%) | 85(12.160\%) |
| KS | 0.752 | 0.4753 | 0.5142 | 0.477 | 0.734 |
| MAE | 0.135 | 0.2668 | 0.2788 | 0.209 | 0.138 |
| RMSE | 0.261 | 0.3698 | 0.3781 | 0.457 | 0.268 |
| RAE | 32.392\% | 64.1292\% | 67.0.115\% | 50.211\% | 37.179\% |
| RRSE | 57.220\% | 81.1189\% | 82.9292\% | 100\% | 58.830\% |
| Total Number of Instances | 699 | 699 | 699 | 699 | 699 |
The significance of the results is measured by precision and recall of the two parameters. The random forest classification algorithm produces a high precision rate of 0.916, as shown in Fig. 6 and high recall rate of 0.886, as shown in Fig. 7. Figure 8 shows that the random forest has a low error rate, which indicates that it has greater validity in medical diagnosis than the other algorithms.
Fig. 6.
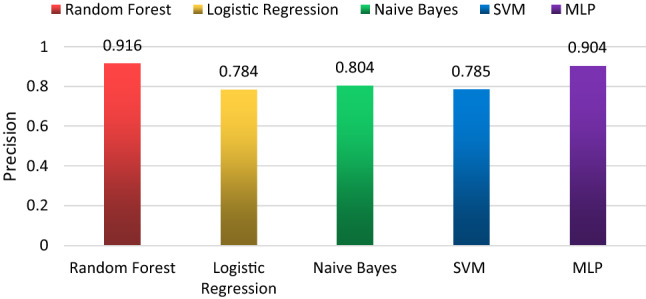
Precision of each classification algorithm
Fig. 7.
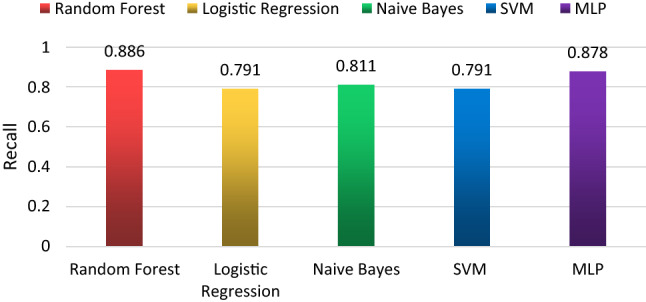
Recall of each classification algorithm
Fig. 8.
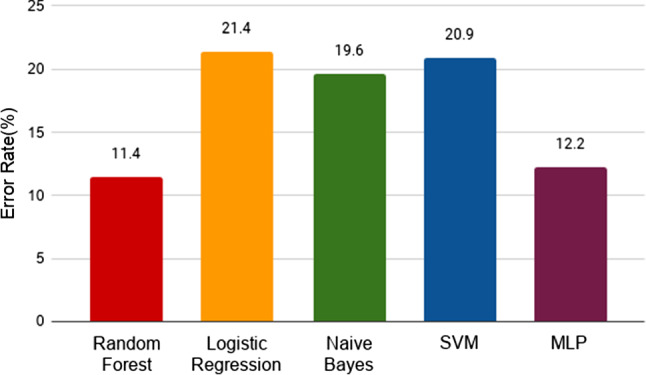
Error rate of each classification algorithm
Calculation of the Accuracy of the Proposed Model in the Diagnosis of COVID-19 Patients
The performance analysis of different classifiers was tested in the Weka tool, as shown in Table 10. The results indicate that the random forest algorithm produces higher accuracy than other classifiers, as shown in the area under curve (Fig. 9).
Table 9.
Nitty Gritty accuracy of random forest and other classification models
| Classifier | Sensitivity (\%) | Specificity (\%) | Accuracy (\%) |
|---|---|---|---|
| Random Forest | 99.8 | 99.5 | 88.6 |
| Logistic Regression | 79.1 | 20.9 | 78.6 |
| Naive Bayes | 81.1 | 18.9 | 80.4 |
| SVM | 83.3 | 57.8 | 79.1 |
| MLP | 98.1 | 96.1 | 87.8 |
Fig. 9.
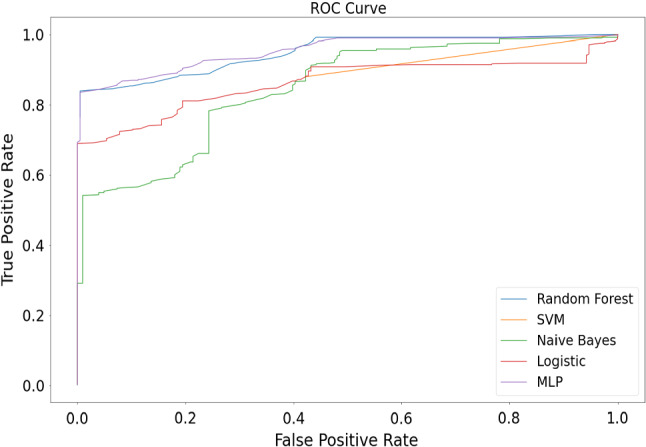
Performance analysis of different classification methods on Weka tool
The accuracy of each classification algorithm on the dataset in percentage is shown in Fig. 10. The performance of the proposed methodology is measured on the basis of various parameters such as sensitivity, specificity and accuracy. Figure 11 clearly shows that the random forest algorithm has the lowest brier score (129.96), and therefore the highest accuracy, among the algorithms. Logistic regression performs the worst on our dataset, while MLP has a similar performance to the random forest.
Fig. 10.
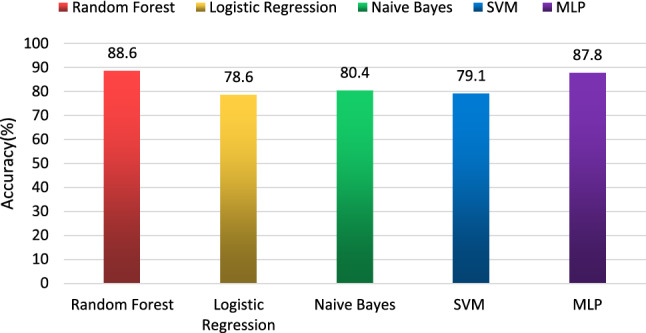
Accuracy of each classification algorithm
Fig. 11.
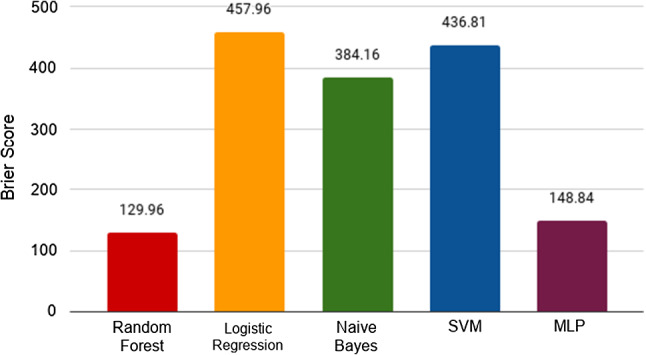
Brier Score of each classification algorithm
Performance Analysis Concerning the Energy of the Proposed Model
Generally, the quarantine associated with COVID-19 lasts 15 days after departure from the affected area. However, the quarantine period can be extended by the local department of health. Quarantine is used for people who are not sick, but are likely to be infected due to their proximity with the infected.
Altogether, all health-related information is gathered by MySignals is encrypted and sent to the private patient account at Cloud using LoRa gateway technology and Wi-Fi (ESP 8266). The real-time graphical representations of assembled data from the temperature sensor, pulse rate and pressure sensor for the proposed model are shown in Fig. 12. Figures 13 and 14 represent the graph of assembled data from temperature and SpO2 sensor, respectively.
Fig. 12.
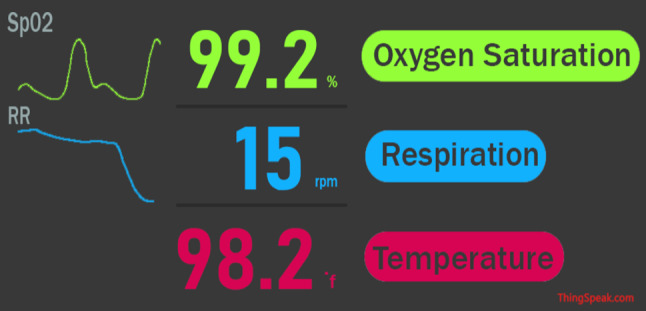
Graphical representations of gathered data from the biosensors widget on IoT Cloud
Fig. 13.
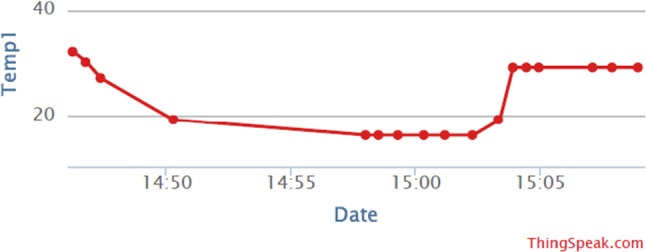
Temperature data from the DS18B20 sensor
Fig. 14.
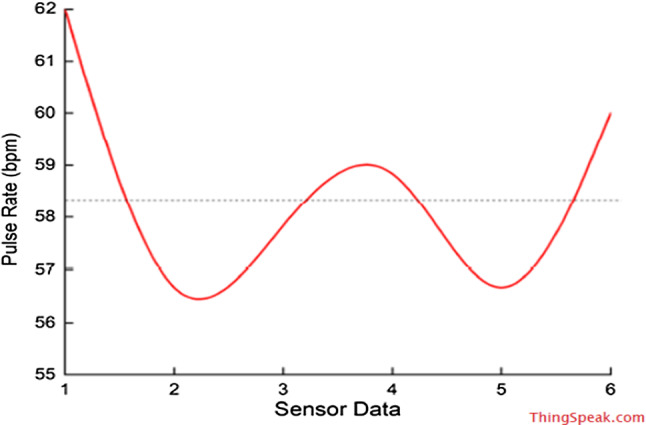
Pulse rate data from the SpO2 sensor
The transmission of the nodes through the LoRa energy harvesting module has been evaluated with lower power consumption than wireless communication, HBC Transmission, as shown in Fig. 15. Since the module has built-in Power Down and Standby modes with the high data rate, it enables RF technology ultra-low-power communication.
Fig. 15.
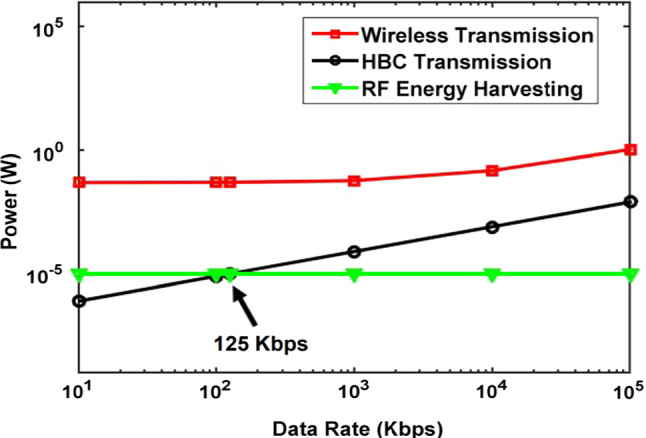
Power consumption: RF energy harvesting v/s HBC transmission v/s wireless transmission
The analysis of energy consumption of the proposed CoV-BAN is shown in ThingSpeak Cloud. ThingSpeak received power consumption of this model with each timeframe in Watt (W), as shown in Fig. 16. The total average power consumption of the model is 0.076775 W or 76.775 mW. Hence, the proposed CoV-BAN model is highly energy efficient for monitoring of COVID-19 patients. An additional advantage of wearable devices is their mobility: the user can freely move around without worrying about any damage to the sensors or his health as the Cloud can alert him promptly about any detectable change. Evaluation of proposed method against state-of-the-art methods is given in Table 9.
Fig. 16.
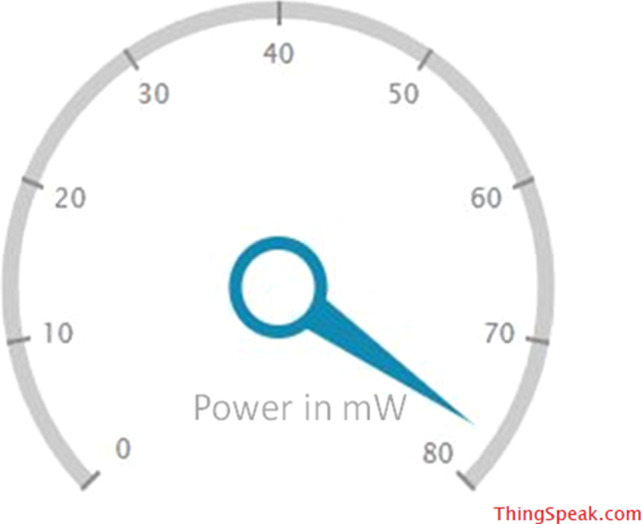
Power consumption widget on IoT Cloud
Table 10.
Evaluation of proposed method against state-of-the-art methods
| Author/ Year/ Reference | Classifications | No of parameters consider for comparison | Applied network technology | Application | Energy Efficient |
|---|---|---|---|---|---|
| Sanjay et al. [15] | J48 decision tree | Eighth | Radio Frequency Identification Device (RFID) | Ebola virus outbreak | No |
| Sanjay et al. [17] | Fuzzy k-nearest neighbour | Three | IoT using fog computing and amazon EC2 cloud | Zika virus outbreak | No |
| Verma et al. [50] | Decision tree, Bayesian Belief Network(BBN) and k-fold Cross-Validation | Four | Bluetooth and ZigBee | Smart student interactive health care system | No |
| Sood et al. [16] | Fuzzy C-means (FCM), J48 Decision tree | Six | Fog computing and social network analysis | Chikungunya virus | No |
| Mohammed et al. [45] | Naïve Bayes classification | Eight | Global positioning system and cloud computing | Blood pressure monitoring and detection | No |
| Varatharajan et al. [28] | Dynamic time warping, inertial navigation algorithm, K-NN and SVM | Two | Wi-Fi and cloud computing | Monitoring of patients infected by Alzheimer's disease | No |
| Fouzia Jabeen et al. [40] | SVM, Naïve Bayes, random forest, multi-layer perceptron | Five | Bluetooth low energy, ZigBee and fog computing | Cardiovascular disease prediction | No |
| Proposed Model (CoV-BAN) | Random forest, logistic regression, Naive Bayes, SVM and MLP | Twelve | LoRA, and low-power wide area network (LPWAN) technology | Diagnosis and monitoring of COVID-19 | Yes |
Application of Proposed Method—A Case Study
A case study examines the ability of the proposed CoV-BAN model to monitor the patients remotely. The overall functioning is described above, and this case study gives the actual implementation of our model. It evaluates the model's significance in real time. This case study has the following objectives:
Prove the ability of the model in dealing with real patients.
Verify the capability of a model to predict the correct infected status of patients
Validating that symptoms are enough to predict COVID patients with more than 80\% accuracy.
Proving that WBAN is very effective in monitoring for COVID patients.
Description
As listed in Table 11, we will use the proposed model to monitor 4 patients. Systematically considering four patients to test the proposed system and the monitoring period is of 14 days taking readings with WBAN every 8 h. All the patients are in isolation completely. The conditions of the patients are not varying much, but the symptoms of the patients are varying with time. This model is contextual-aware as it works in a real-time situation of patients and predicts their health status.
Table 11.
Patients details
| Patient 1 | Patient 2 | Patient 3 | Patient 4 | |
|---|---|---|---|---|
| Gender | Female | Male | Male | Male |
| Age | 56 | 42 | 50 | 40 |
| Monitoring Start Date | 1st April | 1st April | 1st April | 1st April |
| Health Status | Normal | Normal | Normal | Normal |
Data Generation
As described in the data collection component, each patient enters his/her symptoms. If it is predicted as COVID then the patient is shifted for monitoring using WBAN and if the patient suffers from the common cold then symptoms are collected every 8 h and the patients are kept under quarantine for 14 days, and if every time the symptom is common cold, then the patient is relieved. Symptoms are collected as given in Table 12 and shown that patient 2 was predicted as COVID on 5 April 2020.
Table 12.
A sample of monitoring dataset (symptoms of patient 2)
| Timestamp | Breathing Issues | High Fever | Muscular Issues | Headache | Stomach Issues | Cough | Category |
|---|---|---|---|---|---|---|---|
|
4-4-2020 6 AM |
No | Yes | No | No | No | No | Common Cold |
|
4-4-2020 2 PM |
No | No | No | No | No | Yes | Common Cold |
|
4-4-2020 10 PM |
No | No | Yes | Yes | No | Yes | Common Cold |
|
5-4-2020 6 AM |
No | Yes | Yes | Yes | No | Yes | COVID Infected |
|
5-4-2020 2 PM |
No | No | Yes | Yes | No | Yes | COVID Infected |
Data Exploration
In this paper, the proposed model used training dataset of 699 patients filling symptoms. Now, the data generated by this case study consist of 85 records having 4 patients’ symptoms. The proposed model predicts 3 patients as infected with COVID and 1 with a common cold. As shown in Table 13, patients 1, 2, 4 are COVID infected, and patient 3 is the common cold, and hence the biosensors resources are utilized only for those who need it.
Table 13.
Detailed analysis of each patient
| Patient 1 | Patient 2 | Patient 3 | Patient 4 | |
|---|---|---|---|---|
| Monitoring start date | 1-4-2020 | 1-4-2020 | 1-4-2020 | 1-4-2020 |
| COVID infected date and time | 1-4-2020, 2 PM | 5-4-2020, 6 AM | NEVER | 10-4-2020, 2 PM |
| WBAN monitoring start date | 1-4-2020 | 5-4-2020 | NEVER | 10-4-2020 |
| Total duration under observation | 14 Days | 14 Days | 14 Days | 14 Days |
| Category given | COVID Infected | COVID Infected | Common Cold | COVID Infected |
| Records in the dataset | 1 | 13 | 42 | 29 |
The proposed CoV-BAN model has progressed successfully in classifying patients into various classes with the support of background information, which helps the model to predict the actual health situation and related activities to produce more reliable results.
Cost Analysis
Cost is an essential aspect that needs to be considered into account in determining the economic viability of our proposed model in developing countries. In our proposed model, all simulations were performed on the same computer with stated specifications as described in Table 14.
Table 14.
Hardware and software specifications
| Name | Detailed Specifications | Category |
|---|---|---|
| CPU | Intel® Core™ I5 | Hardware |
| RAM | 4 GB | Hardware |
| Hard Drive | 1 TB | Hardware |
| Graphics Card | NVIDIA 930MX | Hardware |
| Operating System | Ubuntu 18.04 | Software |
| Software | Weka 3.8.4, Jupyter Notebook | Software |
Novelty and Contribution of the Proposed Model
The proposed model is novel and significant in the following ways:
The prime objective of this paper is to design an intelligent and energy-efficient WBAN model for the early detection and prevention of coronavirus in the very first stages.
Even though many authors have proposed various wireless health monitoring systems using machine learning and IoT for related to virus diseases in WBAN, but they have not reported about the rate of energy consumption in WBAN for monitoring of the COVID-19 patients. In this regard, the proposed model is an intelligent and energy-efficient CoV-BAN system made of a hybrid version of machine learning and IoT.
A random forest classification approach is proposed and compared with four other state-of-the-art classifiers.
A LoRa low-power relay node is responsible for monitoring various parameters, such as temperature, respiratory rate and oxygen level. The LoRa relay node is reported to work with 88.6\% accuracy in the classification of patients into suspected COVID-19 or common cold infection.
The model offers a touch-free doctor–patient interaction, thereby remarkably limiting the number of infections, particularly while dealing with pandemics such as COVID-19.
Conclusions and Future Work
Coronavirus is a contagious disease that has a high mortality rate, as it can be directly transmitted from one person to another. Currently, the early detection and prevention of COVID-19 are of great concern worldwide. In this paper, an intelligent and energy-efficient WBAN model is proposed for the diagnosis and monitoring of COVID-19 patients. A machine learning model is also proposed for classifying patients with either COVID-19 or the common cold. The user submits his or her symptoms to the cloud, and then a random forest model classifies the symptoms and determines whether the user is suffering from COVID-19 or the common cold. If the user is classified as having a COVID-19 infection, the WBAN is fitted to the user’s body for continuous monitoring. Because the transmission of signals from the various biosensors to the cloud consumes a large amount of power, energy efficiency is a significant challenge. Therefore, the proposed model uses a LoRa module as a relay node to expertly increase the power efficiency as well as the network life of the WBAN. The LoRa technology acts as an effective medium for data packet transmission, resulting in a more reliable system. The proposed model has an 88.6\% accuracy in classification and reduces power consumption using LoRa technology for the accurate transmission of readings from the biosensors.
In the future, various other classification methods can be used to improve accuracy and develop a sustainable energy-efficient model for WBAN.
Compliance with Ethical Standards
Conflict of interest
The authors declare that there is no conflict of interest.
References
- 1.Van Der Hoek L, Pyrc K, Jebbink MF, Vermeulen-oost W, Berkhout RJM, Wolthers KC, Dillen PMEW, Kaandorp J, Spaargaren J, Berkhout B. Identification of a new human coronavirus. Nat. Med. 2004;10:368–373. doi: 10.1038/nm1024. [DOI] [PMC free article] [PubMed] [Google Scholar]
- 2.Lau SKP, Woo PCY, Li KSM, Huang Y, Tsoi H, Wong BHL, Wong SSY, Leung S, Chan K, Yuen K. Severe acute respiratory syndrome coronavirus-like virus in Chinese horseshoe bats. Proc. Natl. Acad. Sci. 2005;102:14040–14045. doi: 10.1073/pnas.0506735102. [DOI] [PMC free article] [PubMed] [Google Scholar]
- 3.Woo PCY, Lau SKP, Chu C. Characterization and complete genome sequence of a novel coronavirus, Coronavirus HKU1, from patients with pneumonia characterization and complete genome sequence of a novel coronavirus, Coronavirus HKU1, from patients with pneumonia. J. Virol. 2005;79:884–895. doi: 10.1128/JVI.79.2.884. [DOI] [PMC free article] [PubMed] [Google Scholar]
- 4.Osterhaus ADME, Fouchier RAM. Isolation of a Novel Coronavirus from a Man with Pneumonia in Saudi Arabia. N. Engl. J. Med. 2012;367:1814–1820. doi: 10.1056/NEJMoa1211721. [DOI] [PubMed] [Google Scholar]
- 5.Groot RJD, Baker SC, Baric RS, Brown S, Drosten C, Enjuanes L, Ron AM, Galiano M, Gorbalenya AE, Ziad A, Perlman S, Poon LLM, Snijder EJ, Stephens GM, Woo PCY, Zaki AM, Ziebuhr J, Groot RJD, Baker SC, Baric RS, Brown CS, Drosten C, Enjuanes L, Fouchier RAM. Middle East respiratory syndrome of the coronavirus study group middle east respiratory syndrome coronavirus (MERS-CoV): announcement of the coronavirus study group identification of a novel coronavirus as a Cause. J. Virol. 2013;87:7790–7792. doi: 10.1128/JVI.01244-13. [DOI] [PMC free article] [PubMed] [Google Scholar]
- 6.Crossley BM, Barr BC, Magdesian KG. Identification of a novel coronavirus possibly associated with acute respiratory syndrome in alpacas (Vicugna pacos) in California, 2007. J. Vet. Diagnostic Investig. 2010;22:94–97. doi: 10.1177/104063871002200118. [DOI] [PubMed] [Google Scholar]
- 7.Heyuan G, Wenjie TAN, Mers-cov I. A novel human coronavirus: Middle East respiratory syndrome human coronavirus. Sci. China Life Sci. 2013;56:683–687. doi: 10.1007/s11427-013-4519-8. [DOI] [PMC free article] [PubMed] [Google Scholar]
- 8.Latré B, Braem B, Moerman I, Blondia C, Demeester P. A survey on wireless body area networks. Wirel. Netw. 2011;17:1–18. doi: 10.1007/s11276-010-0252-4. [DOI] [Google Scholar]
- 9.Huang, R., Huang, R., He, L., Province, H.: Epidemic characteristics of 2019-nCoV in China, Jan 23, 2020-Feb 11, 2020. Lancet Public Heal. (2020)
- 10.Sun K, Chen J, Viboud C. Articles Early epidemiological analysis of the coronavirus disease 2019 outbreak based on crowdsourced data: a population-level observational study. Lancet Digit. Heal. 2019 doi: 10.1016/S2589-7500(20)30026-1. [DOI] [PMC free article] [PubMed] [Google Scholar]
- 11.Driggin E, Madhavan MV, Bikdeli B, Laracy J, Bondi-zoccai G, Tyler S, Nigoghossian CD, Zidar DA, Brodie D, Beckman JA, Kirtane AJ, Stone GW, Krumholz HM, Parikh SA. Cardiovascular considerations for patients, health care workers, and health systems during the coronavirus disease 2019 (COVID-19) Pandemic. J. Am. Coll. Cardiol. 2020;75:2352–2371. doi: 10.1016/j.jacc.2020.03.031. [DOI] [PMC free article] [PubMed] [Google Scholar]
- 12.Shi H, Han X, Jiang N, Cao Y, Alwalid O, Gu J, Fan Y, Zheng C. Articles Radiological findings from 81 patients with COVID-19 pneumonia in Wuhan, China: a descriptive study. Lancet Infect. Dis. 2020;20:425–434. doi: 10.1016/S1473-3099(20)30086-4. [DOI] [PMC free article] [PubMed] [Google Scholar]
- 13.Thevarajan I, Nguyen THO, Koutsakos M, Druce J, Caly L, van de Sandt CE, Jia X, Nicholson S, Catton M, Cowie B, Tong SYC, Lewin SR, Kedzierska K. Breadth of concomitant immune responses prior to patient recovery: a case report of non-severe. Nat. Med. 2019 doi: 10.1038/s41591-020-0819-2. [DOI] [PMC free article] [PubMed] [Google Scholar]
- 14.Zhou F, Yu T, Du R, Fan G, Liu Y. Clinical course and risk factors for mortality of adult inpatients with COVID-19 in Wuhan, China: a retrospective cohort study. Lancet. 2020;395:1054–1062. doi: 10.1016/S0140-6736(20)30566-3. [DOI] [PMC free article] [PubMed] [Google Scholar]
- 15.Sareen S, Sood SK, Kumar S. IoT-based cloud framework to control Ebola virus outbreak. J. Ambient Intell. Humaniz. Comput. 2018;9:459–476. doi: 10.1007/s12652-016-0427-7. [DOI] [PMC free article] [PubMed] [Google Scholar]
- 16.Sood SK, Mahajan I. A Fog Based Healthcare Framework for Chikungunya. IEEE Internet Things J. 2017;5:794–801. doi: 10.1109/JIOT.2017.2768407. [DOI] [Google Scholar]
- 17.Sareen S, Gupta SK, Sood SK. An intelligent and secure system for predicting and preventing Zika virus outbreak using Fog computing An intelligent and secure system for predicting and preventing. Enterp. Inf. Syst. 2017;11:1436–1456. doi: 10.1080/17517575.2016.1277558. [DOI] [Google Scholar]
- 18.Sandhu R, Sood SK, Kaur G. An intelligent system for predicting and preventing MERS-CoV infection outbreak. J. Supercomput. 2015;72:3033–3056. doi: 10.1007/s11227-015-1474-0. [DOI] [PMC free article] [PubMed] [Google Scholar]
- 19.Kumar A, Tiwari P, Kumar S, Gupta D, Khanna A. Identifying pneumonia in chest X-rays: a deep learning approach. Measurement. 2019;145:511–518. doi: 10.1016/j.measurement.2019.05.076. [DOI] [Google Scholar]
- 20.Chouhan V, Singh SK, Khamparia A, Gupta D, Albuquerque VHCD. A novel transfer learning based approach for pneumonia detection in chest x-ray images. Appl. Sci. 2020;10:559. doi: 10.3390/app10020559. [DOI] [Google Scholar]
- 21.Punj R, Kumar R. Technological aspects of WBANs for health monitoring: a comprehensive review. New York: Springer; 2018. [Google Scholar]
- 22.Majumdar A, Debnath T, Sood SK, Baishnab KL. Kyasanur forest disease classification framework using novel extremal optimization tuned neural network in fog computing environment. J. Med. Syst. 2018;42:187. doi: 10.1007/s10916-018-1041-3. [DOI] [PMC free article] [PubMed] [Google Scholar]
- 23.Ramalatha, M., Shivappriya, S.N., Malarvizhi, K.: Machine learning-based cognitive support system for healthcare. In: In Body Area Network Challenges and Solutions, pp. 87–103, Cham (2019)
- 24.Kaur, M., Trivedi, A.: A 3D model analysis of mmwave wearable networks. In: In 2017 Conference on Information and Communication Technology (CICT),IEEE. p. 1–6. (2017)
- 25.Jagadeeswari V, Subramaniyaswamy V, Logesh R, Vijayakumar V. A study on medical Internet of Things and Big Data in personalized healthcare system. Heal. Inf. Sci. Syst. 2018;6:14. doi: 10.1007/s13755-018-0049-x. [DOI] [PMC free article] [PubMed] [Google Scholar]
- 26.Kumar, S., Gupta, Y., Mago, V.: Health-monitoring of pregnant women: design requirements, and proposed reference architecture. In: In 2019 16th IEEE Annual Consumer Communications & Networking Conference (CCNC), IEEE, 2019, pp. 1–6. IEEE (2019)
- 27.Yang Z, Zhou Q, Lei L, Zheng K. An IoT-cloud Based Wearable ECG Monitoring System for Smart Healthcare. J. Med. Syst. 2016;40:286. doi: 10.1007/s10916-016-0644-9. [DOI] [PubMed] [Google Scholar]
- 28.Sundarasekar R. Wearable sensor devices for early detection of Alzheimer disease using dynamic time warping algorithm. Cluster Comput. 2018;21:681–690. doi: 10.1007/s10586-017-0977-2. [DOI] [Google Scholar]
- 29.Romano, L., Coppolino, L., Elia, I.A., Spagnuolo, G.: A healthcare real-time monitoring system for multiple sensors data collection and correlation. In: In New Directions in Intelligent Interactive Multimedia Systems and Services-2, pp. 455–464, Berlin, Heidelberg (2009)
- 30.Movassaghi S, Abolhasan M, Lipman J, Smith D, Jamalipour A. Wireless body area networks: a survey. IEEE Commun. Surv. Tutorials. 2014;16:1658–1686. doi: 10.1109/surv.2013.121313.00064. [DOI] [Google Scholar]
- 31.Romero LE, Chatterjee P, Romero LE. An IoT approach for integration of computational intelligence and wearable sensors for Parkinson ’ s disease diagnosis and monitoring. Health Technol. (Berl) 2016;6:167–172. doi: 10.1007/s12553-016-0148-0. [DOI] [Google Scholar]
- 32.Al A, Hamoud S, Mohammad A. Bad smell detection using machine learning techniques: a systematic literature review. Arab. J. Sci. Eng. 2020;45:2341–2369. doi: 10.1007/s13369-019-04311-w. [DOI] [Google Scholar]
- 33.Jacem M, Slim G, Noureddine R. A sensor cloud for the provision of secure and QoS-aware healthcare services. Arab. J. Sci. Eng. 2018;43:7059–7082. doi: 10.1007/s13369-017-2954-8. [DOI] [Google Scholar]
- 34.Soliman T, Cook AR, Coker RJ. Pilgrims and MERS-CoV: what ’ s the risk ? Emerg. Themes Epidemiol. 2015;12:10–12. doi: 10.1186/s12982-015-0025-8. [DOI] [PMC free article] [PubMed] [Google Scholar]
- 35.Kim, T., Youm, S., Jung, J., Kim, E.: Multi-hop WBAN construction for healthcare IoT systems. In: In 2015 International Conference on Platform Technology and Service, pp. 27–28, Jeju, South Korea (2015)
- 36.Vogt, C., Reber, J., Waltisberg, D., Lars, B., Marjanovic, J., Niko, M.: A wearable Bluetooth LE sensor for patient monitoring during MRI scans. In: In 2016 38th Annual International Conference of the IEEE Engineering in Medicine and Biology Society, pp. 4975–4978 (2016) [DOI] [PubMed]
- 37.Maity, S., Das, D., Sen, S.: Wearable health monitoring using capacitive voltage-mode human body communication. In: In 2017 39th Annual International Conference of the IEEE Engineering in Medicine and Biology Society, pp. 2–5, Seogwipo, South Korea (2017) [DOI] [PubMed]
- 38.Hamid SA, Ismail W, Abdullah S. Dual band RFID-based blood glucose monitoring system in wireless sensor network platform. Wirel. Pers. Commun. 2018;103:2229–2244. doi: 10.1007/s11277-018-5906-z. [DOI] [Google Scholar]
- 39.Chung K, Park RC, Park RC. P2P-based open health cloud for medicine management. Peer-to-Peer Netw. Appl. 2020;13:610–622. doi: 10.1007/s12083-019-00791-7. [DOI] [Google Scholar]
- 40.Jabeen F, Maqsood M, Ghazanfar MA, Aadil F, Khan S, Kim K. An IoT based efficient hybrid recommender system for cardiovascular disease. Peer-to-Peer Netw. Appl. 2019;12:1263–1276. doi: 10.1007/s12083-019-00733-3. [DOI] [Google Scholar]
- 41.Raj AS, Chinnadurai M. Energy efficient routing algorithm in wireless body area networks for smart wearable patches. Comput. Commun. 2020;153:85–94. doi: 10.1016/j.comcom.2020.01.069. [DOI] [Google Scholar]
- 42.Waheed A, Goyal M, Gupta D, Khanna A, Al-turjman F, Pinheiro PR. CovidGAN: data augmentation using auxiliary classifier GAN for improved Covid-19 detection. IEEE Access. 2020;8:91916–91923. doi: 10.1109/ACCESS.2020.2994762. [DOI] [PMC free article] [PubMed] [Google Scholar]
- 43.Vangelista L, Zanella A, Zorzi M. Long-range IoT technologies: the dawn of LoRa. Futur. Access Enablers Ubiquitous Intell. Infrastruct. 2015;2:51–58. doi: 10.1007/978-3-319-27072-2. [DOI] [Google Scholar]
- 44.Salem O, Guerassimov A, Mehaoua A, Marcus A, Raton B, Furht B, Science C, Raton B. Anomaly detection in medical wireless sensor networks using SVM and linear regression models. Adv. VLSI Commun. Signal Process. 2014;5:20–45. doi: 10.4018/ijehmc.2014010102. [DOI] [Google Scholar]
- 45.Hassan MK, El AI, Mahmoud D, Amany MB, Mohamed MS, Gunasekaran M. EoT-driven hybrid ambient assisted living framework with Naive Bayes – firefly algorithm. Neural Comput. Appl. 2018;31:1275–1300. doi: 10.1007/s00521-018-3533-y. [DOI] [Google Scholar]
- 46.Singh K, Malhotra J. IoT and cloud computing based automatic epileptic seizure detection using HOS features based random forest classification. J. Ambient Intell. Humaniz. Comput. 2019;10:1–16. doi: 10.1007/s12652-019-01613-7. [DOI] [Google Scholar]
- 47.Dogan N, Tanrikulu Z. A comparative analysis of classification algorithms in data mining for accuracy, speed and robustness. Inf. Technol. Manag. 2013;14:105–124. doi: 10.1007/s10799-012-0135-8. [DOI] [Google Scholar]
- 48.Seo J, Laine TH, Ah K. Machine learning approaches for boredom classification using EEG. J. Ambient Intell. Humaniz. Comput. 2019;10:3831–3846. doi: 10.1007/s12652-019-01196-3. [DOI] [Google Scholar]
- 49.Park H. MLP modeling for search advertising price prediction. J. Ambient Intell. Humaniz. Comput. 2019;11:411–417. doi: 10.1007/s12652-019-01298-y. [DOI] [Google Scholar]
- 50.Verma P, Sood SK, Kalra S. Cloud-centric IoT based student healthcare monitoring framework. J. Ambient Intell. Humaniz. Comput. 2017;9:1293–1309. doi: 10.1007/s12652-017-0520-6. [DOI] [Google Scholar]