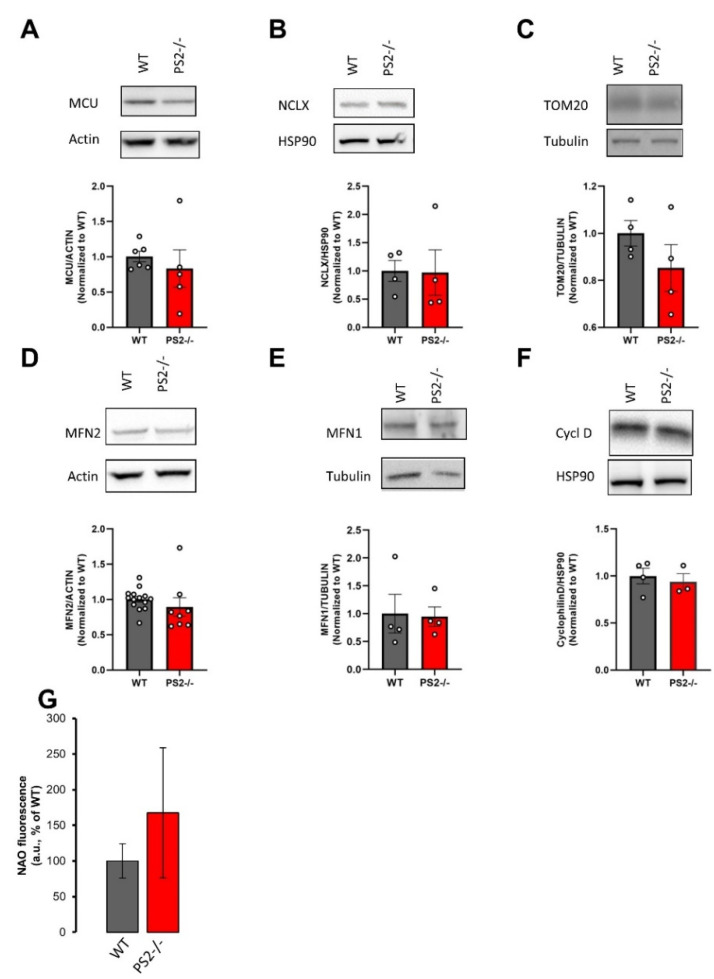
Figure 3.
The lack of PS2 does not affect the mitochondrial mass. Representative Western blots of different mitochondrial protein levels in WT and PS2–/– cortical neurons. Each sample was run in duplicate. The corresponding scatter plot represents the mean values ± SEM. Values were first normalized to their internal housekeeping proteins (as indicated) and then to those of WT samples. (A–G) Representative Western blot and quantification of: (A) mitochondrial Ca2+ uniporter (MCU) protein levels of 6 independent cultures from WT mice and 5 independent cultures from PS2–/– mice; (B) NCLX protein levels of 4 independent cultures from WT mice and from PS2–/– mice; (C) TOM20 protein levels of 4 independent cultures from WT mice and from PS2–/– mice; (D) MFN2 protein levels of 14 independent cultures from WT mice and 8 independent cultures from PS2–/– mice; (E) MFN1 protein levels of 4 independent cultures from WT mice and from PS2–/– mice; (F) cyclophilin D (cycl D) protein levels of 4 independent cultures from WT mice and 3 independent cultures from PS2–/– mice. (G) The bar graph shows the mean values ± SEM of Nonyl Acridine Orange (NAO) fluorescence (arbitrary units) from 4 independent cultures from WT mice and 3 independent cultures from PS2–/– mice, as a percentage of WT.

