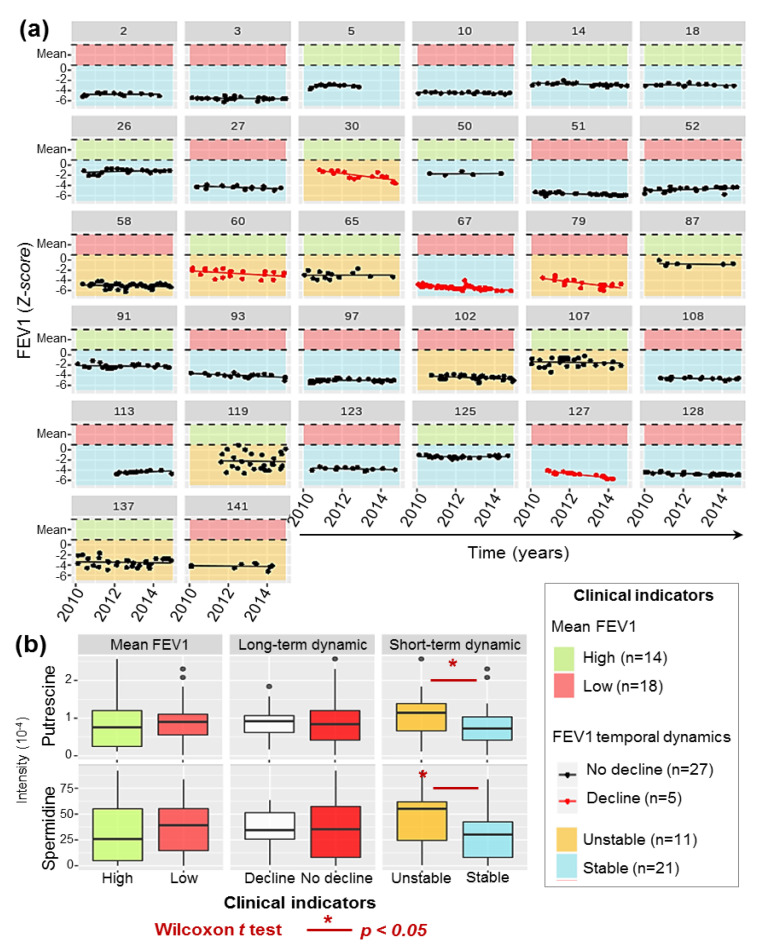
Figure 4.
Relations between patients’ respiratory functions and the production of polyamines by P.a isolates. (a) Temporal series of all FEV1 measurements realized on the 32 patients of the cohort during the follow-up period and construction of clinical indicators. Average FEV1 for each patient was defined as high (green background) or low (red background), by comparison to the cohort average. FEV1 temporal dynamics was modeled using linear regression of the FEV1 measurements overtime as follows: (i) long-term dynamic was classified as in decline (red lines) if the slope was significantly under 0, not declining (black lines) if not; (ii) short-term dynamics were defined as unstable (yellow background) if the standard deviation of the residuals was above 40% or stable (blue background) if not. (b) Boxplots showing the putrescine and spermidine production (LC-HRMS peak intensity) by P.a per FEV1 based respiratory categories. The data presented in this figure have been translated into a table to make it accessible to colorblind readers (Supplementary Table S5).

