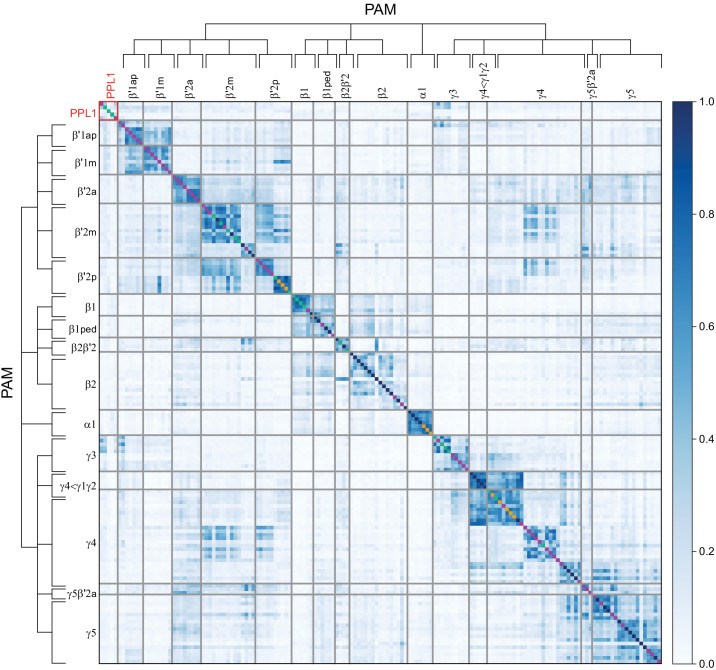
Figure 27. Similarity of input to individual DANs.
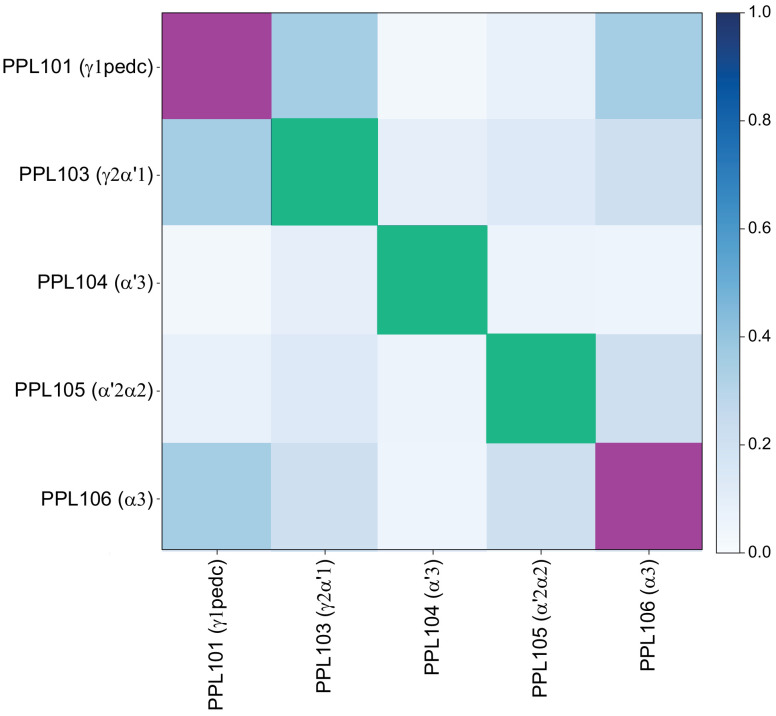
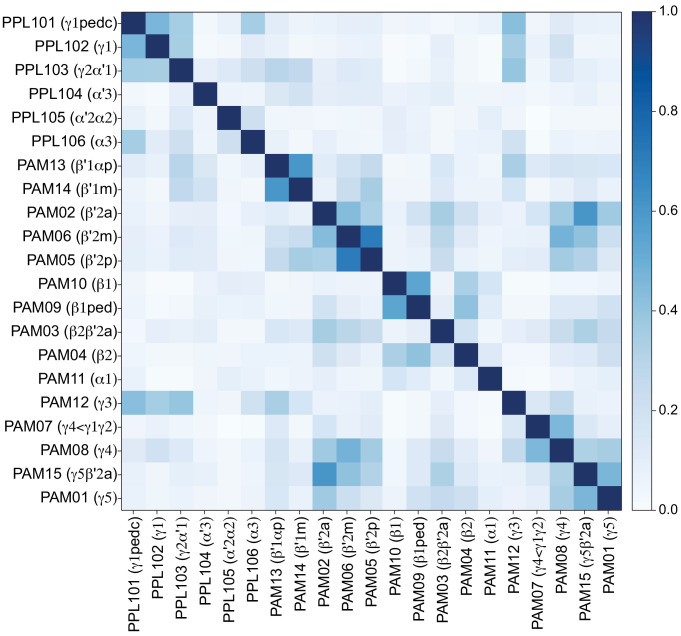
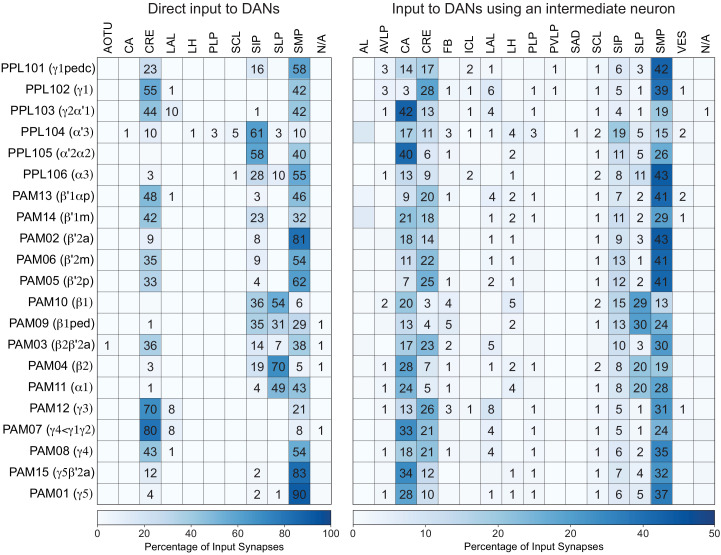
Heatmap representing the similarity of inputs received by DANs. Each square represents the cosine similarity of inputs received by each PAM or PPL1 DAN. In order to focus on inputs received outside the lobes of the MB, inputs from KCs, other DANs, APL, and DPM neurons have been excluded. DANs are grouped by type, and the ordering within each type is determined by spectral clustering. Colors on the diagonal indicate whether the given DAN receives feedback from MBONs in the same compartment (yellow), MBONs from different compartments (purple), both (green), or neither (dark blue) as defined in Figure 26. Figure 27—figure supplement 1 shows an expanded view of the PPL1 DAN portion of the heatmap. Figure 27—figure supplement 2 shows the average input similarity between DAN cell types computed after pooling the data for all cells of a given DAN cell type.

