

Abstract
Objective
The objective of this study was to describe who in British Columbia (BC) is tested for blood mercury, the distribution of their results, and the adequacy of follow-up testing.
Methods
The BC Centre for Disease Control (BCCDC) obtained records of clinician-ordered analyses of blood mercury conducted by BC laboratories during 2009 and 2010. We conducted a descriptive analysis with statistical testing of who was tested, the distribution of their blood mercury concentrations, whose results exceeded Health Canada’s proposed guidance values (8 μg/L (40 nmol/L) for children/adolescents ≤ 18 years and women 19–49 years, and 20 μg/L (100 nmol/L) for other adults), and patterns of repeat testing.
Results
Mercury test results for 6487 individuals were reviewed. Adults ≥ 50 years had the highest testing rates. The median blood mercury concentration for all tested persons was 1.8 μg/L. Nine percent of women aged 19–49 years had results exceeding Health Canada’s provisional guidance value of 8 μg/L. Data from one of BC’s two biomarker laboratories indicated that some residents of Vancouver and nearby suburbs have higher exposure to mercury than other BC residents. Of 127 individuals who had results in 2009 exceeding provisional guidance values, only 45% were tested again within 12 months.
Conclusion
Collating and analyzing all clinical biomarker testing such as blood mercury at a provincial population level allows for assessment of the adequacy and appropriateness of follow-up testing and suggests which regional and demographic strata are at higher levels of exposure.
Keywords: Epidemiology, Women’s health, Public health, Diagnostics, Family medicine, General practice, Primary care, Mercury, Biomarker, Methylmercury, Blood
Résumé
Objectif
Décrire qui, en Colombie-Britannique (C.-B.), fait l’objet de dosages du mercure sanguin, quelle est la distribution des résultats, et si les dosages de suivi sont adéquats.
Méthode
Le BC Centre for Disease Control (BCCDC) a obtenu les dossiers de dosages du mercure sanguin demandés par les cliniciens et effectués par les laboratoires de la province en 2009 et 2010. Nous avons effectué une analyse descriptive avec des contrôles statistiques des personnes testées, de la distribution de leurs concentrations de mercure sanguin, des sujets dont les résultats dépassaient les valeurs provisoires indiquées par Santé Canada (8 μg/L [40 nmol/L] pour les enfants/adolescents de ≤ 18 ans et les femmes de 19-49 ans et 20 μg/L [100 nmol/L] pour les autres adultes) et des tendances des dosages ultérieurs.
Résultats
Les résultats des dosages du mercure de 6 487 personnes ont été examinés. Les taux de dosage les plus élevés ont été observés chez les adultes de ≥ 50 ans. La concentration médiane de mercure sanguin chez toutes les personnes testées était de 1,8 μg/L. Neuf p. cent des femmes de 19 à 49 ans présentaient des résultats supérieurs à la valeur provisoire de 8 μg/L indiquée par Santé Canada. Selon les données de l’un des deux laboratoires de biomarqueurs de la C.-B., l’exposition au mercure de certains résidents de Vancouver et des banlieues proches était supérieure à celle des autres résidents de la province. Sur les 127 personnes dont les résultats en 2009 dépassaient les valeurs provisoires indiquées, 45 % seulement ont fait l’objet d’un nouveau dosage dans un délai de 12 mois.
Conclusion
La collecte et l’analyse de tous les essais cliniques sur les biomarqueurs comme le mercure sanguin à l’échelle d’une population provinciale permettent de déterminer l’adéquation et la pertinence des dosages de suivi et indiquent dans quelles strates régionales et démographiques les niveaux d’exposition sont les plus élevés.
Mots-clés: Épidémiologie, santé des femmes, santé publique, diagnostics, médecine familiale, médecine générale, soins primaires, mercure, biomarqueur, méthylmercure, sang
Introduction
Populations worldwide are exposed to both organic and non-organic forms of mercury. Workers in certain mining and manufacturing industries can come into contact with non-organic mercury, while dental amalgams are the main source of general population exposure, with mercury spills contributing exposure as well (Risher 2003). Most general population exposure to organic mercury is through fish consumption, though contaminated household products such as cosmetics also contribute (Risher 2003). Total blood mercury represents exposure to both forms, but on a population basis is overwhelmingly driven by exposure to organic mercury in fish (Honda et al. 2006; Innis et al. 2006; Clark et al. 2007; Mahaffey et al. 2009; Mahaffey and Mergler 1998; Sanzo et al. 2001; Liu et al. 2018). As a result, certain cultural communities including East and South East Asians, whose diet contains high levels of fish, would be expected to have higher than average levels of exposure (Hightower et al. 2006; McKelvey et al. 2007).
Organic mercury can have negative developmental effects on fetuses and young children (Honda et al. 2006; Council, N.R 2000; Solan and Lindow 2014; Jacobson et al. 2015). Consequently, women of childbearing age and children have been the primary targets in Canada for fish consumption advice aiming to limit mercury exposure (Abelsohn et al. 2011; Consumption Advice 2017; Avoiding mercury in fish 2017; Mercury: Your health and the environment: a resource tool 2004). While there are no official guidelines for who should be tested for mercury, Health Canada has proposed upper guidance concentrations for blood mercury: 8 μg/L (40 nmol/L) for children and adolescents ≤ 18 years and women 19–49 years, and 20 μg/L (100 nmol/L) for other adults (Legrand et al. 2010).
Description of who in BC is tested for mercury exposure and the distribution of their results by demography, place, and risk factors is almost non-existent. What is known comes primarily from biomarker assessments not specific to BC conducted as part of the Canadian Health Measures Survey (CHMS) (Lye et al. 2013). The CHMS is a national cross-sectional survey designed to describe blood mercury concentrations for a representative sample of the entire Canadian population. Results are available by sex and age group, but not by province, and the CHMS does not explicitly sample those likely to be at the upper end of the exposure distribution. By comparison, clinician-ordered data derive from patients who undergo testing based on suspicion of elevated blood mercury and the distribution of all clinician-ordered tests would be expected to tend towards higher values than the CHMS. Clinical data, when aggregated, can help identify groups and locations that may require targeted testing and intervention. Using BC clinical testing records, we describe who was tested during 2009–2010 and the distribution of their blood mercury concentrations. We identify the percentage of individuals tested whose results exceed Health Canada’s proposed guidance values and assess the adequacy and appropriateness of repeat testing of individuals with elevated and those with very low results. In light of the implementation of mandatory biomarker reporting in BC in 2019, our assessment of clinical blood mercury testing gives insight into the number of individuals in the province who will need follow-up by clinicians and public health practitioners under this reporting system. Assessing all biomarker results at a population level, as reported here, will help Canadian jurisdictions optimize the use of laboratory testing and prepare for mandatory reporting to public health.
Methods
Data
Through an information sharing agreement, Environmental Health Services at the BC Centre for Disease Control (BCCDC) obtained clinical blood mercury concentrations from all tests conducted by BC laboratories during 2009–2010 remunerated under the provincial Medical Services Plan. These data did not include workplace testing or testing as part of research studies. One hospital and one commercial laboratory processed all blood mercury tests for BC during this period; the hospital lab analyzed collections from in-patients or public outpatient labs, and the private lab analyzed samples from private outpatient collection points. Both laboratories measure total blood mercury concentrations by inductively coupled plasma mass spectrometry (ICP-MS), one using the Varian 820 and the second using the Perkin-Elmer ELAN 6100. Both labs submitted samples to the Quebec Toxicology INSPQ inter-laboratory validation program.
Data contained no personal identifiers; a laboratory ID allowed linkage of multiple tests across individuals. Population estimates for 2009 were obtained from the BC Statistics Agency’s Sub-Provincial Population Estimates (BCStats 2017).
Data cleaning
Records were excluded for non-BC residents and those with sex or age group not recorded. Data from both laboratories were merged and categorized into the following demographic strata selected to align with Health Canada’s clinical guidance values: both sexes ≤ 18 years of age (children), women 19–49 years (childbearing age), women ≥ 50 years, men 19–49 years, and men ≥ 50 years. The two laboratories had different limits of detection (LOD); we used the higher, 1.005 μg/L (5 nmol/L), when presenting the number of test results under the LOD. Data were analyzed using R version 3.2.5 (R Core Team 2014).
Descriptive analysis
Descriptive analysis comprised two parts. The first described individuals who underwent blood mercury testing at least once during 2009–2010, and the distribution of their results in relation to Health Canada’s guidance values and the LOD (1.005 μg/L). The second part described the percentage of individuals tested in 2009 who underwent repeat testing within 1 year. Because patient IDs are laboratory-specific, if someone had samples processed by both laboratories, this would be captured as two separate individuals.
Part 1: Distribution of testing and blood mercury concentrations
To describe the distribution of individuals tested rather than of all tests conducted, where multiple test results were identified for a single person, only the earliest test result was retained for analysis. Where multiple tests results were identified for a single person on the same day, the mean was used. Descriptive analysis included calculation of percentile values (75th and 95th) of blood mercury concentration, the rate tested in 2009–2010 per 100,000 population, the number and percentage of individuals with results exceeding Health Canada’s proposed guidance values (Legrand et al. 2010), and those below the LOD. We calculated geometric means after imputing values under the LOD as 1/2LOD. Findings were stratified by demographic group. Records with missing data were excluded from stratified calculations. Information on health authority of residence was available for a subset of records; 75th and 95th percentiles by health authority were compared with the percentage of each health authority’s population comprised of persons of East or South East Asian culture or heritage, a group known to have higher risk of exposure to organic mercury due to high rates of fish consumption.
Part 2: Repeat testing
Data were restructured to list all tests conducted per person during 2009–2010. Multiple identical blood mercury concentrations reported for an individual within the same calendar month were removed. To assess whether persons with high blood mercury concentrations were followed up with subsequent testing, we analyzed those who were tested at least once between January 1 and December 31, 2009. Since testing data were available for the period January 2009 to December 2010, we were able to determine if persons in this group had additional testing within 12 months of their first test in 2009, or “index” test. Using this subset, we determined the number of persons tested in 2009 whose results exceeded interim guidance levels (8 μg/L for persons under 18 years of age and women between 19 and 49 years of age, 20 μg/L for other adults) and what proportion had additional testing over a period of 12 months following the elevated index test. Similarly, we examined how many additional tests were conducted for individuals tested in 2009 whose index test was below the LOD (1.005 μg/L).
Statistical testing
We compared the observed rate of tested individuals in each stratum, the observed proportion of tests above interim guidance levels, and the observed proportion of tests above the LOD to the expected values using the chi-square goodness-of-fit test or Fisher’s exact test for counts under five. We compared the mean blood lead level for each stratum using the Kruskal-Wallis test after log-transforming the values.
Results
Part 1: Distribution of testing and blood mercury concentrations
Our dataset of British Columbian blood mercury test results from 2009 to 2010 comprised 7419 results for 6487 individuals after excluding two with sex missing and nine from outside BC. Females made up 52% of persons tested.
Overall, 147 BC residents were tested per 100,000 during 2009–2010 (Table 1). 75th and 95th percentile blood mercury concentrations for all BC residents tested were 4.2 μg/L and 12.3 μg/L, respectively. Geometric mean for the entire population was 1.7 μg/L. Women and men over 50 years were tested at the highest rates, while men over 50 had the highest 95th percentile and geometric mean blood mercury value (Table 1). Among all BC residents tested, 30% of blood mercury concentrations were below the LOD (1.005 μg/L). Children had the highest proportion of results under the LOD. Nine percent of women of childbearing age had results that exceeded 8 μg/L, Health Canada’s provisional guidance value for this group (Table 1).
Table 1.
Summary of clinician-ordered blood mercury testing in British Columbia (BC) 2009–2010 by demographic strata
| Measure | Demographic strata | ||||||
|---|---|---|---|---|---|---|---|
| Both sexes ≤ 18 years | Women 19–49 years | Women ≥ 50 years | Men 19–49 years | Men ≥ 50 years | All | ||
| Population of BC (%) | 20.1 | 22.0 | 18.7 | 22.1 | 18.7 | 100.0 | |
| Individuals tested for blood mercury, n (%)* | 520 (8.0) | 1303 (20.1) | 1886 (29.1) | 1090 (16.8) | 1688 (26.0) | 6487 (100) | |
| Proportion tested/100,000 BC residents | 57.3 | 133.8 | 233.5 | 112.2 | 225.2 | 147.1 | |
| Results < LOD* | n | 344 | 388 | 494 | 369 | 377 | 1972 |
| % | 66.2 | 29.8 | 26.2 | 33.9 | 22.3 | 30.4 | |
| Percent of results ≥ guidance value/100,000 | n | 1.2 | 12.3 | 4.1 | 1.3 | 6.3 | 5.1 |
| Geometric mean (μg/L)** | 0.73 | 1.60 | 1.84 | 1.48 | 2.22 | 1.7 | |
| Blood mercury results percentile | 75th | 1.4 | 3.8 | 4.4 | 3.8 | 5.2 | 4.2 |
| 95th | 5.6 | 10.3 | 12.7 | 10.9 | 16.0 | 12.3 | |
*Significant difference across strata, chi-square goodness of fit test (p < 0.01)
**Significant difference across strata, Kruskal-Wallis test (p < 0.01)
We examined 2787 records where health authority of residence was provided (2438 adults’ and 349 children’s records) to explore differences among health authorities; health authority was not recorded for 3700 individuals (under 1% of hospital-lab results, 71% of private lab results). 75th and 95th percentile blood mercury concentrations for all 2787 persons were 4.2 μg/L and 12.2 μg/L, respectively. Among health authorities, persons living in Vancouver Coastal Health had the highest clinical blood mercury concentrations, with 75th and 95th percentile values of 8.2 μg/L and 19.8 μg/L (Fig. 1a). 75th and 95th percentiles were highest among those living in Vancouver Coastal Health for each demographic subgroup as well as overall.
Fig. 1.
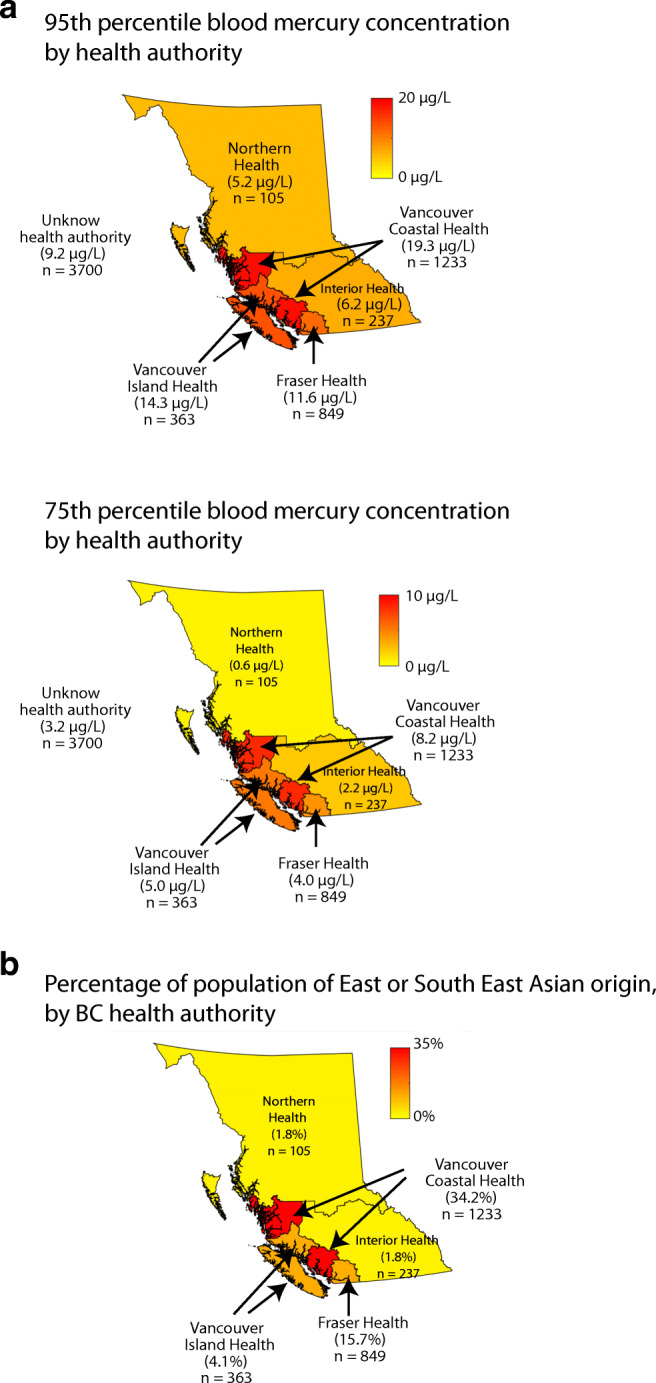
a Map showing 75th (upper) and 95th (lower) percentile of blood mercury test results in British Columbia health authorities. b Map percentage of population of East or Southeast Asian origin in British Columbia health authorities
Part 2: Follow-up testing
Of the 2861 BC residents tested in 2009, 87% had a single test conducted (n = 2479), while 13% (n = 382) had at least one subsequent test done within 12 months. These data are shown in Table 2. The number of additional tests ranged from one to eight. Of the 127 whose first 2009 test exceeded relevant guidance values, 45% had at least one additional test during the 12 months following the elevated index test (57/127). Retesting varied by demographic strata. A higher percentage of children (75%) and women ≥ 50 years (54%) with elevated blood mercury levels had additional testing. Among testees whose index test was below the LOD, 7% were retested (51/746).
Table 2.
Repeat testing of blood mercury, British Columbia (BC) 2009–2010. Table shows number of tested individuals in 2009 and repeat testing in 2009 or 2010
| Demographic strata | ||||||||
|---|---|---|---|---|---|---|---|---|
| Measure | Both sexes ≤ 18 years | Women 19–49 years | Women ≥ 50 years | Men 19–49 years | Men ≥ 50 years | All | ||
| Individuals tested in 2009 | n | 213 | 576 | 878 | 414 | 780 | 2861 | |
| Guidance level (μg/L) | 8 | 8 | 20 | 20 | 20 | – | ||
| Repeat test analysis | ||||||||
| Exceeding intervention threshold | Persons testing ≥ threshold | n | 4 | 66 | 24 | 7 | 26 | 127 |
| % | 1.9 | 11.5 | 2.7 | 1.7 | 3.3 | 4.4 | ||
| Persons with at least 1 repeat test# | n | 3 | 27 | 13 | 3 | 11 | 57 | |
| % | 75 | 40.9 | 54.2 | 42.9 | 42.3 | 44.9 | ||
| Below LOD | Persons testing < LOD | n | 143 | 133 | 206 | 114 | 150 | 746 |
| % | 67.1 | 23.1 | 23.5 | 27.5 | 19.2 | 26.1 | ||
| Persons testing with 1 or more repeat tests* | n | 2 | 9 | 19 | 10 | 11 | 51 | |
| % | 1.4 | 6.8 | 9.2 | 8.8 | 7.3 | 6.8 | ||
#Not significant difference across strata (Fisher-exact test)
*Significant difference across strata (Fisher-exact test, p > 0.01)
Discussion
Our synthesis of all clinical blood mercury analyses conducted in BC during 2009–2010 indicated a geometric mean blood mercury concentration among BC residents tested of 1.7 μg/L, well below Health Canada’s proposed guidance values of 8 μg/L for children, adolescents, and women of childbearing age and 20 μg/L for other adults. Overall, 147 BC residents were tested per 100,000 during 2009–2010 and 5 BC residents per 100,000 had results that exceeded guidance values.
This analysis was an opportunity to demonstrate that there is value in aggregating and analyzing clinical records as a way to guide clinical testing and to characterize higher-level mercury exposures at a population level for a Canadian province. It provides additional information by highlighting the absence of follow-up testing for individuals with elevated mercury results, revealing opportunities for improved guidance to physicians treating them. This synthesis of provincial clinical data complements data from the CHMS and the United States’ equivalent National Health and Nutrition Examination Survey (NHANES) by identifying which tested groups in BC have the highest 95th percentile values and therefore may be of concern, and which groups clinicians are testing most. As expected, blood mercury concentrations from clinical testing exceeded those of comparable demographic strata in published CHMS and NHANES results from similar time periods (Table 3) (Canadian Health Measures Survey: Cycle 2 data tables, 2009 to 2011 2015; Buchanan et al. 2015; National Report on Human Exposure to Environmental Chemicals 2017). Results with health authority identification information showed high blood mercury concentrations in residents of Vancouver Coastal Health Authority compared with those from other regions; this health region covers Vancouver, nearby suburbs, and communities north of Vancouver. This health region also has the highest proportion of individuals in BC of East or South East Asian culture or heritage (Fig. 1b) (2006 Census Semi-custom Profile - Health and College Regions of British Columbia 2013). Previous work has described an association of elevated blood mercury in residents of coastal communities in North America and Europe and among certain Indigenous populations in Canada and persons of East or South East Asian culture or heritage, often associated with high fish consumption (Clark et al. 2007; McKelvey et al. 2007; Hightower et al. 2006; Pirkle et al. 2016). One US study directly linked elevated methylmercury among East and South East Asians with high fish consumption (Liu et al. 2018).
Table 3.
75th and 95th percentiles for blood mercury levels from NHANES, CHMS, and BC clinical system
| Geometric mean | 75th percentile | 95th percentile | |
|---|---|---|---|
| NHANES (2009–2010)2 > 20 years | 1.04 μg/L (5.02 nmol/L) | 2.0 μg/L (9.66 nmol/L) | 5.8 μg/L (28.0 nmol/L) |
| CHMS (2009–2011)1 6–79 years | 0.72 μg/L (3.5 nmol/L) | 1.7 μg/L (8.2 nmol/L) | 5.6 μg/L (27.0 nmol/L) |
| BC clinical tests 19–49 years | 2.02 μg/L (9.8 nmol/L) | 4.2 μg/L (20.3 nmol/L) | 11.5 μg/L (55.6 nmol/L) |
1Health Canada, “Second Report on Human Biomonitoring of Environmental Chemicals in Canada - Results of the Canadian Health Measures Survey Cycle 2 (2009-2011)”, (2013)
2US Department of Health and Human Services, “Fourth National Report on Human Exposure to Environmental Chemicals”, (2018)
Clinical data also allow us to identify who undergoes possibly inappropriate repeat testing, including those with very low blood mercury concentrations for whom additional testing seems unnecessary, and those with elevated blood mercury concentrations who should, but do not, undergo repeat testing. The median half-life in blood of organic mercury is 50 days (Mercury Biomonitoring Summary 2016). Therefore, if a person with elevated results received clinical advice to make changes to reduce mercury exposure, specifically reducing fish intake, it would be reasonable to conduct follow-up testing within a few months of the elevated test in order to monitor progress. We found that 12% of women aged 19–49 years tested in 2009 (66/576) had blood mercury levels above provisional guidance value, of whom only four in ten had additional testing within 12 months, which argues for improved follow-up for this group. It was surprising that 7% of men and 9% of women ≥ 50 years who had 2009 results below the LOD were tested again within 12 months, suggesting that this age group undergoes more testing than is optimal.
Mandatory reporting of biometric data by laboratories to provincial health bodies could improve clinical follow-up by allowing investigation into, and control of, environmental/occupational exposures as well as by providing detailed data about follow-up to shape guidelines. Until 2019, Quebec was the only Canadian jurisdiction requiring reporting of blood mercury analyses. Mandatory reporting was initiated in BC in 2019 for selected metals including mercury (Reporting Information Affecting Public Health Regulation 2018). The results from this study provide an estimate of the volume and nature of higher test results requiring public health follow-up that might be expected under mandatory reporting in BC and other Canadian jurisdictions.
A major limitation for this analysis was the inability to examine subprovincial geographic differences for records from both laboratories, as health authority of residence was only consistently available for one. Future work using results from both could confirm the finding that residents of the Vancouver Coastal Health region have greater exposure to mercury than residents of other parts of BC. With city-level data, such analysis might identify geographic hotspots of elevated mercury in specific demographic strata. Other limitations included the exclusion of workplace testing, preventing the identification of individuals at high levels of occupational exposure; repeat testing could only be identified when testing was conducted by the same laboratory; the absence of additional demographic details, risk factor profiles, or reasons for testing. As notification of biometric testing results is now mandatory in BC, surveillance data will be improved. These improvements may include enhanced capture of risk factors and demographic data during follow-up of individuals with high results and linkage of patient records across testing laboratories and with medical and hospital records.
A second significant limitation is that the results presented here are not directly generalizable to the entire province, as tested individuals are not representative of the general population. Persons undergoing clinician-ordered tests may have known exposure risks such as high fish intake, or they may have symptoms that have triggered diagnostic testing. These factors would be expected to shift our results towards higher proportions of elevated results.
Conclusion
We found that a significant number of women of childbearing age exceeded Health Canada’s provisional guidance value of 8 μg/L for this group, and that follow-up testing could be optimized to prioritize individuals with elevated results in high-risk groups and to reduce unnecessary testing of people, particularly those ≥ 50 years old, who have had low blood mercury results in the past year. This study suggests the potential for synthesizing clinical blood mercury testing to identify higher-level population exposures. The main advantages of using clinical data include the ability to quantify testing by demographic group and at a fine geographic level and to describe repeat testing patterns. Mandatory reporting of blood mercury results along with public health follow-up could help clinicians target advice to persons with higher levels of exposure, and increase follow-up testing of groups whose results exceed provisional guidance values.
Funding information
This research was funded by the Provincial Health Services Authority (grant number 75604030).
Compliance with ethical standards
Conflict of interest
The authors declare that they have no conflict of interest.
Footnotes
Publisher’s note
Springer Nature remains neutral with regard to jurisdictional claims in published maps and institutional affiliations.
References
- 2006 Census Semi-custom Profile - Health and College Regions of British Columbia. (2013). Open Data. Ministry of Jobs, Trade and Technology - BC Stats. https://catalogue.data.gov.bc.ca/dataset/2006-census-semi-custom-profile-health-and-college-regions-of-british-columbia.
- Abelsohn A, et al. Healthy fish consumption and reduced mercury exposure: Counseling women in their reproductive years. Canadian Family Physician. 2011;57(1):26–30. [PMC free article] [PubMed] [Google Scholar]
- Avoiding mercury in fish. (2017). Available from: https://www.healthlinkbc.ca/health-topics/tn6745spec.
- BCStats . Sub-provincial Population Estimates. Victoria: Government of British Columbia; 2017. [Google Scholar]
- Buchanan S, Anglen J, Turyk M. Methyl mercury exposure in populations at risk: Analysis of NHANES 2011-2012. Environmental Research. 2015;140:56–64. doi: 10.1016/j.envres.2015.03.005. [DOI] [PubMed] [Google Scholar]
- Canadian Health Measures Survey: Cycle 2 data tables, 2009 to 2011. (2015). Ottawa: Statistics Canada. https://www150.statcan.gc.ca/n1/en/pub/82-626-x/82-626-x2012002-eng.pdf?st=usYgUuvt.
- Clark NA, et al. Trace element levels in adults from the west coast of Canada and associations with age, gender, diet, activities, and levels of other trace elements. Chemosphere. 2007;70(1):155–164. doi: 10.1016/j.chemosphere.2007.06.038. [DOI] [PubMed] [Google Scholar]
- Consumption Advice. Making informed choices about fish. (2017) [cited 2017; Available from: https://www.canada.ca/en/health-canada/services/food-nutrition/food-safety/chemical-contaminants/environmental-contaminants/mercury/mercury-fish.html.
- Health Canada Mercury Issues Task Group. (2004). Mercury: Your health and the environment: a resource tool. https://www.canada.ca/en/health-canada/services/environmental-workplace-health/reports-publications/environmental-contaminants/mercury-your-health-environment-resource-tool.html.
- Hightower JM, O’Hare A, Hernandez GT. Blood mercury reporting in NHANES: Identifying Asian, Pacific Islander, Native American, and multiracial groups. Environmental Health Perspectives. 2006;114(2):173–175. doi: 10.1289/ehp.8464. [DOI] [PMC free article] [PubMed] [Google Scholar]
- Honda S, Hylander L, Sakamoto M. Recent advances in evaluation of health effects on mercury with special reference to methylmercury-a minireview. Environmental Health and Preventive Medicine. 2006;11(4):171–176. doi: 10.1007/BF02905275. [DOI] [PMC free article] [PubMed] [Google Scholar]
- Innis SM, et al. Increased levels of mercury associated with high fish intakes among children from Vancouver, Canada. The Journal of Pediatrics. 2006;148(6):759–763. doi: 10.1016/j.jpeds.2006.02.001. [DOI] [PubMed] [Google Scholar]
- Jacobson JL, et al. Relation of prenatal methylmercury exposure from environmental sources to childhood IQ. Environmental Health Perspectives. 2015;123(8):827–833. doi: 10.1289/ehp.1408554. [DOI] [PMC free article] [PubMed] [Google Scholar]
- Legrand M, et al. Methylmercury blood guidance values for Canada. Canadian Journal of Public Health. 2010;101(1):28–31. doi: 10.1007/BF03405557. [DOI] [PMC free article] [PubMed] [Google Scholar]
- Liu Y, et al. Association of methylmercury intake from seafood consumption and blood mercury level among the Asian and non-Asian populations in the United States. Environmental Research. 2018;160:212–222. doi: 10.1016/j.envres.2017.09.031. [DOI] [PubMed] [Google Scholar]
- Lye E, Legrand M, Clarke J, et al. Blood total mercury concentrations in the Canadian population: Canadian Health Measures Survey Cycle 1 2007–2009. Canadian Journal of Public Health. 2013;104(3):e246–51. doi: 10.17269/cjph.104.3772. [DOI] [PMC free article] [PubMed] [Google Scholar]
- Mahaffey KR, Mergler D. Blood levels of total and organic mercury in residents of the upper St. Lawrence River basin, Quebec: Association with age, gender, and fish consumption. Environmental Research. 1998;77(2):104–114. doi: 10.1006/enrs.1998.3834. [DOI] [PubMed] [Google Scholar]
- Mahaffey KR, Clickner RP, Jeffries RA. Adult women’s blood mercury concentrations vary regionally in the United States: Association with patterns of fish consumption (NHANES 1999-2004) Environmental Health Perspectives. 2009;117(1):47–53. doi: 10.1289/ehp.11674. [DOI] [PMC free article] [PubMed] [Google Scholar]
- McKelvey W, et al. A biomonitoring study of lead, cadmium, and mercury in the blood of New York City adults. Environmental Health Perspectives. 2007;115(10):1435–1441. doi: 10.1289/ehp.10056. [DOI] [PMC free article] [PubMed] [Google Scholar]
- Mercury Biomonitoring Summary. (2016) Available from: https://www.cdc.gov/biomonitoring/mercury_biomonitoringsummary.html. Accessed 4 Jan 2018.
- National Report on Human Exposure to Environmental Chemicals. (2017). Atlanta: Centers for Disease Control and Prevention. https://www.cdc.gov/exposurereport/pdf/FourthReport_UpdatedTables_Volume1_Jan2017.pdf.
- National Research Council (US) Committee on the Toxicological Effects of Methylmercury . Toxicological effects of methylmercury. Washington, DC: The National Academies Press; 2000. p. 368. [PubMed] [Google Scholar]
- Pirkle CM, Muckle G, Lemire M. Managing mercury exposure in northern Canadian communities. CMAJ: Canadian Medical Association Journal. 2016;188(14):1015–1023. doi: 10.1503/cmaj.151138. [DOI] [PMC free article] [PubMed] [Google Scholar]
- R Core Team (2013). R: A language and environment for statistical computing. R Foundation for Statistical Computing, Vienna, Austria. http://www.R-project.org/.
- Reporting Information Affecting Public Health Regulation. (2018). B.C. Reg. 167/2018. http://www.bclaws.ca/civix/document/id/lc/statreg/167_2018.
- Risher J. Elemental mercury and inorganic mercury compounds: Human health aspects. Geneva: World Health Organization; 2003. [Google Scholar]
- Sanzo JM, et al. Estimation and validation of mercury intake associated with fish consumption in an EPIC cohort of Spain. Public Health Nutrition. 2001;4(5):981–988. doi: 10.1079/PHN2001170. [DOI] [PubMed] [Google Scholar]
- Solan TD, Lindow SW. Mercury exposure in pregnancy: A review. Journal of Perinatal Medicine. 2014;42(6):725–729. doi: 10.1515/jpm-2013-0349. [DOI] [PubMed] [Google Scholar]