Abstract
Intracranial pressure (ICP) monitoring is important in managing neurosurgical, neurological, and ophthalmological patients with open-angle glaucoma. Non-invasive two-depth transcranial Doppler (TCD) technique is used in a novel method for ICP snapshot measurement that has been previously investigated prospectively, and the results showed clinically acceptable accuracy and precision. The aim of this study was to investigate possibility of using the ophthalmic artery (OA) as a pressure sensor for continuous ICP monitoring. First, numerical modeling was done to investigate the possibility, and then a pilot clinical study was conducted to compare two-depth TCD-based non-invasive ICP monitoring data with readings from an invasive Codman ICP microsensor from patients with severe traumatic brain injury. The numerical modeling showed that the systematic error of non-invasive ICP monitoring was < 1.0 mmHg after eliminating the intraorbital and blood pressure gradient. In a clinical study, a total of 1928 paired data points were collected, and the extreme data points of measured differences between invasive and non-invasive ICP were − 3.94 and 4.68 mmHg (95% CI − 2.55 to 2.72). The total mean and SD were 0.086 ± 1.34 mmHg, and the correlation coefficient was 0.94. The results show that the OA can be used as a linear natural pressure sensor and that it could potentially be possible to monitor the ICP for up to 1 h without recalibration.
Subject terms: Neurology, Medical research
Introduction
Continuous intracranial pressure (ICP) monitoring is limited due to the invasive nature of some techniques. Nevertheless, the high risk/benefit ratio allows for the usage of invasive ICP monitors in certain groups of patients who could have sudden pathophysiological ICP variation. Such spontaneous ICP changes are common in traumatic brain injury (TBI) patients1. Therefore, invasive ICP monitoring is mostly performed in patients with severe TBI (Glasgow Coma Scale score of 3–8)2. The gold-standard ICP-monitoring method is considered to be an intraventricular drain connected to an external pressure transducer. Another major technique for continuous ICP monitoring involves intraparenchymal devices, which are not as accurate as intraventricular drains and cannot be recalibrated once inserted3,4.
ICP monitoring is in demand in many clinical applications, including conscious patients (ophthalmology, neurology, aerospace medicine, etc.). In the case of ophthalmology, glaucoma is the second leading cause of irreversible vision loss worldwide. It affected 76 million people in 2020 and is predicted to reach 111.8 million cases by 20405. Prospective and retrospective studies using lumbar puncture technique have revealed that glaucoma patients have lower ICP than age-matched healthy subjects6–9, which suggests that ICP might be one of the influential factors in the pathophysiology of glaucoma10. However, ICP monitoring is not employed in daily practice for glaucoma patients due to its invasiveness. In the case of aerospace medicine, visual impairment of astronauts who are exposed to long-term microgravity is induced by changes in ICP11, which must be monitored non-invasively in this case. Unfortunately, such a non-invasive device is not available in clinical practice.
Ragauskas et al. reported a novel non-invasive snapshot method for the measurement of ICP based on the two-depth transcranial Doppler (TCD) technique, which can be used for simultaneously measuring blood flow velocities in the intracranial and extracranial segments of the ophthalmic artery (OA)12. In this method, the intracranial segment of the ophthalmic artery (IOA) is compressed by ICP while the extracranial segment of the ophthalmic artery (EOA) is compressed by externally applied pressure (Pe). Blood flow velocity parameters in both of these OA segments are approximately equal when Pe = ICP. A review paper has discussed many TCD-based methodological approaches for non-invasive ICP monitoring, and the overall accuracy is around ± 12 mmHg13. The innovative two-depth TCD-based non-invasive ICP snapshot measurement technique has clinically acceptable accuracy, precision, and diagnostic reliability14–16.
The aim of this study was to investigate the possibility of using the OA as a pressure sensor for continuous ICP monitoring. The idea is that periodic non-invasive ICP snapshot measurements12 could be used for non-invasive recalibration of a non-invasive ICP monitoring method. A key problem in glaucoma diagnosis and treatment is minimizing the deformation of the lamina cribrosa caused by the pressure difference between the intraocular pressure (IOP) and ICP (IOP-ICP)17. Our previous studies showed that our non-invasive ICP snapshot measurement method is accurate and precise enough to be applied for abnormally low ICP value diagnosis in normal-tension glaucoma (NTH) and high-tension glaucoma (HTG) patients10,18.
ICP and IOP have circadian fluctuations over time, so snapshot measurements of these pressures at a certain time do not provide sufficient diagnostic information19,20. The monitoring of ICP and IOP is needed for precise and individual patient specific NTG and HTG diagnosis in cases where ICP values are below the normal range. In this study, numerical modeling was employed to investigate the possibility of using OA as an ICP sensor for monitoring. Then, a pilot clinical study was conducted to obtain the first clinical evidence on the linearity and accuracy of the OA as an ICP sensor.
Methods
Numerical modeling of ophthalmic artery as a pressure sensor
To understand and prove the concept of the non-invasive ICP monitoring method, it is important to estimate how the dynamics of the blood flow in the OA is affected during the monitoring procedure. Therefore, numerical modeling was performed on a straight idealized OA (Fig. 1).
Figure 1.
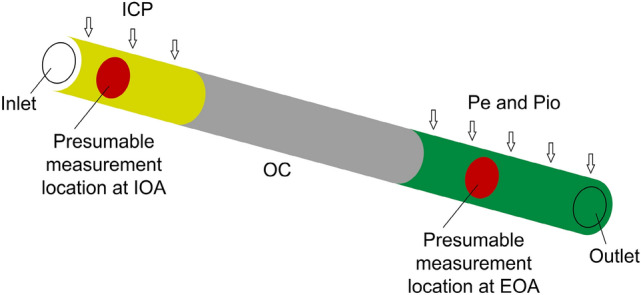
Diagram of the numerical model of an idealized straight ophthalmic artery. ICP intracranial pressure, Pe externally applied pressure, Pio the intraorbital pressure, IOA intracranial segment of the ophthalmic artery, EOA extracranial segment of the ophthalmic artery, OC optic canal.
COMSOL Multiphysics software (v.5.1 COMSOL AB, Stockholm, Sweden) was used to solve the fluid–structure interaction (FSI) model of a compliant OA while considering the two-way coupling between the pulsatile blood flow and the artery wall (please see Online Appendix 1 for more details).
The following values of acting pressures were considered and used only for numerical modeling of non-invasive ICP snapshot measurements: ICP = {0, 10, 20, 30} mmHg21, intraorbital pressure Pio = 4 mmHg22, and Pe = [0:2:34] mmHg12,23,24.
For every combination of the considered parameters, three cardiac cycles were modeled. During the initial cardiac cycle, all the acting pressures were ramped up from zero to the prescribed values, while during the second cardiac cycle the momentum produced by the initial ramp-up settled down. The difference of the temporal results of the cross-sectional areas at presumable measurement locations of OA between the second and third heart pulse cycle differed by less than 0.01% over the complete cardiac cycle. Therefore, it was concluded that the momentum produced by the initial ramp had negligible influence on the results of the third heart pulse cycle, and the results of the third cardiac cycle were used for the analysis by collecting data at every 0.004 s. This resulted in a 250 time moments per cardiac cycle.
Blood flow factor used for the non-invasive ICP monitoring
The cross-sectional areas in the intracranial and the extracranial segments of the OA depend on the pressures acting on the walls of the OA. Furthermore, the cross-section area of the artery is associated with the intensity of the Doppler signal (Online Appendix 2). Consequently, variations of the OA’s cross-sectional area in the intracranial and extracranial segments can be related to ICP by the integral factors derived from the intensity of the Doppler signal. We constructed the blood flow factor for non-invasive ICP monitoring as an integral of the logarithm of the ratio of the Doppler signal intensity Ps obtained from the IOA and the EOA segments of the OA (Online Appendix 2).
Clinical material
The non-invasive ICP (ICPnon-inv) monitoring method was investigated clinically after numerical modeling. This pilot study was conducted at the Department of Neurosurgery, Republic Vilnius University Hospital. The study was based on 7 TBI patients that underwent surgery, during which ICP monitoring sensors were implanted. The exclusion criteria were age less than 18 years and a lack of invasive ICP or arterial blood pressure (ABP) data.
The study was approved by the Vilnius Regional Biomedical Research Ethics Committee (No. 158200-15-801-323, date: 2015-10-06), and parents/legal representative of participants provided written informed consent, according to the Declaration of Helsinki. ICP monitoring data were collected between May 2016 and January 2018.
ICP monitoring and data sampling
The simultaneous invasive and non-invasive ICP monitoring is illustrated in Fig. 2. Invasive ICP was measured by a Codman ICP monitor with a catheter tip sensor (Johnson & Johnson Professional, Inc., Raynham, MA, USA). It was sampled at 300 Hz and recorded on a computer by ICM+ software (version 8.2; ICM+ software, University of Cambridge, UK) with a vital sign monitor (Datex-Ohmeda, Inc., Madison, WI, USA).
Figure 2.
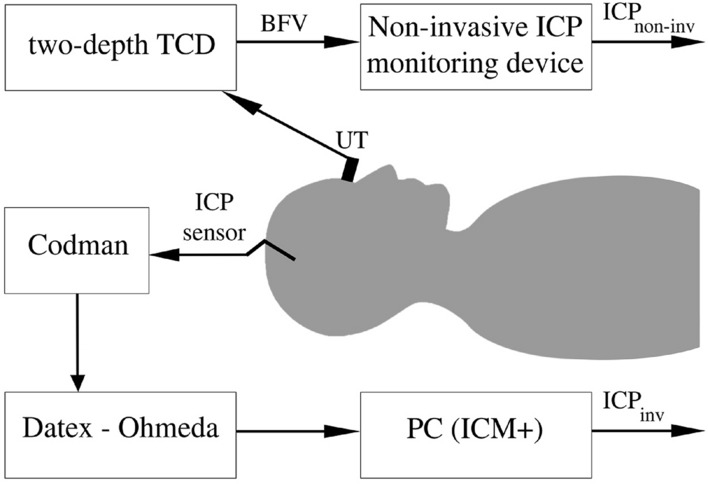
The set-up for simultaneous invasive and non-invasive intracranial pressure monitoring. UT ultrasonic transducer, BFV blood flow velocity, TCD transcranial Doppler, ICPinv invasively monitored intracranial pressure, ICPnon-inv non-invasively monitored intracranial pressure.
In the case of non-invasive ICP monitoring, a 2-MHz ultrasonic transducer was mounted on an individually fitted head frame. The locations of the IOA and EOA segments were determined using the edge of the internal carotid artery as a reference point25. The blood flow velocities of both segments of the OA were recorded using a two-depth TCD. Signal processing was performed to remove artifacts and to calculate BFF data points with a sampling frequency of 0.1 Hz. In this pilot study, individual invasive ICP readings were used for initial patient specific BFF data calibration to obtain non-invasive ICP values in pressure units. Next, we monitored ICP continuously for a 1 h period without recalibration. In contrast to the non-invasive ICP snapshot measurement method, Pe was not needed for the non-invasive ICP monitoring procedure.
Statistics
Typically, one paired set of ICPinv and ICPnon-inv data points was obtained every 10 s, resulting in a total of 360 data points during a 1 h monitoring session.
Paired data were analyzed using a Bland–Altman analysis. Linear regression analysis was used to test the hypothesis that the OA can be used as a linear ICP sensor.
MATLAB software (version R2015b; MathWorks Corporation, Natick, MA, USA) was used to process the data and to perform the Bland–Altman and linear regression analyses.
Results
Numerical modeling
The blood flow velocities were extracted at the presumed ICPnon-inv monitoring locations in the IOA and EOA segments (Table 7 in Appendix 1). The obtained blood flow velocities were averaged across the artery lumen cross-sections in their vicinity and over the cardiac cycle. The difference between the resulting velocities in IOA and EOA segments is noted as , which is close to zero when Pe is about 6 mmHg lower than the ICP (Fig. 3). This suggests that the systematic error of the physical ICPnon-inv monitoring is about 6 mmHg.
Table 7.
Locations of cross-sections were data was extracted.
| Simulation parameters | Value (mm) |
|---|---|
| distance from the OA starting location at which the data was collected at IOA segment | 2.058 |
| distance from the OA starting location at which the data was collected at EOA segment | 20.834 |
OA the ophthalmic artery, IOA intracranial segment of the ophthalmic artery, EOA extracranial segment of the ophthalmic artery.
Figure 3.
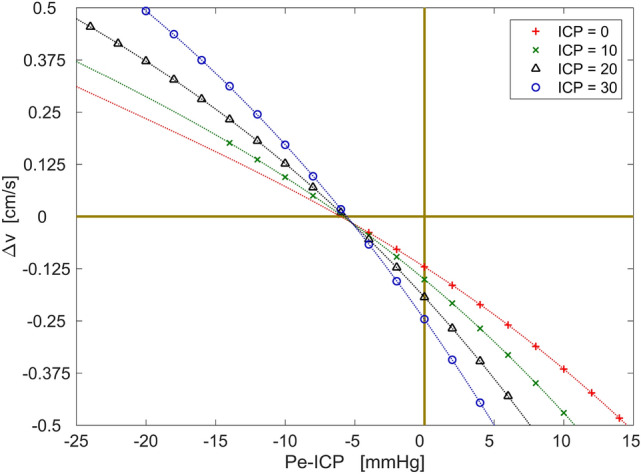
The difference of the blood flow velocities between presumed ICPnon-inv locations in the intracranial and extracranial segments of the ophthalmic artery with respect to the intracranial and extracranial pressures. The polynomial curves are fitted to the data points.
Part of this error is due to the intraorbital pressure, which was Pio = 4 mmHg in our case. Another part is due to the ophthalmic arterial pressure gradient, which was 1.25 mmHg. Such systematic errors are known a priori, so they can be eliminated in a software solution provided with the proposed non-invasive ICP monitoring technology. Consequently, the patient-specific component produced systematic error less than 1.0 mmHg. The patient-specific component incorporated the arterial pulse wave and the patient-specific mechanical non-equivalence between OA segments, which are not known a priori.
Clinical study
Demographic data and clinical conditions of the patients are presented in Table 1. An individual linear calibration equation (Table 2) was used for each patient to calibrate BFF data points to derive non-invasive ICP values in pressure units. Then, the obtained values were compared with simultaneously monitored ICPinv. One out of the 7 patients was excluded due to invasive ICP or ABP not being monitored. TCD signal artifacts were then removed, after which a total of 1928 paired data points were obtained for the final comparison. The corresponding individual numbers of paired data points are presented in Table 2. The total mean and SD of the measured differences between ICPinv and ICPnon-inv are 0.086 ± 1.34 mmHg. The individual means and SD are presented in Table 2.
Table 1.
Demographic data and clinical conditions of the patients included in this pilot study.
| Pat. no | Age, years | Gender | GCS on admission | Diagnosis | Surgery type | GOS |
|---|---|---|---|---|---|---|
| 1 | 44 | Male | 3 | DAI with skull open fractures | Intraparenchymal ICP | 1 |
| 2 | 39 | Male | 8 | DAI, SDH | Intraparenchymal ICP | 5 |
| 3 | 26 | Female | 7 | DAI, SDH | Intraparenchymal ICP | 1 |
| 4 | 29 | Female | 5 | DAI | Intraparenchymal ICP | 4 |
| 5 | 20 | Female | 4 | DAI | Intraparenchymal ICP | 3 |
| 6 | 20 | Male | 7 | DAI | Intraparenchymal ICP | 3 |
GCS Glasgow coma scale, GOS Glasgow outcome scale, DAI diffuse axonal injury, SDH subdural hematoma, ICP intracranial pressure.
Table 2.
The individual parameters obtained from each patient included in this pilot study.
| Pat. no | Range of ICPinv, min–max, mmHg | Calibration equation used to calculate ICPnon-inv | Measured differences, mean ± SD mmHg | Number of paired data points |
|---|---|---|---|---|
| 1 | 12–22 | 56.3 × + 10.1 | 0.43 ± 0.91 | 223 |
| 2 | 16–19 | 263.8 × + 11.8 | − 0.22 ± 1.23 | 360 |
| 3 | 8–11 | 70.4 × + 6.2 | − 0.65 ± 1.07 | 356 |
| 4 | 10–19 | 218.9 × + 4.5 | 1.61 ± 1.61 | 280 |
| 5 | 8–10 | 109.8 × + 3.8 | 0.18 ± 0.64 | 360 |
| 6 | 13–17 | 586.2 × + 6.9 | − 0.39 ± 1.20 | 349 |
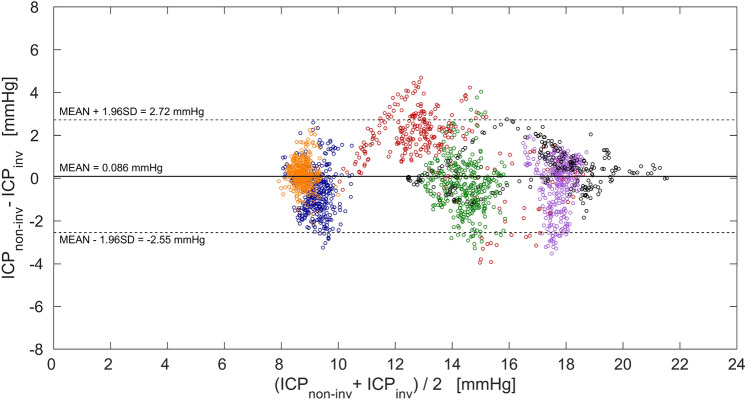
As an example, Fig. 4 shows a plot of 223 paired invasive and non-invasive ICP monitoring data points of the first patient. A 60-s moving average filter was used for smoothing both readings. The maximum difference between the paired data points was 1.61 mmHg. The measured differences between ICPinv and ICPnon-inv of all 6 patients are presented in Fig. 5 as a Bland–Altman plot. The extremes of the measured differences between ICPinv and ICPnon-inv are − 3.94 and 4.68 mmHg, and 95% of the observations fall in the interval of − 2.55 to 2.72 mmHg.
Figure 4.
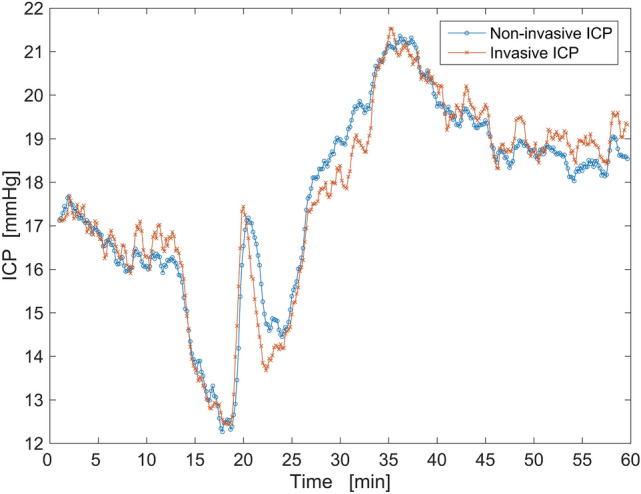
An example of paired invasive and non-invasive ICP data points of the first patient after filtering (60-s moving average filter).
Figure 5.
Bland–Altman plot showing the distribution of the measured differences between intracranial pressure monitored directly using invasive Codman ICP monitor (ICPinv) and indirectly using two-depth transcranial Doppler (ICPnon-inv) in the entire pressure range obtained in all six patients. Paired data points collected from each of the six patients are separated by colors: first patient—black, second patient—violet, third patient—blue, fourth patient—red, fifth patient—orange, sixth patient—green. The thick horizontal line indicates the total mean of the measured differences, while the two dashed horizontal lines indicate the standard deviation (SD) of ± 1.96 of the measured differences.
The regression analysis showed that there is a strong positive relationship (r = 0.94) between the data obtained with two-depth TCD and the Codman ICP monitor (Fig. 6). The linear equation y = 0.94x + 0.84 demonstrates that OA can be used as a linear pressure sensor with a bias (systematic error) of 0.84 mmHg in the tested ICP range.
Figure 6.
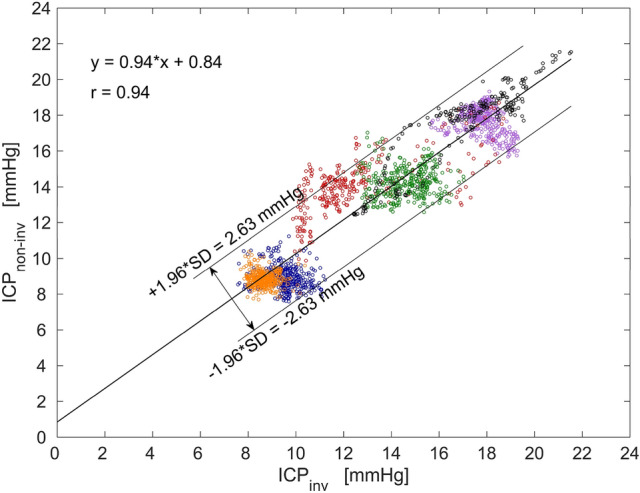
A linear regression graph of all data points shows a strong positive relationship (r = 0.94) between the non-invasively obtained intracranial pressure values (ICPnon-inv) and the invasive ICP values (ICPinv). Paired data points collected from each of the six patients are separated by colors: first patient—black, second patient—violet, third patient—blue, fourth patient—red, fifth patient – orange, sixth patient—green.
Discussion
ICP monitoring has been used for decades in the management of TBI patients26. However, the demand for ICP monitoring is also increasing in the fields of ophthalmology6,8,9,18 and aerospace medicine11,27. In this study, we investigated the possibility of using the OA as a pressure sensor for non-invasive ICP monitoring based on two-depth TCD.
The modeling was performed to investigate the blood flow dynamics in the OA and the possible systematic error due to several mechanisms: the ophthalmic arterial pressure gradient, intraorbital pressure, arterial pulse wave, and patient-specific mechanical non-equivalence between IOA and EOA segments. The results of the modeling showed that errors of 4 mmHg and 1.25 mmHg were produced by the intraorbital pressure and the average ophthalmic arterial blood pressure gradient, respectively. The average ophthalmic arterial blood pressure gradient corresponds well with the theoretical value of 1.225 mmHg based on the Hagen–Poiseuille flow assumptions. The patient-specific component, resulting from the arterial pulse wave and the mechanical non-equivalence produced an error less than 1.0 mmHg. This error is unknown a priori, so it sets possible limiting boundaries for the random error. Based on the clinical standards the random error should be close to ± 2 mmHg28.
Previous studies showed that the systematic error of the modeled ICPnon-inv monitoring based on the blood velocity was within the limits of [1.6, 1.8] mmHg for the idealized straight OA and [0.04, 4.6] mmHg for the subject-specific curved OA29,30, which are similar to the value of ± 1.0 mmHg obtained in this study. The current state of the neuroimaging techniques allows for the implementation of subject-specific models considering the OA branching from the internal carotid artery. This allows for the quantitative estimation of the ICPnon-inv monitoring process and more detailed reasoning about the systematic error in specific patients.
In the pilot study, the non-invasive ICP monitoring method showed a strong positive correlation (r = 0.94) with invasively monitored ICP data. In order to test our hypothesis about the linearity of the OA results, invasive ICP values were used for initial calibration, which means the non-invasive two-depth TCD data is converted into non-invasive ICP values in pressure units. The regression analysis showed that the OA can act as a linear ICP sensor in the tested ICP range.
Several important limitations of our study must be mentioned. The main limitation of this pilot study is the small number of patients with relatively narrow ICP variation (8–22 mmHg). A substantially larger sample of patients with different conditions would guarantee the achievement of statistical significance in a prospective study. At the same time, the OA would be tested as a pressure sensor in a wide range of ICP values. Next, the reproducibility of the proposed method was not investigated in this study, although it has been tested by removing and re-applying the head frame in an ICP snapshot measurement study14. Both non-invasive ICP monitoring and snapshot measurement methods employ the same principles, which involve locating OA segments and using two-depth TCD data acquisition.
The accuracy of the ventricular ICP monitor depends on periodical recalibration by opening the transducer to atmospheric pressure and returning it to a zero reference point31. The patient positioning in relation to the transducer affects the accuracy of ICP readings32. The complications in the case of ventricular catheters included a 1–10% risk of infection and a 1–2% risk of bleeding33. Parenchymal monitoring devices also require calibration and zeroing, and the pneumatic ICP monitor even runs recalibration every 15 min during monitoring. The risk of complication in the case of parenchymal monitoring is lower compared to ventricular catheters, but it still exists nonetheless33.
The suggested method can monitor ICP non-invasively for up to one hour without recalibration. We used invasive ICP sensor data for initial calibration in this study, but a non-invasive ICP snapshot measurement method that has clinically acceptable accuracy and precision14,16 could be used for the initial calibration and periodic recalibration. In this case, the suggested method would be completely non-invasive and avoid any complications caused by invasive procedures.
Conclusion
The numerical modeling and pilot clinical study have demonstrated that the OA can be used as a pressure sensor for non-invasive ICP monitoring. We have observed that it is possible to monitor ICP non-invasively for a one hour without recalibration. This technology could solve the problems of ICP monitoring and diagnosis in conscious subjects, including open-angle glaucoma patients. Nevertheless, further studies are needed to investigate the method in patients with relatively low and high ICP values.
Acknowledgements
We thank all the patients and medical colleagues who were involved in the study.
Appendix 1: Numerical modeling of ophthalmic artery as a pressure sensor
The non-invasive intracranial pressure (ICPnon-inv) monitoring was investigated numerically while considering an idealized, straight, compliant OA composed of the intracranial (IOA), optic canal (OC), and extracranial (EOA) segments. The lengths of the IOA, OC, and EOA segments used were those most commonly found in humans (Table 3).
Table 3.
Geometrical parameters of the ophthalmic artery.
| OA wall parameters | Value (mm) |
|---|---|
| initial lumen diameter | 1.3 |
| length of the OA 39 | 25.783 |
| length of (IOA) 39 | 4.116 |
| length of (OC) 40 | 12 |
| length of (EOA) 39 | 9.667 |
| wall thickness 41 | 0.177 |
OA the ophthalmic artery, IOA intracranial segment of the ophthalmic artery, EOA extracranial segment of the ophthalmic artery, OC optic canal.
The OA lumen volume and wall thickness were assumed to be unaffected by aging or any other processes (Table 3).
The material properties of the blood and OA wall corresponded to those of an average healthy human (Table 4).
Table 4.
Basic parameters of blood and wall of the ophthalmic artery.
The blood was modeled as an incompressible, homogenous, Newtonian fluid34. From basic theoretical considerations, the Reynolds number in the OA was calculated as less than 150, while the Womersley number was less than 1, which correspond to the prescribed laminar, fully developed velocity profile at the inlet. The magnitude of the blood flow velocity changed over time according to the typical OA velocity waveform (Fig. 7). To the best of our knowledge, only the peak ophthalmic arterial blood pressure values are available35. Therefore, the ophthalmic arterial blood pressure waveform was prescribed at the outlet as a rescaled version of the velocity waveform with the peak pressure values corresponding to those of a healthy human (Table 5).
Figure 7.
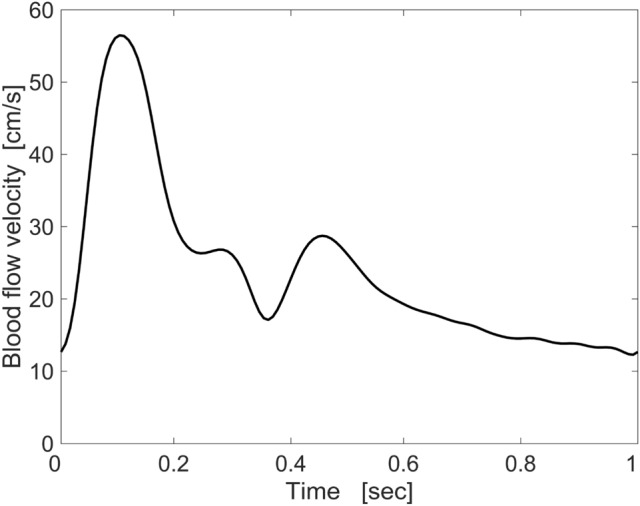
Typical maximum blood flow velocity waveform in ophthalmic artery that was implemented in the numerical model.
Table 5.
Basic simulation parameters.
To capture the exponential stiffening and the anisotropy, the OA walls were modelled as a fiber-reinforced, hyperelastic, nearly incompressible material with two mechanically equivalent fiber families36. To the best of our knowledge, the values of the additional artery wall parameters, required by the constitutive material model for the OA wall are unavailable, so internal carotid artery parameters were used instead (Table 6). The mean fiber directions of the two fiber families were defined according to a previously proposed method29.
Table 6.
Ophthalmic artery wall parameters used for fiber-reinforced double layer model based on internal carotid artery wall parameters according to 46.
| Arterial wall parameters | Value |
|---|---|
| Isotropic, kPa | 29.7 |
| Anisotropic, kPa | 27.8 |
| Anisotropic, | 64.2 |
| Fiber angle, deg | 22.0 |
| Dispersion, | 0.8 |
The IOA segment was compressed by the ICP. No additional pressure acted on the OC segment, and the EOA segment was compressed by the intraorbital pressure (Pio) and the added external pressure (Pe). It was assumed that ICP, Pio, and Pe were uniformly distributed on the outer surface of the artery wall. To limit the rigid artery wall motion, a spring foundation with a relatively small a spring constant was prescribed on the interface boundary such that would not alter the stress field.
The geometry was discretized into 71,644 finite elements with 49,734 linear elements for the blood domain and the remaining 21,910 quadratic elements for the artery wall domain.
The fluid–structure interaction (FSI) model considering the two-way coupling between blood and artery wall was solved with COMSOL Multiphysics software (v.5.1. COMSOL AB, Stockholm, Sweden). The Navier–Stokes equations in the Arbitrary Lagrangian Eulerian (ALE) formulation were used to describe the dynamics of the blood flow, while the equation of motion in the material configuration was used to describe the dynamics of the artery walls. The computational mesh of the blood domain was moved according to the Winslow smoothing method37,38. A linear MUltifrontal Massively Parallel Sparse direct Solver (MUMPS) was used in conjunction with a nonlinear Newton method. For time stepping, the variable-order-accuracy (from first to second) Backward Differentiation Formula (BDF) solver was used with an adaptive time stepping routine. A relative global tolerance of and a scaled global absolute tolerance of 5 × 10⁻⁴ were used for all solved variables (Table 7).
Appendix 2: Definition of blood flow factor used for non-invasive ICP monitoring
The variations of the blood flow velocity parameters and OA cross-sectional area in the IOA and EOA can be compared by the integral factors derived from the intensity of the reflected ultrasound Doppler signal. The blood flow factor () is defined as an integral of the difference of logarithms of Doppler signal intensity Ps obtained from the IOA and EOA:
| 1 |
where Psu(t, u)—is the ultrasound signal intensity distribution over the velocity u measured by the Doppler signal. In order to compare with the ICP monitored non-invasively, the factors were processed. The factor and invasively monitored ICPinv were smoothed by a moving average with s, and the smoothed factor was rescaled according to values by:
| 2 |
The scale coefficients a and b must satisfy the condition of equality of standard deviations and the means of rescaled factor f and :
| 3 |
Author contributions
Conceptualization: A.D. and L.B. Data curation: L.B., R.Z., E.M., A.D. and Y.H. Formal analysis: P.L., E.M., A.D. and Y.H. Funding acquisition: R.Z. Methodology: R.Z. and A.D. Software: M.D., L.B. and E.M. Visualization: L.B., E.M. and Y.H. Writing—original draft: P.L., L.B., E.M. and Y.H. Writing—review & editing: L.B., E.M., A.D. and Y.H.
Funding
This research was supported by the Research Council of Lithuania (Grant Number MIP-087/2015) and European Regional Development Fund (project No 01.2.2-LMT-K-718-03-0094) under grant agreement with the Research Council of Lithuania (LMTLT).
Competing interests
The authors declare no competing interests.
Footnotes
Publisher's note
Springer Nature remains neutral with regard to jurisdictional claims in published maps and institutional affiliations.
References
- 1.Abdelsadg M, et al. Intra cranial pressure (ICP) monitoring in traumatic brain injury; what is the evidence? Open Access J. Neurol. Neurosurg. 2017;5:555672. [Google Scholar]
- 2.Carney N, et al. Guidelines for the management of severe traumatic brain injury, fourth edition. Neurosurgery. 2017;80:6–15. doi: 10.1227/NEU.0000000000001432. [DOI] [PubMed] [Google Scholar]
- 3.Zacchetti L, Magnoni S, Di Corte F, Zanier ER, Stocchetti N. Accuracy of intracranial pressure monitoring: Systematic review and meta-analysis. Crit. Care. 2015;19:420. doi: 10.1186/s13054-015-1137-9. [DOI] [PMC free article] [PubMed] [Google Scholar]
- 4.Akbik OS, Carlson AP, Yonas H. The roles of ventricular and parenchymal intracranial pressure monitoring. Curr. Neurobiol. 2016;07:1–6. [Google Scholar]
- 5.Tham Y-C, et al. Global prevalence of glaucoma and projections of glaucoma burden through 2040: A systematic review and meta-analysis. Ophthalmology. 2014;121:2081–2090. doi: 10.1016/j.ophtha.2014.05.013. [DOI] [PubMed] [Google Scholar]
- 6.Berdahl JP, Allingham RR, Johnson DH. Cerebrospinal fluid pressure is decreased in primary open-angle glaucoma. Ophthalmology. 2008;115:763–768. doi: 10.1016/j.ophtha.2008.01.013. [DOI] [PubMed] [Google Scholar]
- 7.Berdahl JP, Fautsch MP, Stinnett SS, Allingham RR. Intracranial pressure in primary open angle glaucoma, normal tension glaucoma, and ocular hypertension: A case-control study. Investig. Ophthalmol. Vis. Sci. 2008;49:5412–5418. doi: 10.1167/iovs.08-2228. [DOI] [PMC free article] [PubMed] [Google Scholar]
- 8.Jonas JB, Ritch R, Panda-Jonas S. Cerebrospinal fluid pressure in the pathogenesis of glaucoma. Prog. Brain Res. 2015;221:33–47. doi: 10.1016/bs.pbr.2015.06.002. [DOI] [PubMed] [Google Scholar]
- 9.Ren R, et al. Cerebrospinal fluid pressure in glaucoma A prospective study. Ophthalmology. 2010;117:259–266. doi: 10.1016/j.ophtha.2009.06.058. [DOI] [PubMed] [Google Scholar]
- 10.Deimantavicius M, et al. Prospective clinical study of non-invasive intracranial pressure measurements in open-angle glaucoma patients and healthy subjects. Medicina (Kaunas) 2020;56:664. doi: 10.3390/medicina56120664. [DOI] [PMC free article] [PubMed] [Google Scholar]
- 11.Michael AP, Marshall-Bowman K. Spaceflight-induced intracranial hypertension. Aerosp. Med. Hum. Perform. 2015;86:557–562. doi: 10.3357/AMHP.4284.2015. [DOI] [PubMed] [Google Scholar]
- 12.Ragauskas A, Daubaris G, Dziugys A, Azelis V, Gedrimas V. Innovative non-invasive method for absolute intracranial pressure measurement without calibration. Acta Neurochir. Suppl. 2005;95:357–361. doi: 10.1007/3-211-32318-X_73. [DOI] [PubMed] [Google Scholar]
- 13.Cardim D, et al. Non-invasive monitoring of intracranial pressure using transcranial doppler ultrasonography: Is it possible? Neurocrit. Care. 2016;25:473–491. doi: 10.1007/s12028-016-0258-6. [DOI] [PMC free article] [PubMed] [Google Scholar]
- 14.Kienzler JC, et al. Validation of noninvasive absolute intracranial pressure measurements in traumatic brain injury and intracranial hemorrhage. Oper. Neurosurg. (Hagerstown) 2019;16:186–196. doi: 10.1093/ons/opy088. [DOI] [PubMed] [Google Scholar]
- 15.Ragauskas A, et al. Improved diagnostic value of a TCD-based non-invasive ICP measurement method compared with the sonographic ONSD method for detecting elevated intracranial pressure. Neurol. Res. 2014;36:607–614. doi: 10.1179/1743132813Y.0000000308. [DOI] [PubMed] [Google Scholar]
- 16.Ragauskas A, et al. Clinical assessment of noninvasive intracranial pressure absolute value measurement method. Neurology. 2012;78:1684–1691. doi: 10.1212/WNL.0b013e3182574f50. [DOI] [PubMed] [Google Scholar]
- 17.Marek B, et al. Cerebrospinal fluid pressure and glaucoma: Regulation of trans-lamina cribrosa pressure. Br. J. Ophthalmol. 2013;98:721. doi: 10.1136/bjophthalmol-2013-303884. [DOI] [PubMed] [Google Scholar]
- 18.Siaudvytyte L, et al. The difference in translaminar pressure gradient and neuroretinal rim area in glaucoma and healthy subjects. J. Ophthalmol. 2014;2014:937360. doi: 10.1155/2014/937360. [DOI] [PMC free article] [PubMed] [Google Scholar]
- 19.Killer HE, Pircher A. Normal tension glaucoma: Review of current understanding and mechanisms of the pathogenesis /692/699/3161/3169/3170 /692/699/3161 review-article. Eye (Basingstoke). 2018 doi: 10.1038/s41433-018-0042-2. [DOI] [PMC free article] [PubMed] [Google Scholar]
- 20.Pircher A, Remonda L, Weinreb RN, Killer HE. Translaminar pressure in Caucasian normal tension glaucoma patients. Acta Ophthalmol. 2017;95:e524–e531. doi: 10.1111/aos.13302. [DOI] [PubMed] [Google Scholar]
- 21.Kukreti V, Mohseni-Bod H, Drake J. Management of raised intracranial pressure in children with traumatic brain injury. J. Pediatr. Neurosci. 2014;9:207–215. doi: 10.4103/1817-1745.147572. [DOI] [PMC free article] [PubMed] [Google Scholar]
- 22.Riemann CD, Foster JA, Kosmorsky GS. Direct orbital manometry in patients with thyroid-associated orbitopathy. Ophthalmology. 1999;106:1296–1302. doi: 10.1016/S0161-6420(99)00712-5. [DOI] [PubMed] [Google Scholar]
- 23.Siaudvytyte L, et al. Update in intracranial pressure evaluation methods and translaminar pressure gradient role in glaucoma. Acta Ophthalmol. 2015;93:9–15. doi: 10.1111/aos.12502. [DOI] [PubMed] [Google Scholar]
- 24.Krakauskaite S, et al. Accuracy, precision, sensitivity, and specificity of noninvasive ICP absolute value measurements. Acta Neurochir. Suppl. 2016;122:317–321. doi: 10.1007/978-3-319-22533-3_63. [DOI] [PubMed] [Google Scholar]
- 25.Hamarat Y, et al. Location of the internal carotid artery and ophthalmic artery segments for non-invasive intracranial pressure measurement by multi-depth TCD. Libyan J. Med. 2017;12:1384290. doi: 10.1080/19932820.2017.1384290. [DOI] [PMC free article] [PubMed] [Google Scholar]
- 26.Raboel PH, Bartek JJ, Andresen M, Bellander BM, Romner B. Intracranial pressure monitoring: Invasive versus non-invasive methods—A review. Crit. Care Res. Pract. 2012;2012:950393. doi: 10.1155/2012/950393. [DOI] [PMC free article] [PubMed] [Google Scholar]
- 27.Zhang L-F, Hargens AR. Spaceflight-induced intracranial hypertension and visual impairment: Pathophysiology and countermeasures. Physiol. Rev. 2017;98:59–87. doi: 10.1152/physrev.00017.2016. [DOI] [PubMed] [Google Scholar]
- 28.Andrews PJD, et al. NICEM consensus on neurological monitoring in acute neurological disease. Intens. Care Med. 2008;34:1362–1370. doi: 10.1007/s00134-008-1103-y. [DOI] [PubMed] [Google Scholar]
- 29.Misiulis E, Džiugys A, Navakas R, Petkus V. A comparative study of methods used to generate the arterial fiber structure in a clinically relevant numerical analysis. Int. J. Numer. Method Biomed. Eng. 2019;35:e3194. doi: 10.1002/cnm.3194. [DOI] [PubMed] [Google Scholar]
- 30.Misiulis E, Skarbalius G, Dziugys A. Numerical evaluation of systematic errors of a non-invasive intracranial pressure measurement. Energetika. 2018 doi: 10.6001/energetika.v64i3.3805. [DOI] [Google Scholar]
- 31.Schimpf MM. Diagnosing increased intracranial pressure. J. Trauma Nurs. 2012;19:160–167. doi: 10.1097/JTN.0b013e318261cfb4. [DOI] [PubMed] [Google Scholar]
- 32.Zhong J, et al. Advances in ICP monitoring techniques. Neurol. Res. 2003;25:339–350. doi: 10.1179/016164103101201661. [DOI] [PubMed] [Google Scholar]
- 33.Littlejohns LR, Bader MK. AACN-AACN Protocols for Practice: Monitoring Technologies in Critically Ill Neuroscience Patients. Burlington: Jones and Bartlett Publishers; 2009. [Google Scholar]
- 34.de Villiers AM, McBride AT, Reddy BD, Franz T, Spottiswoode BS. A validated patient-specific FSI model for vascular access in haemodialysis. Biomech. Model. Mechanobiol. 2018;17:479–497. doi: 10.1007/s10237-017-0973-8. [DOI] [PubMed] [Google Scholar]
- 35.Langham ME. Ischemia and Loss of Vascular Autoregulation in Ocular and Cerebral Diseases. Ischemia and Loss of Vascular Autoregulation in Ocular and Cerebral Diseases: A New Perspective. New York: Sipringer; 2009. [Google Scholar]
- 36.Holzapfel GA, Gasser TC, Ogden RW. A new constitutive framework for arterial wall mechanics and a comparative study of material models. J. Elast. Phys. Sci. Solids. 2000;61:1–48. doi: 10.1016/S0022-3697(99)00252-8. [DOI] [Google Scholar]
- 37.Winslow AM. Numerical solution of the quasilinear poisson equation in a nonuniform triangle mesh. J. Comput. Phys. 1966;1:149–172. doi: 10.1016/0021-9991(66)90001-5. [DOI] [Google Scholar]
- 38.Knupp PM. Winslow smoothing on two-dimensional unstructured meshes. Eng. Comput. 1999;15:263–268. doi: 10.1007/s003660050021. [DOI] [Google Scholar]
- 39.Hayreh SS. Orbital vascular anatomy. Eye (Lond.) 2006;20:1130–1144. doi: 10.1038/sj.eye.6702377. [DOI] [PubMed] [Google Scholar]
- 40.Hart CK, Theodosopoulos PV, Zimmer LA. Anatomy of the optic canal: A computed tomography study of endoscopic nerve decompression. Ann. Otol. Rhinol. Laryngol. 2009;118:839–844. doi: 10.1177/000348940911801203. [DOI] [PubMed] [Google Scholar]
- 41.Polak JF, et al. Associations of carotid artery intima-media thickness (IMT) with risk factors and prevalent cardiovascular disease. J. Ultrasound Med. 2010;29:1759–1768. doi: 10.7863/jum.2010.29.12.1759. [DOI] [PMC free article] [PubMed] [Google Scholar]
- 42.Milnor WR. Cardiovascular Physiology. Oxford: Oxford University Press; 1990. [Google Scholar]
- 43.Cutnell JD, Johnson KW. Physics. Hoboken: Wiley; 1997. [Google Scholar]
- 44.Kuhl E, Maas R, Himpel G, Menzel A. Computational modeling of arterial wall growth. Biomech. Model. Mechanobiol. 2007;6:321–331. doi: 10.1007/s10237-006-0062-x. [DOI] [PubMed] [Google Scholar]
- 45.Holdsworth DW, Norley CJD, Frayne R, Steinman DA, Rutt BK. Characterization of common carotid artery blood-flow waveforms in normal human subjects. Physiol. Meas. 1999;20:219–240. doi: 10.1088/0967-3334/20/3/301. [DOI] [PubMed] [Google Scholar]
- 46.Sommer G, Holzapfel GA. 3D constitutive modeling of the biaxial mechanical response of intact and layer-dissected human carotid arteries. J. Mech. Behav. Biomed. Mater. 2012;5:116–128. doi: 10.1016/j.jmbbm.2011.08.013. [DOI] [PubMed] [Google Scholar]


