Abstract
COVID-19 is a fast-growing disease all over the world, but facilities in the hospitals are restricted. Due to unavailability of an appropriate vaccine or medicine, early identification of patients suspected to have COVID-19 plays an important role in limiting the extent of disease. Lung computed tomography (CT) imaging is an alternative to the RT-PCR test for diagnosing COVID-19. Manual segmentation of lung CT images is time consuming and has several challenges, such as the high disparities in texture, size, and location of infections. Patchy ground-glass and consolidations, along with pathological changes, limit the accuracy of the existing deep learning-based CT slices segmentation methods. To cope with these issues, in this paper we propose a fully automated and efficient deep learning-based method, called LungINFseg, to segment the COVID-19 infections in lung CT images. Specifically, we propose the receptive-field-aware (RFA) module that can enlarge the receptive field of the segmentation models and increase the learning ability of the model without information loss. RFA includes convolution layers to extract COVID-19 features, dilated convolution consolidated with learnable parallel-group convolution to enlarge the receptive field, frequency domain features obtained by discrete wavelet transform, which also enlarges the receptive field, and an attention mechanism to promote COVID-19-related features. Large receptive fields could help deep learning models to learn contextual information and COVID-19 infection-related features that yield accurate segmentation results. In our experiments, we used a total of 1800+ annotated CT slices to build and test LungINFseg. We also compared LungINFseg with 13 state-of-the-art deep learning-based segmentation methods to demonstrate its effectiveness. LungINFseg achieved a dice score of and an intersection-over-union (IoU) score of —higher than the ones of the other 13 segmentation methods. Specifically, the dice and IoU scores of LungINFseg were better than those of the popular biomedical segmentation method U-Net.
Keywords: COVID-19, CT slices, deep learning, image segmentation
1. Introduction
Coronavirus disease 2019 (COVID-19) is an infectious disease caused by severe acute respiratory syndrome coronavirus 2 (SARS-CoV-2), which is still threatening humans worldwide. The World Health Organization (WHO) declared that COVID-19 (the novel coronavirus disease) is a global pandemic on the 11 March 2020 [1]. Due to unavailability of an appropriate vaccine or medicine, the early diagnosis of COVID-19 disease is very crucial to saving many people’s lives and protecting frontline workers. One of the gold standard COVID-19 detection methods is RT-PCR (reverse transcription-polymerase chain reaction); note that the RT-PCR test is time-consuming and has low sensitivity [2]. Besides, RT-PCR testing capacity is not enough in all countries and the required material is limited in hospitals considering the number of possible infections. It should be noted that chest CT imaging, which is a non-invasive, routine diagnostic tool for pneumonia, has been used to supplement RT-PCR testing to detect COVID-19 [3]. The study of [4] concluded that chest CT images reveal some noted imaging features of COVID-19, including ground-glass opacification (GGO) and consolidative opacities overlaid on GGO, which can be found mainly in the lower lobes. These features can help detect COVID-19 early before noticing the clinical symptoms. Additional features of COVID-19, such as pleural/septal thickening, subpleural involvement, and bronchiectasis, can be noticed in the later stages of the disease. It is worth noting that some related works, such as [5,6], suggest the use of chest radiographs (CXR) due to their widespread availability and portability, non-invasiveness, and faster acquisition and visual analysis. However, CTs have higher accuracy than CXR and allow diminishing the false negative errors from repeated swab analysis [7].
Considering the massive number of daily infections, radiologists encounter difficulties in visually inspecting all CT images to identify the salient imaging features of COVID-19. Hence, there is a requirement to develop accurate automated tools to segment COVID-19 infection in the chest CT images at the lung level. Figure 1 shows four examples of COVID-19 existing in the chest CT images. Radiologists can notice regions of patchy ground-glass and consolidations in COVID-19 CT images. These artefacts, and pathological changes, can limit the accuracy of automated lobe segmentation methods. Computer-aided diagnosis (CAD) systems can support the radiologist in identifying the COVID-19 infection from lung CT images. Since COVID-19 is a new disease, therefore CAD systems are helpful to instruct less experienced radiologists. The main aim of the CAD systems is to provide a precise segmentation of the infected region from lung CT.
Figure 1.
Four examples of COVID-19 existing in chest CT images (COVID-19 infection is highlighted by red boxes).
A growing number of research groups across the globe have shown that medical image segmentation algorithms based on deep learning have a tremendous capacity that can help detect and segment COVID-19 infections from lung CT ges. In [8], a deep learning-based method is suggested to segment COVID-19 infection by aggregating residual transformations and employing soft attention techniques to learn significant feature representations from lung CT images. In [9], an encoder–decoder network with feature variation and progressive atrous spatial pyramid pooling blocks is proposed to segment the infected region. A total of 21,658 annotated chest CT images (861 confirmed COVID-19 patients) were used to train the segmentation model. With CT images of 130 patients, a dice score of was achieved. The authors of [10] investigated the effectiveness of deep learning models for segmenting pneumonia infected area in CT images for the detection of COVID-19. Specifically, they studied the efficacy of U-Net and a fully convolutional neural network (FCN) with CT images. With a dataset of 10 axial volumetric CT scans of confirmed COVID-19 pneumonia patients, the FCN model achieved an F1-score (dice score) of approximately.
In [11], a COVID-19 pneumonia lesion segmentation network, called COPLE-Net, was proposed to handle the lesions with various scales and appearances. In this model, a noise-robust dice loss (a generalization of dice loss) is introduced. This segmentation model has been trained and evaluated on images of 558 COVID-19 patients collected from 10 different hospitals, achieving a dice score of . Fan et al. [12] employed a parallel partial decoder to aggregate features from high-level layers to generate coarse representations. Then, they used recurrent reverse attention and edge attention guidance approaches to model the boundaries of infected areas. In [12], Fan et al. also proposed a semi-supervised segmentation framework, Semi-Inf-Net, based on a randomly selected propagation strategy that needs a few labeled pieces of data for training. The Semi-Inf-Net model achieved a dice score of with nine real CT volumes with 638 slices. Muller et al. [13] used different preprocessing methods and on-the-fly data augmentation techniques for training the 3D U-Net architecture using a small CT image dataset. They achieved a dice score of with 20 CT volumes.
As mentioned above, patchy ground-glass and consolidations, and pathological changes, limit the accuracy of the existing segmentation methods. Receptive field (field-of-view), a region of neurons in a particular layer that affects a neuron in the next layer, is a vital concept in designing CNN. Large receptive fields could help deep learning models to learn contextual information and COVID-19 infection-related features that yield accurate segmentation results. The most common ways to enlarge the receptive field of a CNN is to increase the depth of the network, use pooling operations, and enlarge of sizes of filters. The increase of network depth or enlargement of sizes of filters significantly increases the computational cost, and pooling operations yield information loss. Dilated convolution [14] is also employed to enlarge the receptive fields of CNNs by inserting zeros in the filters, which has no computational cost.
In an attempt to address the problems stated above, we propose a fully automated and efficient deep learning-based method called LungINFseg, to segment the COVID-19 infection in lung CT images. Specifically, we propose the receptive-field-aware (RFA) module that can enlarge the receptive field of a segmentation models and increase the learning ability of the model without information loss. RFA comprises convolution layers to extract COVID-19 features, dilated convolution consolidated with learnable parallel-group convolution to enlarge the receptive field, frequency domain features obtained by discrete wavelet transform (DWT), which also enlarge the receptive field, and an attention mechanism to promote COVID-19-related features. We compared LungINFseg with 13 state-of-the-art deep learning-based segmentation methods to demonstrate its effectiveness. The main contributions of this article are listed below:
We propose a fully automated and efficient deep learning based method to segment the COVID-19 infection in lung CT images.
We propose the RFA module that can enlarge the receptive field of the segmentation models and increase the learning ability of the model without information loss.
We present a comprehensive comparison with 13 state-of-the-art segmentation models, namely, FCN [15], UNet [16], SegNet [17], FSSNet [18], SQNet [19], ContextNet [20], EDANet [21], CGNet [22], ERFNet [23], ESNet [24], DABNet [25], Inf-Net [12], and MIScnn [26].
Extensive experiments were performed to provide ablation studies that add a thorough analysis of the proposed LungINFSeg (e.g., the effect of resolution size and variation of the loss function). To reproduce the results, the source code of the proposed model is publicly available at https://github.com/vivek231/LungINFseg.
This article is structured as follows: Section 2 explains the proposed LungINFseg model. Section 3 presents experimental results with an ablation study about the features of the proposed model. Finally, Section 4 concludes the article.
2. Methodology
Figure 2 presents the framework of the proposed LungINFseg model, which includes encoder and decoder networks. LungINFseg receives CT images as input and produces binary masks highlighting the infected regions. The features of each encoder block are bypassed to the corresponding decoder block to preserve the spatial feature information. In the following sections, we explain each part in detail.
Figure 2.
Framework of proposed LungINFseg.
2.1. Encoder
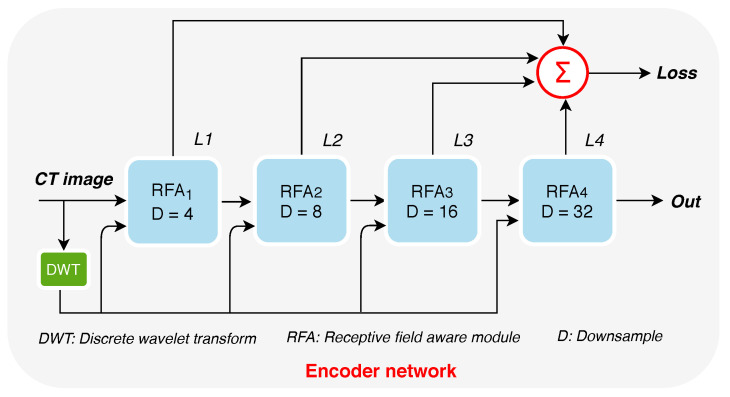
Figure 3 shows the encoder network that comprises four RFA blocks. As one can see, the CT images are fed into the main DWT is to obtain multi-band multi-scale decomposition of input lung CT images. The resulting DWT representations of CT images serve as an inputs to RFA blocks.
Figure 3.
The encoder network. represent the block-wise losses. D refers to the down-sampling rate. Out represents the output features generated by the Encoder network. RFA refers to the receptive field aware module. DWT refers to the discrete wavelet transform.
2.1.1. Increasing the Receptive Fields Using Discrete Wavelet Transform (DWT)
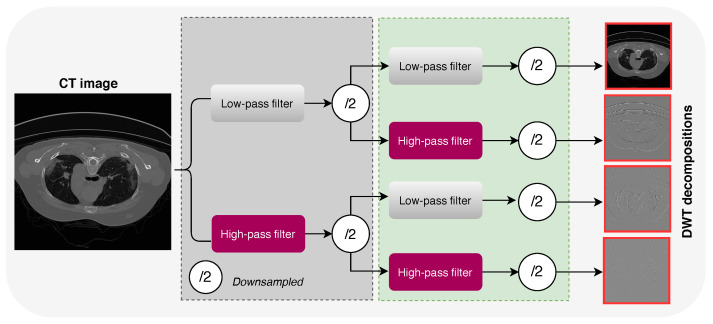
As the human visual system has unequal sensitivity to frequency components, inserting frequency information oto the deep learning-based COVID-19 infection segmentation models can significantly improve their performance. In this study, DWT was utilized to extract COVID-19 infection-relevant contextual information, enlarge the receptive field, and preserve image contextual and spatial information. The use of DWT can enlarge the receptive field of CNNs and also increase the amount of data, which enhances the training process. DWT uses filter banks for recognizing both time and frequency resolutions at the same time [27]. In this work, we use 2D DWT with four Haar filters, namely, , , , and , to decompose a particular lung CT image x into four sub-bands, i.e., , , , and , as shown in Figure 4. The decomposition process can be expressed as follows [28]:
| (1) |
Figure 4.
Illustration of decomposing a CT image into sub-band using DWT.
As shown in Figure 4, the input CT is convoluted with low-pass and high-pass filters. While the output of each filter contains half the frequency content, it has the same size as the input CT image. Therefore, the outputs of the low and high branches together comprise the same frequency content as the input CT image; however, the amount of data is doubled, which improves the training process of the proposed model (a kind of data augmentation). Figure 5 shows a zoom-in visualization of the decomposition for a CT image into four sub-bands using DWT. It should be noted that DWT is related to the pooling operation and dilated filtering [29]. Assume that we make an average pooling with a factor 2 on input image x; we get . As one can see in Equation (1), DWT decomposition is connected to the average pooling: for example, the only difference between and is the fixed coefficient . In turn, the decomposition of an image into sub-images using DWT is relatively connected to dilated filtering.
Figure 5.
Illustration of a zoom-in visualization of decomposing a CT image into four sub-bands using DWT. A, H, V and D refer to Approximation, Horizontal Detail, Vertical Detail and Diagonal Detail, respectively.
2.1.2. Receptive-Field-Aware (RFA) Module
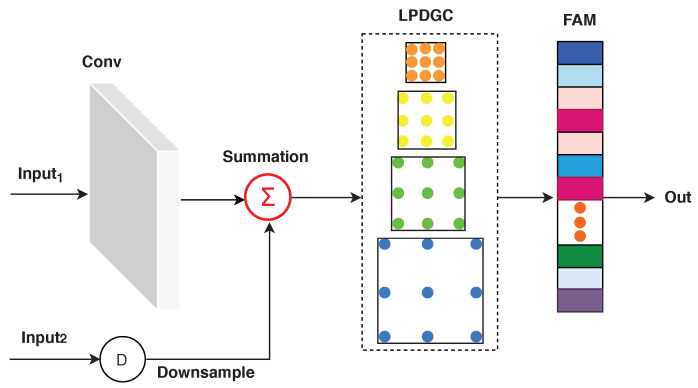
Figure 6 shows the structure of the RFA module, which includes convolutional layers obtained from ResNet-18 pre-trained on ImageNet [30], a learnable parallel dilated group convolutional block (LPDGC), and a feature attention module (FAM). RFA encoding layers can learn low-level features from lung CT images, such as spatial information (e.g., shape, edge, intensity, and texture) in the training phase. As one can see in Figure 6, the RFA block receives two inputs. Input represents the features extracted in the previous layers (except in the first RFA block, input represents the input CT images). Input represents the DWT decompositions of the input CT image. Input is fed into a convolution layer with a kernel of size and a stride of 1. The resulting features are summed with input and then fed into LPDGC and FAM modules. Note that the DWT features are resized to the size of Input using bilinear interpolation before the summation process.
Figure 6.
Proposed RFA module. Conv refers to convolution layers. D refers to the down-sampling rate. Out represents the output features generated by the RFA module. LPDGC refers to the learnable parallel dilated group convolutional block. FAM refers to the feature attention module.
Learnable Parallel Dilated Group Convolutional (LPDGC) Block
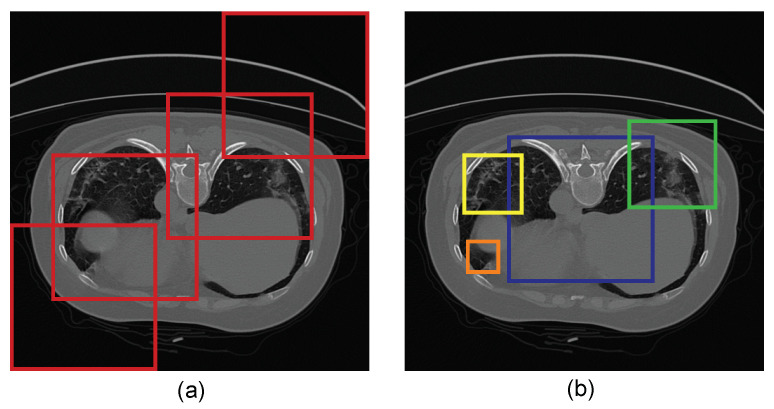
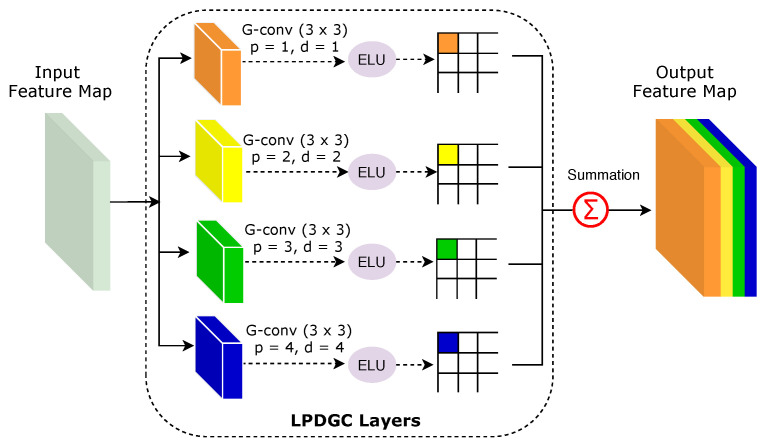
Figure 7 illustrates how receptive fields with varying dilation rates can capture the small and relevant regions in CT images. In this work, we propose the use of the LPDGC block, in which the conventional convolutional filters employed in the parallel dilated group convolutional (PDGC) block are replaced by a fully learnable group convolution mechanism [31]. Figure 8 shows the architecture of the LPDGC block, which comprises four group convolution (G-conv) layers with different dilation rates (1, 2, 3, and 4) followed by an exponential linear unit (ELU) activation function. The kernel size of each G-conv layer is .
Figure 7.
Illustration of receptive fields. (a) Receptive fields in the same layer with the same size kernel that capture more background pixels, and (b) receptive fields with varying dilation rates (shown in four different colored boxes) which capture the small and relevant regions.
Figure 8.
Illustration of the LPDGC block. Here, p and d refer to the padding and dilation rates respectively. ELU refers to the exponential linear unit activation function.
The main goal of learnable group convolution methods is to design a dynamic and efficient mechanism for group convolution, in which input channels and filters in each group are learned during the training phase. In general, the grouping structure can be expressed as two binary selection matrices for channels () and filters (), as follows:
| (2) |
| (3) |
The size of is , and the size of is , where, C, N, and G refer to the numbers of channels, filters, and groups respectively. It should be noted that the elements of and are set as 1 or 0 during the training process, where (i, j) = 1 indicates that the channel is set to the group. Similarly, (i, j) = 1 indicates that the filter is set to the group. The elements of and are learned during the training process of the CNNs. As shown in Figure 8, the outputs of the four dilated convolutions are aggregated through an element-wise sum operation. Consequently, the size of receptive-field is increased and multi-scale spatial dependencies are considered without resorting to fully connected layers, which would be computationally infeasible. The LPDGC block helps capture the global context in CT images without reducing the resolution of the segmentation map.
Feature Attention Module (FAM)
Feature attention modules (FAMs) [32] were recently used to encourage CNNs to learn and focus on task-relevant information instead of learning non-useful information (background, non-desired objects, etc.). As one can see in Figure 9, FAM computes the final feature of each channel as a weighted a sum of the features of all channels and original features, which helps boost COVID-19-relevant information and learn semantic dependencies between all feature maps. It should be noted that refers to reshaping Y to . As shown in Figure 9 (the lower branch), the input feature vector is multiplied by its transposed , and the resulting vector is fed into a softmax layer to get the channel attention map . The final output O is obtained as follows:
| (4) |
where is the weight factor, and ⊕ refers to element-wise sum operation.
Figure 9.
Diagram of our feature attention module (FAM).
2.2. Decoder Network
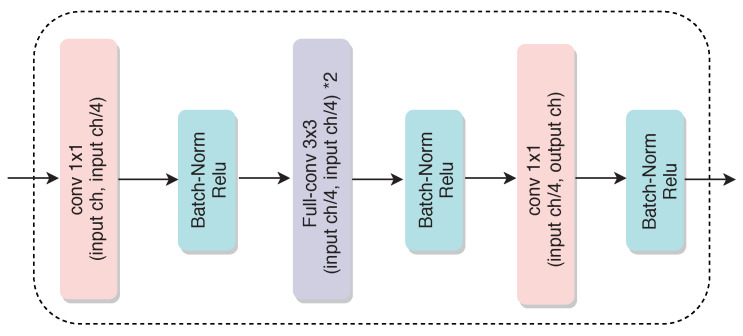
Figure 10 shows the architecture of the decoder network, which consists of four main decoding blocks. The fully-convolutional approach proposed in [15] is employed. This first convolutional layer decreases the overall computational cost by adding a kernel. Upsampling layers with a factor *2 are used to upsample the resulting features, and then they are added to the features coming from the corresponding encoder layers via skip connections (as shown in Figure 2). A threshold of 0.5 is employed to convert the output to binary masks. The segmented binary mask has the same size as that of the input image.
Figure 10.
Illustration of the decoder network.
2.3. Architecture of LungINFseg
Table 1 describes the architecture of LungINFseg. We present the layers of the encoder and decoder, including the input and output feature maps with the number of strides, kernel size, and padding. It should be noted that the input of each encoder block is bypassed to the output of its identical decoder block to recover the spatial feature information [33].
Table 1.
Architecture details of LungINFseg. Skip connection is used to connects the encoder layers with the corresponding decoder layers to preserve the spatial information.
| Layer | Type | Input Feature Size | Stride | Kernel Size | Padding | Output Feature Size | |
|---|---|---|---|---|---|---|---|
| ENCODER | 1 | Initial block with DWT | n × 1 × 256 × 256 | 1 | 7 | 3 | n × 64 × 128 × 128 |
| 2 | RFA Block 1 | n × 64 × 128 × 128 | 1 | 3 | 1 | n × 64 × 64 × 64 | |
| 3 | RFA Block 2 | n × 64 × 64 × 64 | 2 | 3 | 1 | n × 128 × 32 × 32 | |
| 4 | RFA Block 3 | n × 128 × 32 × 32 | 2 | 3 | 1 | n × 256 × 16 × 16 | |
| 5 | RFA Block 4 | n × 256 × 16 × 16 | 2 | 3 | 1 | n × 512 × 8 × 8 | |
| DECODER | 6 | Block 1 | n × 512 × 8 × 8 | 2 | 3 | 1 | n × 256 × 16 × 16 |
| 7 | Block 2 | n × 256 × 16 × 16 | 2 | 3 | 1 | n × 128 × 32 × 32 | |
| 8 | Block 3 | n × 128 × 32 × 32 | 2 | 3 | 1 | n × 64 × 64 × 64 | |
| 9 | Block 4 | n × 64 × 64 × 64 | 1 | 3 | 1 | n × 64 × 64 × 64 | |
| 9 | ConvTranspose | n × 64 × 64 × 64 | 2 | 3 | 1 | n × 32 × 128 × 128 | |
| 9 | Convolution | n × 32 × 128 × 128 | 1 | 3 | 1 | n × 32 × 128 × 128 | |
| 10 | ConvTranspose (Output) | n × 32 × 128 × 128 | 2 | 2 | 0 | n × classes (1) × 256 × 256 |
2.4. Loss Functions
In this work, we used block-wise loss (BWL) and total loss (TL) functions. In the case of the BWL function, we used dice loss function to compare the features extracted by each RFA block. The BWL function can be formulated as follows:
| (5) |
where N is the number of RFA blocks, H is the number of channels generated by RFA block i, y represents the ground-truth, represents the corresponding feature maps, is the predicted mask, represents the feature maps generated by the RFA blocks, and is the Dice coefficient that can be expressed as follows:
| (6) |
Regarding the TL function, we calculated the loss of the whole network as follows:
| (7) |
The overall loss (OL) function used for training the proposed model is formulated as:
| (8) |
2.5. Evaluation Metrics
To assess the performances of the segmentation models, five evaluation metrics were used: accuracy (ACC), dice coefficient (DSC), intersection over union (IoU), sensitivity (SEN), and specificity (SPE). The formulations of these metrics are given in Table 2.
Table 2.
Metric used to evaluate the segmentation methods.
| Metric | Formula |
|---|---|
| Accuracy (ACC) | (TP + TN) / (TP + TN + FP + FN) |
| Dice coefficient (DSC) | 2.TP / (2.TP + FP + FN) |
| Intersection over Union (IoU) | TP / (TP + FP + FN) |
| Sensitivity (SEN) | TP/(TP + FN) |
| Specificity (SPE) | TN / (TN + FP) |
TP = True Positives; TN = True Negatives; FP = False Positives, FN = False Negatives.
3. Experimental Results and Discussion
In this section, the experimental details, the ablation study, the results of the proposed model, and the comparisons with state-of-the-art models are provided.
3.1. Experimental Details
3.1.1. COVID-19 Lung CT Dataset
To evaluate the efficacy of the proposed model, we employed the publicly available dataset provided in [34], which contains 20 labeled COVID-19 CT scans (1800 + annotated slices). This dataset can be found at https://zenodo.org/record/3757476#.X-T7P3VKhhE. Left lung, right lung, and infections were marked by two radiologists and confirmed by an experienced radiologist. The dataset was divided (patient-wise) into three subsets: for training, for validation, and for testing.
3.1.2. Data Augmentation and Parameter Setting
Data augmentation techniques were applied during the training phase to improve the performance of the model and robustness. To augment the CT dataset, we conducted the following procedures: (1) we scaled the images by varying the scaling variable from 0.5 to 2.0 with a step size of 0.25, (2) we employed the gamma correction on the CT slices by changing the gamma scaling constant from 0.5 to 1.5 with a step size of 0.5, and (3) we performed the flipping operations (horizontally and vertically) with 0.5 and rotated them with various angles, such as 15.
Besides, lung CT images were resized to pixels. Finally, we normalized each wavelet to [0, 1] to get the input of its corresponding binary segmentation network. It should be noted that LungINFseg processes each CT volume slice by slice. The hyperparameters of the model were empirically tuned. We examined numerous optimizers, such as SGD, AdaGrad, Adadelta, RMSProp, and Adam, while changing the learning rate; we obtained the best outcomes with the Adam optimizer with = 0.5, = 0.999, and learning rate = 0.0002 with a batch size of four. We trained all segmentation models from scratch for 100 epochs. The experiments were carried out on an NVIDIA GeForce GTX 1070Ti with 8 GB of video RAM. The operating system was Ubuntu 18.04 using a 3.4 GHz Intel Core-i7 with 16 GB of RAM. The main required packages involve Python 3.6, CUDA 9.1, cuDNN 7.0, and PyTorch 0.4.1. To reproduce the results, the source code of the proposed model is publicly available at https://github.com/vivek231/LungINFseg.
3.2. Ablation Study
To demonstrate the impact of each block on the performance of the proposed model, an ablation study was done. We firstly trained a baseline model without appending the discrete wavelet transform (DWT), learnable parallel dilated group convolutional (LPDGC) block, or feature attention module (FAM). Next, we added DWT to the baseline model (baseline + DWT). Besides, the LPDGC block was added separately to the baseline model (baseline + LPDGC). Apart from this, we also added FAM to each encoding layer of the baseline model (baseline + FAM). Several configurations were investigated, such as baseline + DWT + LPDGC and baseline + DWT + FAM. Finally, we studied the performance of the proposed model with and without data augmentation.
Table 3 presents the results of different configurations of the examined models. The baseline model yielded DSC and IoU scores of and respectively. From this initial check, there is a possibility of improvement in model performance. Alternatively to adding a gray-scale channel from lung CT images, we substituted the encoder input by adding DWT to baseline (baseline + DWT); note that DWT produces four channels that carry multi-scale (multi-bands) features. Baseline + DWT achieved gains of and in DSC and IoU scores, respectively, when compared to the baseline model.
Table 3.
Investigating the performance of different configurations of the proposed method (mean ± standard deviation). Best results are in bold.
| Model | ACC (%) | DSC (%) | IoU (%) | SEN (%) | SPE (%) |
|---|---|---|---|---|---|
| Baseline | |||||
| Baseline + DWT | |||||
| Baseline + LPDGC | |||||
| Baseline + FAM | |||||
| Baseline + DWT + LPDGC | |||||
| Baseline + DWT + FAM | |||||
| LungINFseg (w/o augmentation) | |||||
| LungINFseg (with augmentation) |
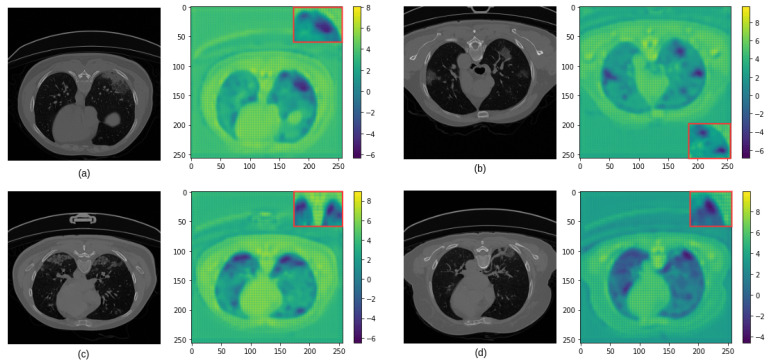
Furthermore, the LPDGC block was added to the baseline model to expand the receptive field with varying dilation rates, with the various sizes of kernels, allowing dense feature extraction in the encoder. Figure 11 reveals that the LPDGC block can help capture some small infected regions from lung CT images. Baseline + LPDGC yielded clear improvements of and in the DSC and IoU scores respectively, when compared to the baseline model. Baseline + FAM yielded an enhancement in all evaluation matrices, as it achieved 1.5–2% improvements in DSC, IoU, and SEN scores, meaning the FAM block helps to improve the feature discriminability between a given COVID-19-infected region and neighboring healthy pixels.
Figure 11.
The role of LPDGC in capturing small COVID-19 lung infections from CT images (represented in dark blue). (a–d) present examples of COVID-19 infection in CT images (left) and the corresponding Heatmaps (right). Here, the red box presents a zoom-in visualization of the infected region.
Based on the significant enrichment of each block, DWT and LPDGC blocks were combined with the baseline model, which led to improvements of more than in DSC, IoU, and SEN scores, and a decrement in the standard deviation by . Besides, we added DWT and FAM to the baseline model, which allowed us to create descriptive features to highlight the infected region in poor contrast or fuzzy-boundary CT images. The experiments revealed that this configuration yields small increases on the evaluation metrics compared to previous results.
Using the proposed LungINFseg model, we experimented with varying configurations with and without applying data augmentation during the training procedure. Without implementing data augmentation (w/o augmentation), LungINFseg obtained encouraging improvements in DSC and IoU scores when compared to the baseline model. Finally, we utilized data augmentation (with augmentation) with LungINFseg. The performance of LungINFseg was improved by 5–6% in DSC, IoU, and SEN scores. The standard deviation of LungINFseg was reduced from to . These effects reveal that LungINFseg can present more precise and robust segmentation compared to the baseline model.
3.3. Analysis of the Performance of the Proposed Model
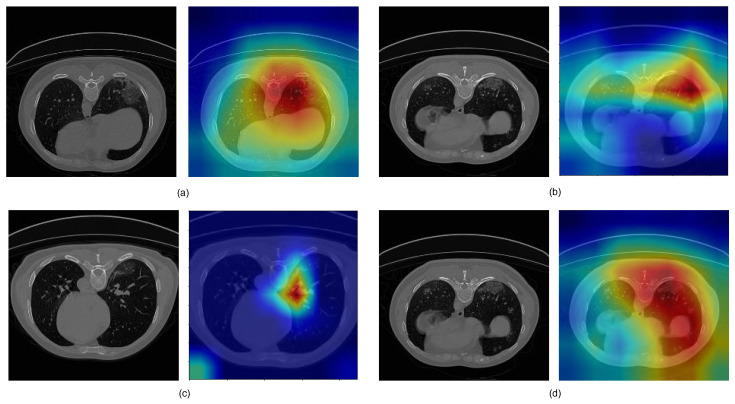
Figure 12 presents four samples of channel attention maps (CAMs) of lung CT COVID-19 infection images. The CAMs shown in the figure were obtained from the different encoding layers of LungINFseg. The red refers to a higher probability of the presence of infection in the lung, while the blue represents a lower probability of the existence of an infection region. As shown, LungINFseg helps highlight infected regions while supplying less attention to neighboring pixels.
Figure 12.
Different examples of channel attention maps (CAMs) obtained from the LungINFseg. (a–d) present examples of COVID-19 infection in CT images (left) and the corresponding CAMs (right).
Table 4 presents the effectiveness of input image resolution on the performance of the proposed model (, , , and ). With the image resolution , a feature map was produced at the final encoding layer, which extracts infected region features from CT images. However, the use of higher resolution images keeps some artifacts at the segmented masks, leading to DSC and IoU scores of and , respectively. With the image resolution , a feature map was produced at the final encoding layer. This image resolution did not contribute to advancing the results. In turn, the image size of yielded an feature map at the final encoding layer. This feature map preserves infected-area-associated features and discards the irrelevant ones. Lastly, we examined an input size of ; we found that it yielded unclear boundary results in the segmented masks.
Table 4.
The performance of the LungINFseg with different image resolutions on the test set (mean ± standard deviation). Best results are in bold.
| Input Size | ACC | DSC | IoU | SEN | SPE | Feature Map Size |
|---|---|---|---|---|---|---|
Table 5 presents the performance of the proposed model with different combinations of loss functions: BCE (i.e., TL without dice loss–Equation (7)), BCE + IoU-binary, BCE + SSIM [35], BCE + dice loss (i.e., TL–Equation (7)), and TL + BWL (OL–Equation (8)). As shown, all loss functions achieved a dice score higher than . The IoU-binary and SSIM loss function did not achieve a promising IoU score ( and , respectively). The convergence of these two loss functions is not significant enough to achieve optimal performance. The best dice and IoU scores are achieved with OL, and therefore it has been utilized with the proposed model.
Table 5.
The evaluation of the LungINFseg with different loss functions on the test set (mean ± standard deviation). Best results are in bold.
| Loss Function | ACC (%) | DSC (%) | IoU (%) | SEN (%) | SPE (%) |
|---|---|---|---|---|---|
| BCE | |||||
| BCE + IoU-binary | |||||
| BCE + SSIM | |||||
| TL | |||||
| LungINFseg (OL) |
3.4. Comparisons with the State-of-the-Art
To segment the COVID-19 infection from lung CT images, LungINFseg is compared with the state-of-the-art segmentation models, such as FCN [15], UNet [16], SegNet [17], FSSNet [18], SQNet [19], ContextNet [20], EDANet [21], CGNet [22], ERFNet [23], ESNet [24], DABNet [25], Inf-Net [12], and MIScnn [26] models. All these models are assessed both quantitatively and qualitatively. For the quantitative study, segmentation accuracy is computed using the ACC, DSC, IoU, SEN, and SPE. For a fair comparison, the trainable parameters of the individual evaluated model are also provided. In turn, for the qualitative study, prediction with their corresponding ground truth binary masks are compared visually.
As shown in Table 6, LungINFseg achieved the highest DSC of and the highest IoU of . As for IoU, LungINFseg was significantly improved from to on the test set compared to the best competitor, FCN. Besides, the second-best competitor DABNet obtained and DSC and IoU scores respectively; its depth-wise asymmetric bottleneck module generates a sufficient receptive field and densely utilizes the contextual information. In comparison with the results of the very popular baseline biomedical segmentation model called UNet, LungINFseg exceeds it by more than in both DSC and IoU scores. Additionally, SegNet achieved acutely poor outcomes in all matrices considering it is inefficient to segment accurately by producing many numbers of false positives. In turn, FSSNet has very few parameters (0.17 M); it yielded a DSC score and failed to restore the infected region’s spatial information at the output level. In the same manner, SQNet did not perform properly, but compared to LungINFseg yielded more than improvements in DSC and IoU scores.
Table 6.
Comparing the proposed model with 13 state-of-the-art baseline segmentation methods on the test set (mean ± standard deviation). Best results are in bold. Dashes-indicate that the information is not reported in the cited references.
Besides, the ContextNet creates a poor result, as it fails to retain the global context information efficiently, and LungINFseg shows gains in DSC and IoU scores. Nevertheless, EDANet has performed slightly better——DSC score because of its dilated convolution and dense connectivity aid to attain the greater result. Further, CGNet has shown some advancement due to its learning capability of the joint features of both local features and neighboring context. However, it misses getting much more global information to form effective segmentation. This model yields DSC and IoU scores, but LungINFseg has promising increases of and in both DSC and IoU scores respectively.
Two models, ERFNet and ESNet, employed residual 1-D factorized convolutions in encoding layers to extract important features and support to decrease the computation cost ( M and M of ERFNet and ESNet respectively). Extracted features do not significantly present a contribution to increasing the feature learnability; and LungINFseg achieved better results of around , , and in DSC, IoU, and SEN scores respectively. Moreover, we have compared the results of our model with the Inf-seg model [12]. As one can see, LungINFseg yields a , significant improvement in the DSC score.
Additionally, we have trained MIScnn [26] from scratch and then compared it with LungINFseg, finding that our model outperforms the results of MIScnn in terms of all evaluation metrics. Unlike the models mentioned-above, LungINFseg has a great generalization ability to segment the infection areas from lung CT images, thanks to RFA and DWT modules that can enlarge the receptive field of the segmentation models and increase the learning ability of the model without information loss.
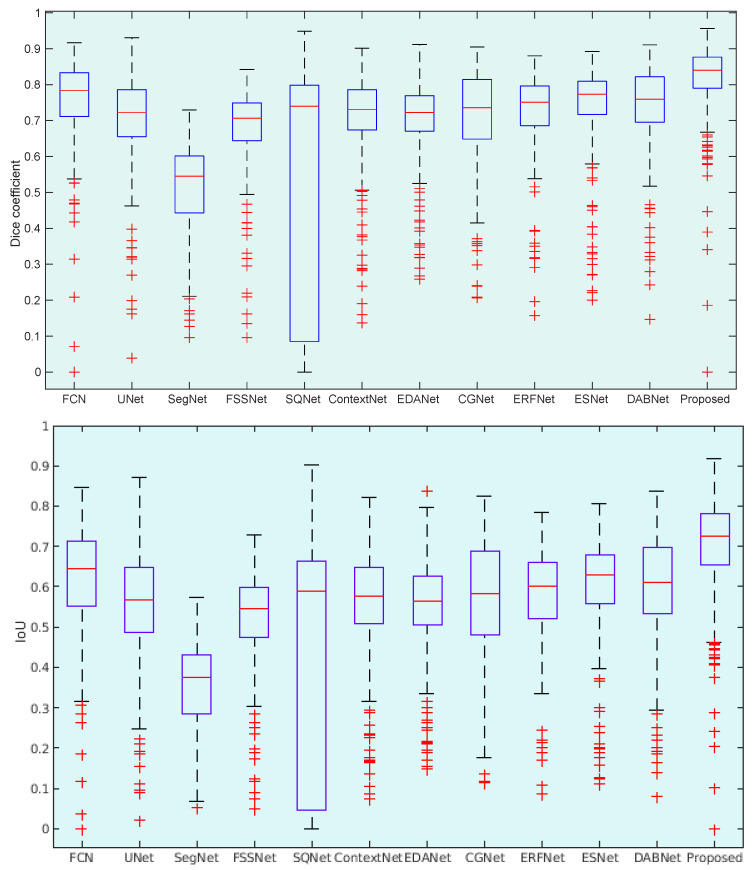
To demonstrate the ability of LungINFseg, we present illustrative statistics of Dice and IoU scores. In Figure 13, we show the boxplots of the Dice and IoU scores of the proposed model, FCN, UNet, SegNet, FSSNet, SQNet SQNet, ContextNet, EDANet, CGNet, ERFNet, ESNet, and DABNet. As shown in Figure 13, among the tested models, the proposed model has the highest mean DSC and IoU scores and the smallest standard deviation with few outliers. In turn, other rest models have represented multiple outliers with low mean and high standard deviation compared to LungINFseg.
Figure 13.
Boxplots of Dice coefficient and Intersection over Union (IoU) scores for all test samples of lung CT infection. Different boxes indicate the score ranges of several methods; the red line inside each box represents the median value; box limits include interquartile ranges Q2 and Q3 (from 25% to 75% of samples); upper and lower whiskers are computed as 1.5 times the distance of upper and lower limits of the box; and all values outside the whiskers are considered as outliers, which are marked with the (+) symbol.
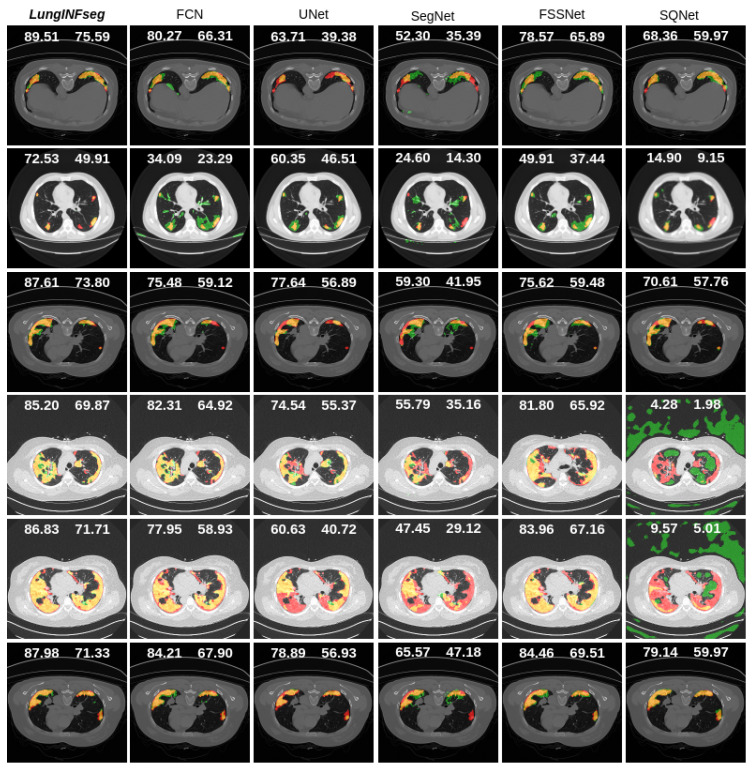
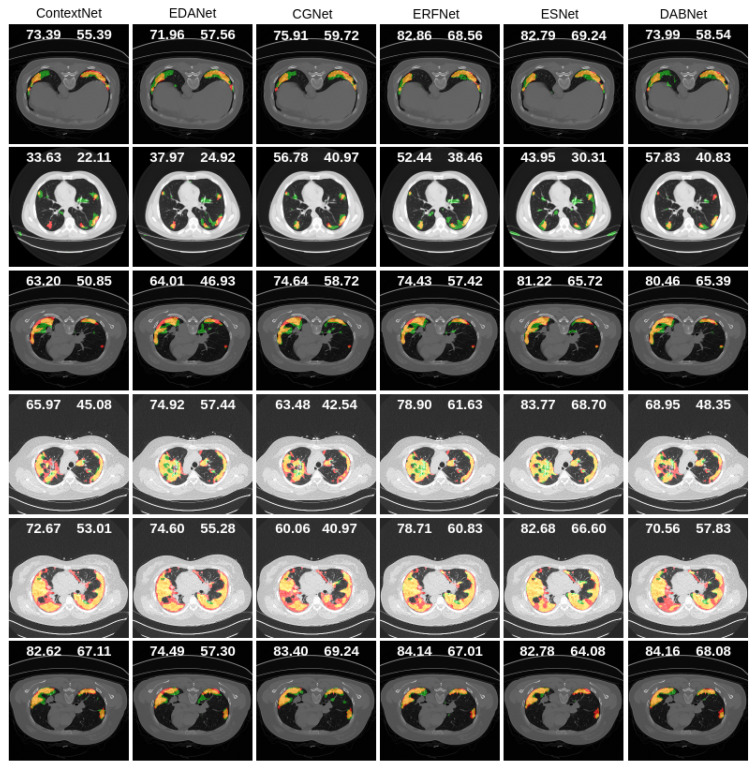
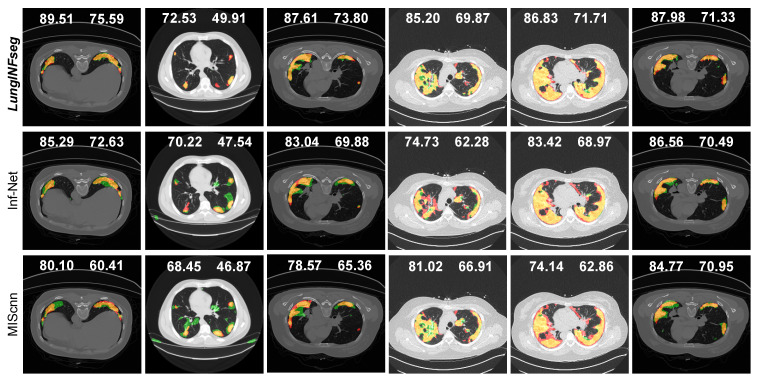
Figure 14, Figure 15 and Figure 16 present qualitative segmentation outcomes of COVID-19 infection from a lung CT image that incorporates a variety of challenging circumstances: illumination variations, irregular boundary, and shape of the infected areas. We have shown six samples as examples along with ground truth and the mask generated by each state-of-the-art method compared to LungINFseg.
Figure 14.
Qualitative comparison of the segmentation results of LungINFseg and five state-of-the-art segmentation methods (left to right: LungINFseg-SQNet). Here, left and right side numbers on each example refer to dice and IoU scores, respectively. The colors used to represent the segmentation results are as follows: TP (orange), FP (green), FN (red), and TN (black).
Figure 15.
Qualitative comparison of the segmentation results of LungINFseg and six state-of-the-art segmentation methods (left to right: ContextNet–DABNet). Here, left and right side numbers on each example refer to dice and IoU scores, respectively. The colors are used to represent the segmentation results as follows: TP (orange), FP (green), FN (red), and TN (black).
Figure 16.
Qualitative comparison of the segmentation results of the LungINFseg, Inf-Net, and MIScnn. Here, left and right side numbers on each example refer to dice and IoU scores, respectively. The colors are used to represent the segmentation results as follows: TP (orange), FP (green), FN (red), and TN (black).
In Figure 14 and Figure 15, for example, first, third, and sixth rows have confirmed single infected regions in both sides of the lung and a very small area covered on the left side of the lung. We clearly recognized that LungINFseg is capable of correctly segmenting both side’s lungs, and the other model has carried larger false positives to do an inaccurate segmentation. Furthermore, for example, fourth and fifth rows have a widespread infection on both sides of the lung. In order to provide promising segmentation, LungINFseg segmented quite properly; despite that, FCN has created an acceptable segmentation. However, UNet, FSSNet, ContextNet, EDANet, CGNet, and ESNet generated very poor predictions due to lacking details contained in the low-level context information. Moreover, second row predictions present single small areas of infection, where LungINFseg shows its promising ability to properly segment infected areas, and the other compared methods produced larger false positive predictions. Figure 16 presents a quantitative comparison of the segmentation results of LungINFseg, Inf-Net, and MIScnn models. As one can see in the examples of the second, third, fourth and sixth columns, LungINFseg can accurately segment COVID-19 infection and has fewer FP compared to the Inf-Net and MIScnn models. The proposed model is especially useful for the segmentation of an infection with an indefinite boundary and small targets.
4. Conclusions
In this article, we have introduced an efficient deep learning-based LungINFseg model to segment the COVID-19 infection in lung CT images. Specifically, we have proposed the RFA module that can enlarge the receptive field of the segmentation models and increase the learning ability of the model without any information loss. We conducted extensive experiments that used 1800+ annotated CT slices to build and test LungINFseg. Further, we compared LungINFseg with 13 state-of-the-art deep learning-based segmentation methods to demonstrate its effectiveness. LungINFseg achieved a dice score of and an IoU score of , which are higher than the ones of the other 13 segmentation methods. Our experiments revealed that the RFA module, which allows enlarging receptive fields and encourages learning contextual information and COVID-19 infection-related features, yields accurate segmentation results. We found that LungINFseg can segment infected regions in CT images accurately and may have promising clinical potential. In future work, we will integrate our proposed model with a fully automated CAD system for making an accurate predictions for the severity of COVID-19. Besides, we will apply LungINFseg to different medical image segmentation problems, such as lung lobe segmentation, skin lesion segmentation, and breast tumor segmentation in ultrasound images.
Acknowledgments
The Spanish Government partly supported this research through project PID2019-105789RB-I00.
Author Contributions
Conceptualization, V.K.S. and M.A.-N.; methodology, V.K.S. and M.A.-N.; software, V.K.S. and M.A.-N.; validation, V.K.S., M.A.-N. and N.P.; formal analysis, V.K.S. and M.A.-N.; investigation, V.K.S. and M.A.-N.; resources, V.K.S. and M.A.-N.; data curation, V.K.S., M.A.-N., and N.P.; writing—original draft preparation, V.K.S., M.A.-N. and N.P.; writing—review and editing, V.K.S., M.A.-N. and N.P.; visualization, V.K.S., M.A.-N. and N.P.; supervision, M.A.-N. and D.P.; project administration, M.A.-N. and D.P.; funding acquisition, M.A.-N. and D.P. All authors have read and agreed to the published version of the manuscript.
Funding
The APC was funded by the Department of Computer Engineering and Mathematics, Universitat Rovira i Virgili, Tarragona, Spain.
Institutional Review Board Statement
Not applicable.
Informed Consent Statement
Not applicable.
Data Availability Statement
The dataset used in this study can be found at https://zenodo.org/record/3757476#.X-T7P3VKhhE.
Conflicts of Interest
The authors declare no conflict of interest.
Footnotes
Publisher’s Note: MDPI stays neutral with regard to jurisdictional claims in published maps and institutional affiliations.
References
- 1.World Health Organization . WHO Coronavirus Disease (COVID-19) Dashboard. Volume 5. World Health Organization; Geneva, Switzerland: 2020. [(accessed on 25 June 2020)]. Available online: Https://covid19.Who.Int. [Google Scholar]
- 2.Dai W.C., Zhang H.W., Yu J., Xu H.J., Chen H., Luo S.P., Zhang H., Liang L.H., Wu X.L., Lei Y., et al. CT imaging and differential diagnosis of COVID-19. Can. Assoc. Radiol. J. 2020;71:195–200. doi: 10.1177/0846537120913033. [DOI] [PMC free article] [PubMed] [Google Scholar]
- 3.Ai T., Yang Z., Hou H., Zhan C., Chen C., Lv W., Tao Q., Sun Z., Xia L. Correlation of chest CT and RT-PCR testing in coronavirus disease 2019 (COVID-19) in China: A report of 1014 cases. Radiology. 2020;296:200642. doi: 10.1148/radiol.2020200642. [DOI] [PMC free article] [PubMed] [Google Scholar]
- 4.Salehi S., Abedi A., Balakrishnan S., Gholamrezanezhad A. Coronavirus disease 2019 (COVID-19): A systematic review of imaging findings in 919 patients. Am. J. Roentgenol. 2020;215:1–7. doi: 10.2214/AJR.20.23034. [DOI] [PubMed] [Google Scholar]
- 5.Casiraghi E., Malchiodi D., Trucco G., Frasca M., Cappelletti L., Fontana T., Esposito A.A., Avola E., Jachetti A., Reese J., et al. Explainable Machine Learning for Early Assessment of COVID-19 Risk Prediction in Emergency Departments. IEEE Access. 2020;8:196299–196325. doi: 10.1109/ACCESS.2020.3034032. [DOI] [PMC free article] [PubMed] [Google Scholar]
- 6.Maguolo G., Nanni L. A critic evaluation of methods for covid-19 automatic detection from x-ray images. arXiv. 2020 doi: 10.1016/j.inffus.2021.04.008.2004.12823 [DOI] [PMC free article] [PubMed] [Google Scholar]
- 7.Giannitto C., Sposta F.M., Repici A., Vatteroni G., Casiraghi E., Casari E., Ferraroli G.M., Fugazza A., Sandri M.T., Chiti A., et al. Chest CT in patients with a moderate or high pretest probability of COVID-19 and negative swab. Radiol. Medica. 2020;125:1260–1270. doi: 10.1007/s11547-020-01269-w. [DOI] [PMC free article] [PubMed] [Google Scholar]
- 8.Chen X., Yao L., Zhang Y. Residual Attention U-Net for Automated Multi-Class Segmentation of COVID-19 Chest CT Images. arXiv. 20202004.05645 [Google Scholar]
- 9.Yan Q., Wang B., Gong D., Luo C., Zhao W., Shen J., Shi Q., Jin S., Zhang L., You Z. COVID-19 Chest CT Image Segmentation–A Deep Convolutional Neural Network Solution. arXiv. 20202004.10987 [Google Scholar]
- 10.Voulodimos A., Protopapadakis E., Katsamenis I., Doulamis A., Doulamis N. Deep learning models for COVID-19 infected area segmentation in CT images. medRxiv. 2020 doi: 10.1101/2020.05.08.20094664. [DOI] [PMC free article] [PubMed] [Google Scholar]
- 11.Wang G., Liu X., Li C., Xu Z., Ruan J., Zhu H., Meng T., Li K., Huang N., Zhang S. A Noise-robust Framework for Automatic Segmentation of COVID-19 Pneumonia Lesions from CT Images. IEEE Trans. Med. Imaging. 2020;39:2653–2663. doi: 10.1109/TMI.2020.3000314. [DOI] [PMC free article] [PubMed] [Google Scholar]
- 12.Fan D.P., Zhou T., Ji G.P., Zhou Y., Chen G., Fu H., Shen J., Shao L. Inf-Net: Automatic COVID-19 Lung Infection Segmentation from CT Scans. arXiv. 2020 doi: 10.1109/TMI.2020.2996645.2004.14133 [DOI] [PubMed] [Google Scholar]
- 13.Müller D., Rey I.S., Kramer F. Automated Chest CT Image Segmentation of COVID-19 Lung Infection based on 3D U-Net. arXiv. 2020 doi: 10.1016/j.imu.2021.100681.2007.04774 [DOI] [PMC free article] [PubMed] [Google Scholar]
- 14.Yu F., Koltun V. Multi-scale context aggregation by dilated convolutions. arXiv. 20151511.07122 [Google Scholar]
- 15.Long J., Shelhamer E., Darrell T. Fully convolutional networks for semantic segmentation; Proceedings of the IEEE Conference on Computer Vision and Pattern Recognition; Boston, MA, USA. 12 June 2015; pp. 3431–3440. [Google Scholar]
- 16.Ronneberger O., Fischer P., Brox T. U-net: Convolutional networks for biomedical image segmentation; Proceedings of the International Conference on Medical Image Computing and Computer-Assisted Intervention; Munich, Germany. 5–9 October 2015; Berlin/Heidelberg, Germany: Springer; 2015. pp. 234–241. [Google Scholar]
- 17.Badrinarayanan V., Kendall A., Cipolla R. Segnet: A deep convolutional encoder-decoder architecture for image segmentation. IEEE Trans. Pattern Anal. Mach. Intell. 2017;39:2481–2495. doi: 10.1109/TPAMI.2016.2644615. [DOI] [PubMed] [Google Scholar]
- 18.Zhang X., Chen Z., Wu Q.J., Cai L., Lu D., Li X. Fast semantic segmentation for scene perception. IEEE Trans. Ind. Inform. 2018;15:1183–1192. doi: 10.1109/TII.2018.2849348. [DOI] [Google Scholar]
- 19.Treml M., Arjona-Medina J., Unterthiner T., Durgesh R., Friedmann F., Schuberth P., Mayr A., Heusel M., Hofmarcher M., Widrich M., et al. MLITS. Volume 2. NIPS Workshop; Barcelona, Spain: 2016. Speeding up semantic segmentation for autonomous driving; p. 7. [Google Scholar]
- 20.Poudel R.P., Bonde U., Liwicki S., Zach C. Contextnet: Exploring context and detail for semantic segmentation in real-time. arXiv. 20181805.04554 [Google Scholar]
- 21.Lo S.Y., Hang H.M., Chan S.W., Lin J.J. Efficient dense modules of asymmetric convolution for real-time semantic segmentation; Proceedings of the ACM Multimedia Asia; Beijing, China. 16–18 December 2019; pp. 1–6. [Google Scholar]
- 22.Wu T., Tang S., Zhang R., Zhang Y. Cgnet: A light-weight context guided network for semantic segmentation. arXiv. 2018 doi: 10.1109/TIP.2020.3042065.1811.08201 [DOI] [PubMed] [Google Scholar]
- 23.Romera E., Alvarez J.M., Bergasa L.M., Arroyo R. Erfnet: Efficient residual factorized convnet for real-time semantic segmentation. IEEE Trans. Intell. Transp. Syst. 2017;19:263–272. doi: 10.1109/TITS.2017.2750080. [DOI] [Google Scholar]
- 24.Wang Y., Zhou Q., Xiong J., Wu X., Jin X. ESNet: An Efficient Symmetric Network for Real-Time Semantic Segmentation; Proceedings of the Chinese Conference on Pattern Recognition and Computer Vision (PRCV); Xi’an, China. 8–11 November 2019; Berlin/Heidelberg, Germany: Springer; 2019. pp. 41–52. [Google Scholar]
- 25.Li G., Yun I., Kim J., Kim J. Dabnet: Depth-wise asymmetric bottleneck for real-time semantic segmentation. arXiv. 20191907.11357 [Google Scholar]
- 26.Müller D., Kramer F. MIScnn: A Framework for Medical Image Segmentation with Convolutional Neural Networks and Deep Learning. arXiv. 2019 doi: 10.1186/s12880-020-00543-7.eess.IV/1910.09308 [DOI] [PMC free article] [PubMed] [Google Scholar]
- 27.Daubechies I. The wavelet transform, time-frequency localization and signal analysis. IEEE Trans. Inf. Theory. 1990;36:961–1005. doi: 10.1109/18.57199. [DOI] [Google Scholar]
- 28.Mallat S.G. A theory for multiresolution signal decomposition: The wavelet representation. IEEE Trans. Pattern Anal. Mach. Intell. 1989;11:674–693. doi: 10.1109/34.192463. [DOI] [Google Scholar]
- 29.Liu P., Zhang H., Lian W., Zuo W. Multi-level wavelet convolutional neural networks. IEEE Access. 2019;7:74973–74985. doi: 10.1109/ACCESS.2019.2921451. [DOI] [Google Scholar]
- 30.Deng J., Dong W., Socher R., Li L.J., Li K., Fei-Fei L. Imagenet: A large-scale hierarchical image database; Proceedings of the 2009 IEEE Conference on Computer Vision and Pattern Recognition; Miami, FL, USA. 20–25 June 2009; pp. 248–255. [Google Scholar]
- 31.Wang X., Kan M., Shan S., Chen X. Fully learnable group convolution for acceleration of deep neural networks; Proceedings of the IEEE Conference on Computer Vision and Pattern Recognition; Long Beach, CA, USA. 16–20 June 2019; pp. 9049–9058. [Google Scholar]
- 32.Fu J., Liu J., Tian H., Fang Z., Lu H. Dual attention network for scene segmentation. arXiv. 20181809.02983 [Google Scholar]
- 33.Chaurasia A., Culurciello E. Linknet: Exploiting encoder representations for efficient semantic segmentation; Proceedings of the 2017 IEEE Visual Communications and Image Processing (VCIP); St. Petersburg, FL, USA. 10–13 December 2017; pp. 1–4. [Google Scholar]
- 34.Jun M., Cheng G., Yixin W., Xingle A., Jiantao G., Ziqi Y., Minqing Z., Xin L., Xueyuan D., Shucheng C., et al. COVID-19 CT Lung and Infection Segmentation Dataset. Zenodo. 2020;20 doi: 10.5281/zenodo.3757476. [DOI] [Google Scholar]
- 35.Wang Z., Bovik A.C., Sheikh H.R., Simoncelli E.P. Image quality assessment: From error visibility to structural similarity. IEEE Trans. Image Process. 2004;13:600–612. doi: 10.1109/TIP.2003.819861. [DOI] [PubMed] [Google Scholar]
Associated Data
This section collects any data citations, data availability statements, or supplementary materials included in this article.
Data Availability Statement
The dataset used in this study can be found at https://zenodo.org/record/3757476#.X-T7P3VKhhE.


