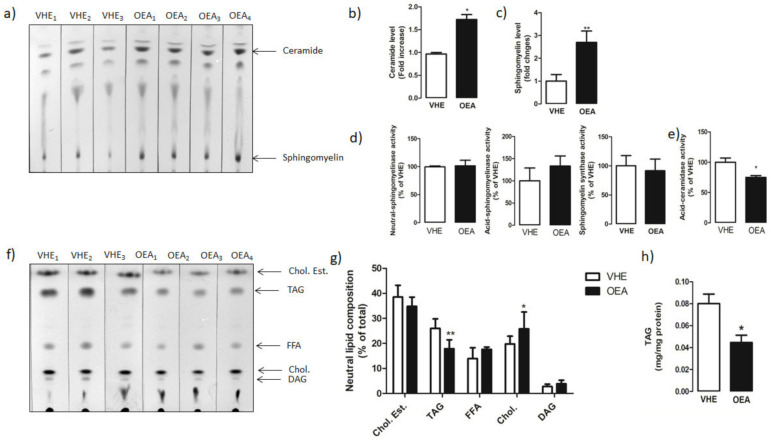
Figure 2.
Hepatic sphingolipid and neutral lipid analysis. Total lipids from VEH and OEA groups were extracted and separated by TLC. (a) Representative TLC separation of sphingolipids. (b,c) Quantification of ceramide and sphingomyelin by densitometry analysis. Ceramide and sphingomyelin level is reported as fold change of OEA versus VHE. (d) Neutral and acid sphingomyelinase and sphingomyelin synthase activities reported as percentages of values measured in VEH. (e) Ceramidase activity assayed in liver homogenates. (f) Representative TLC separation of neutral lipids. (g) Neutral lipids are represented as percentage of the total. (h) Triacylglycerol (TAG) amount was spectrophotometrically quantified with a specific enzymatic assay. In the figure, the mean ± SEM of values obtained from three different analyses is reported. ** p < 0.005; * p < 0.05. Abbreviations: Chol. Est. = cholesterol ester; TAG = triacylglycerols: FFA = free fatty acids; DAG = diacylglycerols.

