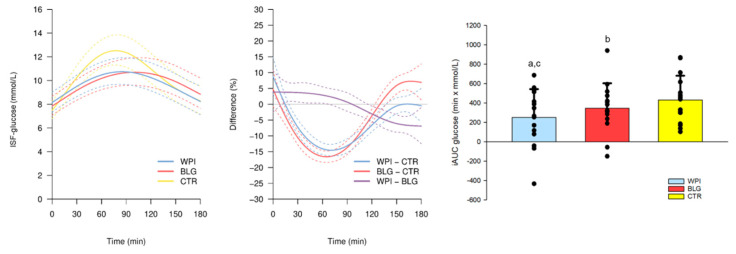
Figure 5.
Interstitial fluid concentration of glucose (ISF-glucose) in the 180 min following intake of the pre-meals β-lactoglobulin (BLG), whey protein isolate (WPI), and control: tap-water (CTR) (−30 min) and standardized breakfast at home (0 min). The panel to the left shows trajectories of the mean ISF-glucose (solid lines) with 95% confidence intervals (95% CIs) (dashed lines) after WPI (blue), BLG (red) and CTR (yellow) consumption. The mean relative differences (solid lines) with 95% CIs (dashed lines) between the WPI and CTR (blue), BLG and CTR (red) and WPI and BLG (purple) are shown in the middle panel. The panel to the right shows the individual incremental area under the curve (iAUC) with a bar plot showing the mean ± standard deviation after WPI (blue), BLG (red) and CTR (yellow) consumption. One-way repeated measure ANOVA, p = 0.002, and post hoc (Student–Newman–Keuls) paired t-tests: a, WPI vs. CTR: p = 0.002; b, BLG vs. CTR: p = 0.077; c, WPI vs. BLG: p = 0.052. n = 15.

