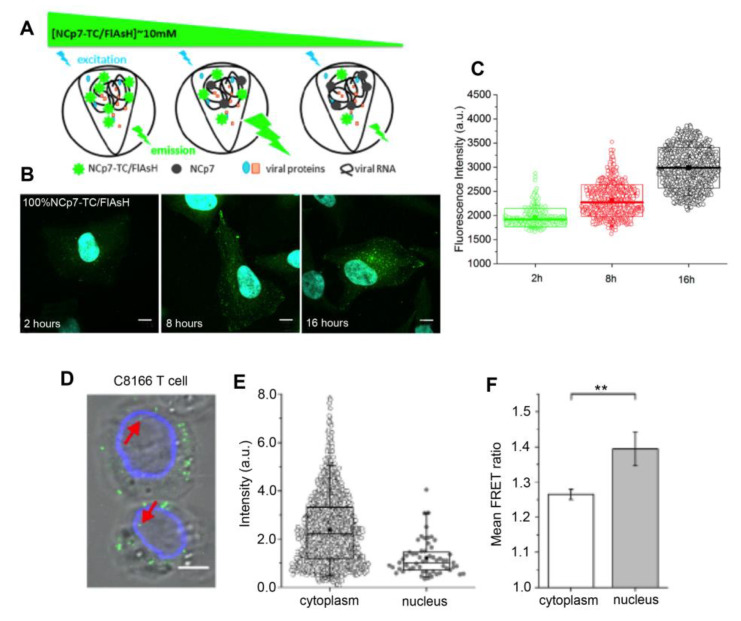
Figure 3.
Fluorescence-based monitoring of the cytoplasmic release of viral proteins: (A) Principle of FlAsH fluorescence quenching at high concentrations. A decrease in the concentration of labeled NCp7 first results in an increase in fluorescence emission due to the reduction in quenching, followed by a decrease when the quenching effect is no longer present and the number of NCp7 molecules decreases further in the complexes. (B) Confocal images of HeLa cells infected by NCp7-TC/FlAsH-containing VSV-G pseudotyped HIV-1 particles at 2, 8, and 16 h.p.i., Scale bar: 10µm (C) Fluorescence intensity of individual cytoplasmic viral complexes detected at 2, 8, and 16 h.p.i. The fluorescence increase reflects the loss of quenching during the release of NCp7-TC/FlAsH molecules. (The box-plot represents SD values, the line and the square represent the median and the mean value, respectively (adapted from [22], copyright 2019, Springer Nature)). (D) Confocal images of C18166 T cells infected by VSV-G pseudotyped HIV-1 containing IN-GFP (green spots), lamin immunostaining (blue); red arrows indicate viral particles located in cell nuclei (E) Intensity of fluorescent spots detected in the cytoplasm and the nucleus (box-plot whiskers represent 5th and 95th percentile, the line and the square depict median and mean value, respectively) (F) Mean FRET ratio of HIV-1 pseudoviruses containing IN-mTFP and IN-mVenus in the cytoplasm and the nucleus, ** p-value < 0.05 (reproduced with permission from the Ref. [21] Copyright 2016, Springer Nature).

