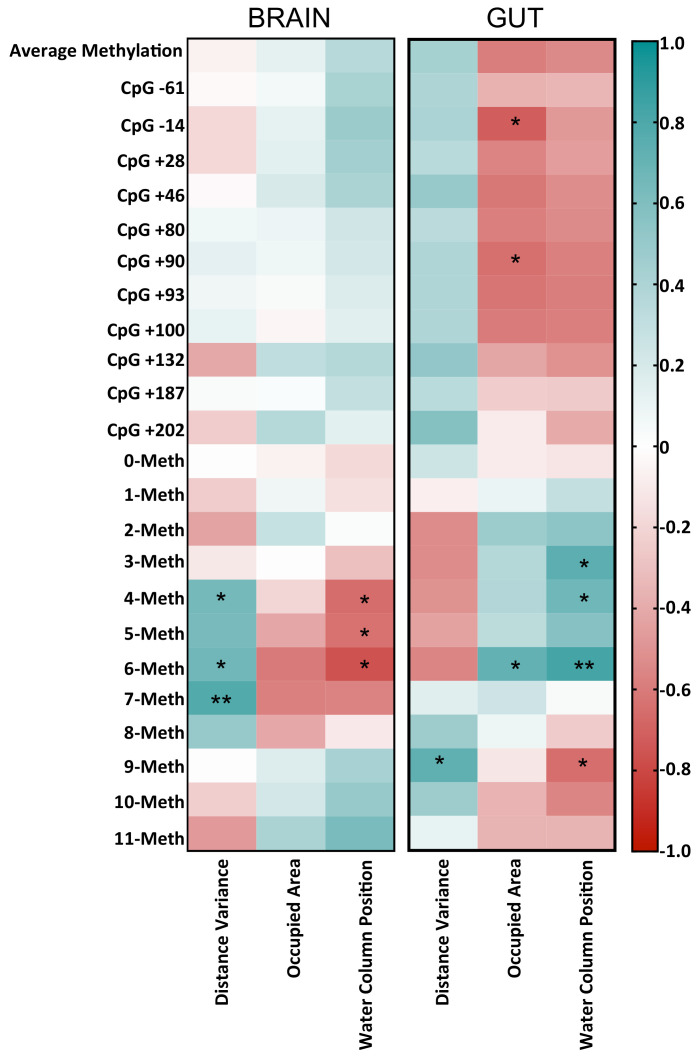
Figure 6.
Correlogram showing Pearson correlation between DNA methylation data and behavioral parameters. The graph reports r values derived from Pearson correlation between average methylation, single-CpG methylation, epiallele classes and distance variance, occupied area and water column positions. The scale color from blue to red indicates a positive to negative correlation (−1 ≤ r ≥ 1). Statistical analyses were performed using a Pearson correlation test (* p ≤ 0.05; ** p ≤ 0.01).

