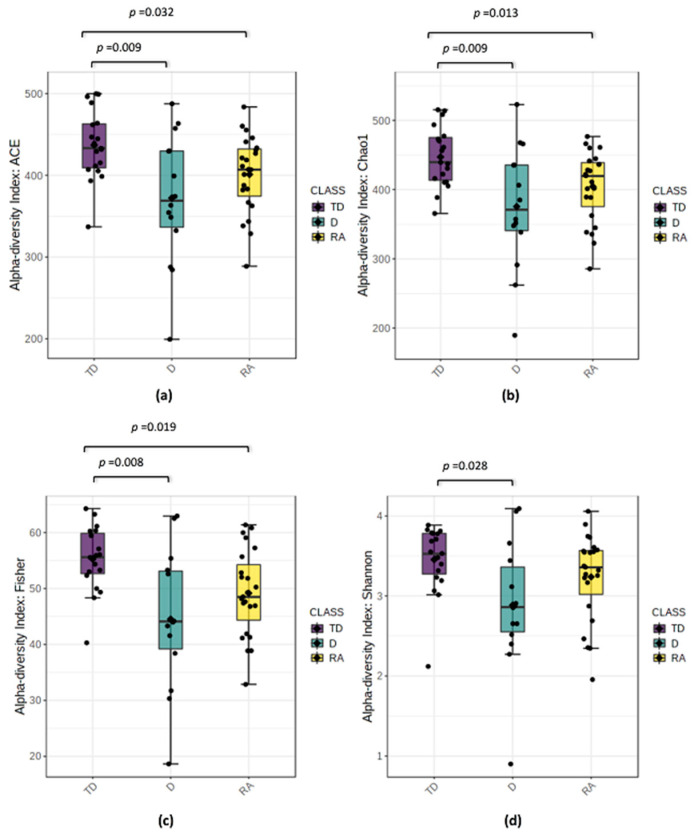
Figure 1.
Alpha-diversity box plots throughout different PD phenotypes groups: Tremor Dominant (TD); Akinetic Rigid (AR); Dyskinetic (D). Indices of alpha diversity of the microbial species in the samples: (a) Abundance-based Coverage Estimator (ACE), (b) Chao, (c) Fisher and (d) Shannon. p values were evaluated using Mann–Whitney U non-parametric test. Median values, interquartile ranges and p values ≤ 0.05 were indicated in the plots.

