Figure 2.
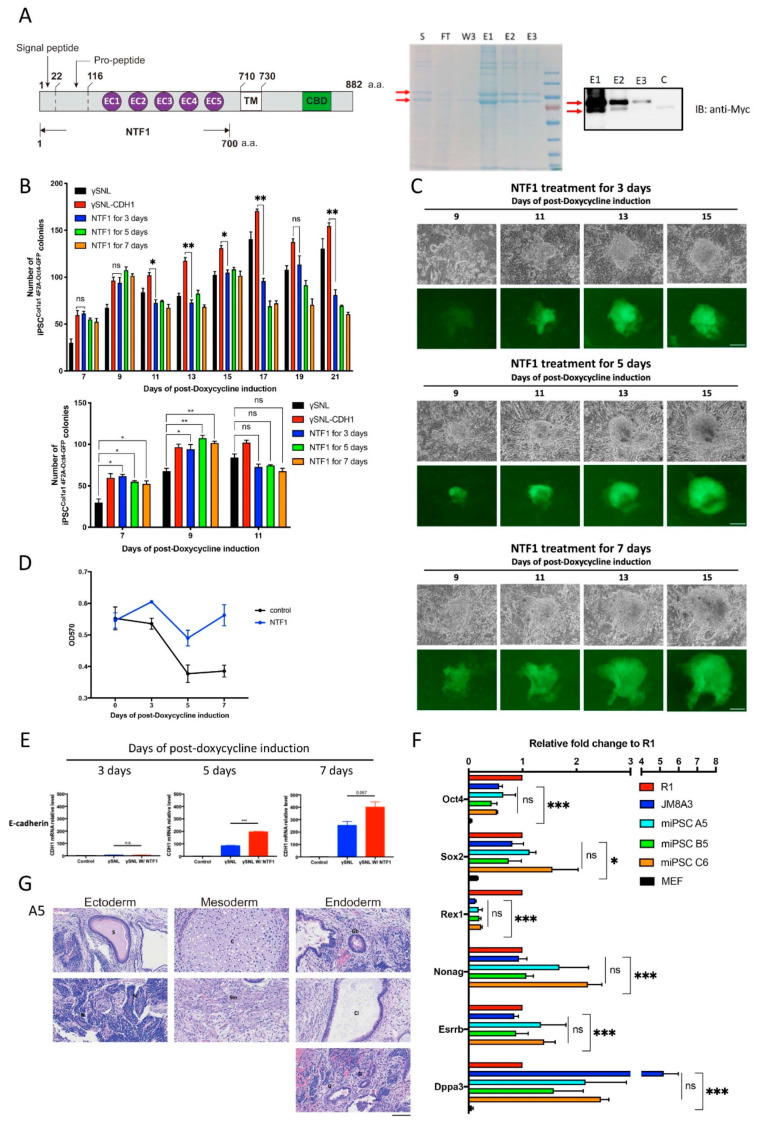
The effect of NTF1 recapitulates the SNL::CHD1-myc feeder adoption at the early stage of reprogramming. (A) Schematic display of the structure of NTF1 protein and purification of the recombinant NTF1 protein. The culture medium collected from the Freestyle 293 cells transfected with pCMV-CDH-NTF1-MYC-His was subjected to NTF1 protein purification. SDS PAGE and western blots were used to analyze the purified product. The red arrows indicate recombinant proteins with different degrees of posttranslational modification. (B) Quantitative analysis of Oct4-GFP-positive clones under different NTF1 treatments during reprogramming. The lower panel shows the data derived from the results of the 7th, 9th, and 11th days in the upper graph. Student’s t-test was applied for statistical evaluation (n = 3). (C) Time-lapse photographs of the Oct4-GFP-positive clones treated with various NTF1 exposure times. The scale bar denotes 50 µm. (D) The growth curve of the induced MEFCol1a1 4F2A Oct4-GFP cells during the first seven days of iPSC induction. An MTT assay was used to quantify cell viability on days 0, 3, 5, and 7 after initiating the induction process. The data points represent the mean of triplicate results. (E) Comparative analysis of endogenous E-cadherin expression in NTF1-treated and untreated MEF cells at the early stage of reprogramming. Harvested cells were subjected to total RNA isolation for the RT-PCR-based gene expression analysis. Cells that did not undergo somatic reprogramming served as controls. (F) Quantitative RT-PCR of pluripotent markers in the above mentioned three iPSC clones compared with two standard ESCs, namely, R1 and JM8A3. (G) Teratoma formation analysis on the A5 iPSC clone to demonstrate its competency for formation of three germ layers. The scale bar denotes 100 µm. S: supernatant; FT: flow-through; W3: 3rd wash; E1: 1st elution; E2: 2nd elution; E3: 3rd elution. *, p < 0.05; **, p < 0.005; ***, p < 0.0005; ns, not significant.

