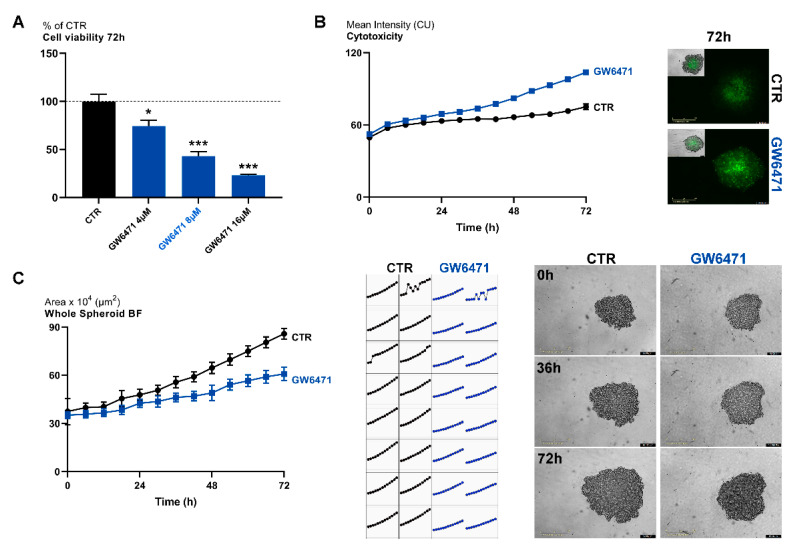
Figure 1.
(A) MTS assay for mammospheres treated with different concentrations of GW6471 for 72 h. *** p < 0.0005; ** p < 0.005; * p < 0.05 vs. control (CTR) (n = 3). Dot line indicates the control level. (B) Live-cell IncuCyte cytotoxicity assay in mammospheres treated with 8 µM of GW6471 for 72 (marked in green; n = 3). Scale bar: 400 µm. (C) Whole spheroid bright field analyzed with IncuCyte 3D single spheroid assay. A representative figure for CTR and GW6471-treated cells at different time points is shown (n = 3). For p values relative to IncuCyte assay please see Supplementary Table S1. Scale bar: 400 µm.

