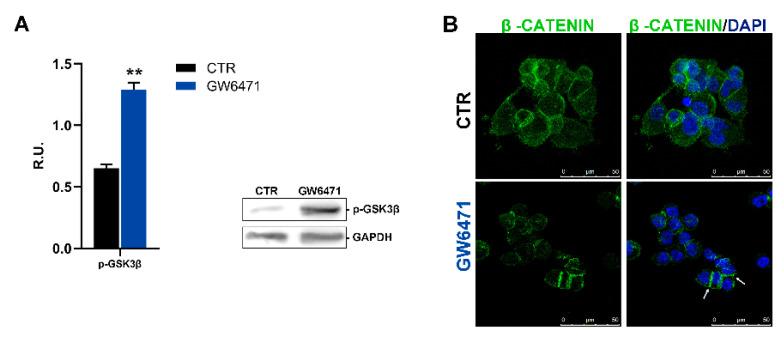
Figure 6.
(A) the active form of GSK3β (Tyr216) analyzed in Western blotting for control and treated mammospheres. A representative western blot image is shown. ** p < 0.005 vs. CTR (n = 3). (B) Immunofluorescence representative figure for β-catenin (green). In blue, the nuclei are stained with DAPI. The arrows indicate the localization at the membrane level. Scale bar: 50 µm.

