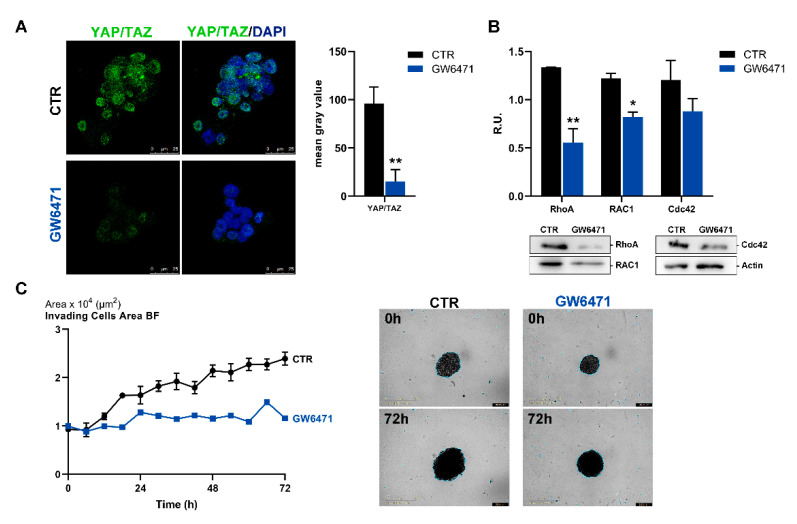
Figure 7.
(A) Immunofluorescence representative images for the marker YAP/TAZ (in green) in control and treated mammospheres. In blue, the nuclei are stained with DAPI. The graph shows the fluorescence intensity of YAP/TAZ in CTR and treated breast cancer stem cells (CSCs). Scale bar: 25 µm. ** p < 0.005 vs CTR. (B) Western blotting for RhoA, RAC1, Cdc42 in control and treated mammospheres. A representative Western blot image is shown. ** p < 0.005; * p < 0.05 vs. CTR (n = 3). (C) Live-cell IncuCyte invading assay for control and treated mammospheres analyzed for 72 h and representative bright-field images. Scale bar: 1 mm. For p values relative to IncuCyte assay please see Supplementary Table S1.

