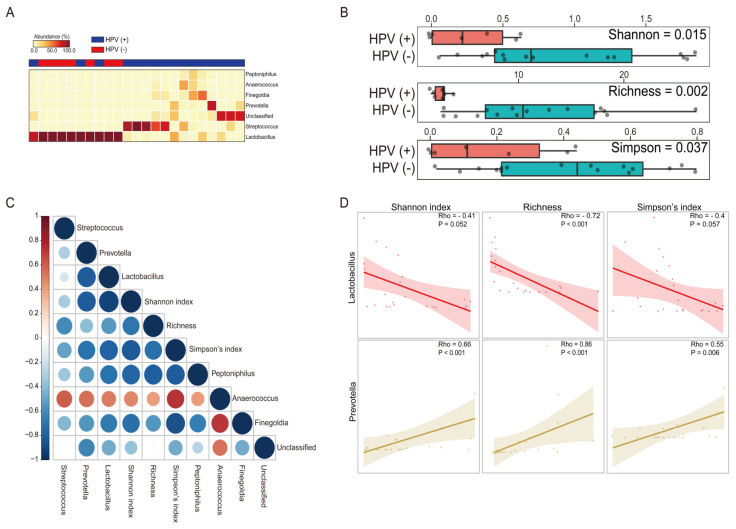
Figure 4.
Vaginal microbiota composition and their correlation pattern analysis comparing HPV positive to negative. (A) Heat map of the differentially abundant microbiota profile between HPV positive and negative (Wilcoxon sum test; only the genera with p < 0.05 were selected). (B) Alpha diversity including the Shannon index, Richness, and Simpson’s index is plotted for participants with HPV negative (pink) and positive (green). (C) Spearman correlation coefficients (Rho) are presented red for positive correlations and blue for negative correlations. The intensity of the color and size of the dot are associated with the Rho coefficient strength. (D) Scatter plots with illustration of the correlation between the specific bacterial genus and alpha diversity of each group’s vaginal microbiota.

