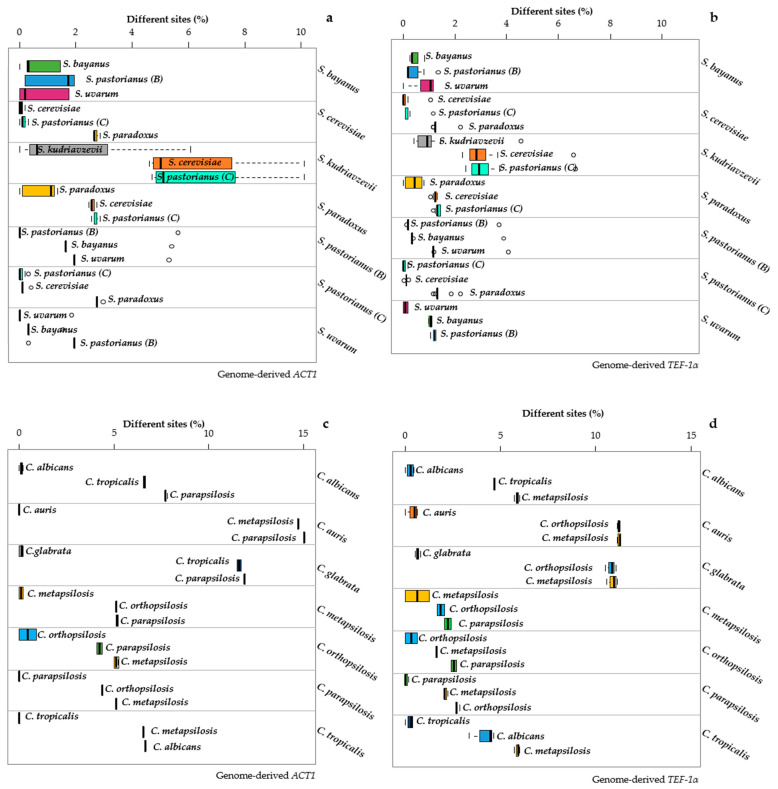
Figure 4.
Distance among and within the Candida and Saccharomyces species. Distance calculated for the genomic Actin (ACT1) and genomic Translational Elongation Factor 1-alpha (TEF1-α) of Saccharomyces are displayed in panels (a,b), respectively. Distance calculated for the genomic ACT1 and genomic TEF1-α of Candida are reported in panels (c,d). Each subpanel reports the distances of the strains belonging to the species under study (indicated on the right of the subpanel) with the sequences of the type strain of the three closest species (indicated close to the box). The width of each box represents the variability of the distances of the strains of each species from the type strains of the three closest species. The internal variability of each species is indicated by the topmost box of each subpanel. The distances among the means of the species are displayed as the distances between the vertical thick segments within the boxes.

