Abstract
Severe acute respiratory syndrome coronavirus 2 (SARS-CoV-2) disease represents the causative agent with a potentially fatal risk which is having great global human health concern. Earlier studies suggested that air pollutants and meteorological factors were considered as the risk factors for acute respiratory infection, which carries harmful pathogens and affects the immunity. The study intended to explore the correlation between air pollutants, meteorological factors, and the daily reported infected cases caused by novel coronavirus in India. The daily positive infected cases, concentrations of air pollutants, and meteorological factors in 288 districts were collected from January 30, 2020, to April 23, 2020, in India. Spearman’s correlation and generalized additive model (GAM) were applied to investigate the correlations of four air pollutants (PM2.5, PM10, NO2, and SO2) and eight meteorological factors (Temp, DTR, RH, AH, AP, RF, WS, and WD) with COVID-19-infected cases. The study indicated that a 10 μg/m3 increase during (Lag0-14) in PM2.5, PM10, and NO2 resulted in 2.21% (95%CI: 1.13 to 3.29), 2.67% (95% CI: 0.33 to 5.01), and 4.56 (95% CI: 2.22 to 6.90) increase in daily counts of Coronavirus Disease 2019 (COVID 19)-infected cases respectively. However, only 1 unit increase in meteorological factor levels in case of daily mean temperature and DTR during (Lag0-14) associated with 3.78% (95%CI: 1.81 to 5.75) and 1.82% (95% CI: -1.74 to 5.38) rise of COVID-19-infected cases respectively. In addition, SO2 and relative humidity were negatively associated with COVID-19-infected cases at Lag0-14 with decrease of 7.23% (95% CI: -10.99 to -3.47) and 1.11% (95% CI: -3.45 to 1.23) for SO2 and for relative humidity respectively. The study recommended that there are significant correlations between air pollutants and meteorological factors with COVID-19-infected cases, which substantially explain the effect of national lockdown and suggested positive implications for control and prevention of the spread of SARS-CoV-2 disease.
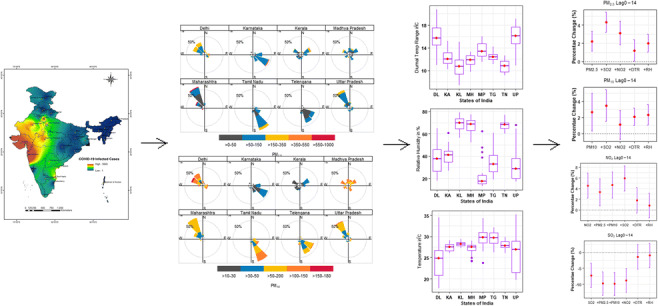
Graphical abstract
Keywords: Air pollution,; Meteorological factors,; COVID-19,; Spearman’s correlation,; Generalized additive model
Introduction
The first strains of human coronavirus were classified in the 1960s, and the virus was responsible for upper respiratory tract infection in young patients (Khan et al. 2020; Shereen et al. 2020; Tyrrell and Myint 1996). The coronavirus pandemic is an ongoing pandemic as COVID-19 is caused by severe acute respiratory syndrome coronavirus 2 (SARS-CoV-2). Scientists have suggested that SARS-CoV-2 might have emerged with revolution from the zoonotic cycle and it was proved that it can spread rapidly from human to human (Chan et al. 2020a). The disease outbreak was first identified in Wuhan, China, in the month of December, 2019 (Hellewell et al. 2020; Lu et al. n.d..; Ma et al. 2020; Remuzzi and Remuzzi 2020; Xu et al. n.d.). In consecutive days, the disease spread rapidly in the nearby countries and rest of the world, which became a global human health degrade issue (Breslin et al. 2020; Chong et al. 2020; Her 2020; Lodigiani et al. 2020; Niu et al. 2020; Segars et al. 2020; Shahzad et al. 2020; Wu et al. 2020). As of 23rd Apr, 2020, a total of 25,44,792 confirmed cases of COVID-19 had been reported globally, including more than 21,700 cases in India, and more than 17,5,690 reported deaths though out the world (WHO 2020). As people with the COVID-19 infection arrived in India during these period (Chinazzi et al. 2020), potential control measures have been enforced within India to try to enclose the spread of the outbreak (WHO 2020) and to halt transmission. Isolation of infected and suspected patients along with the identification of contacts are the important aspects of control the outbreak, whereas it is still unclear that these efforts will achieve the control of COVID-19 transmission. Most of the patients have infected with SARS-CoV-2 have mild to no symptoms including fever, throat irritation, and dry cough (Cevik et al. 2020; Civil and Morettini 2020; Moghanibashi-mansourieh 2020). However, some of the patients have severe acute respiratory infections with incurable complications and ultimately it increases the mortal risk (Giacomelli et al. 2020; Wang et al. 2020).
Like that of influenza virus (SARS) cases, several studies have been conducted to analyze the significant factors affecting the droplets transmission of SARS-CoV-2. However, the exact source of the strain (SARS-CoV-2) has not been reported yet. It is considered that the transmission of virus from one human to another can occur through close contact with infected person. In addition, spread can be more viable with respiratory droplets while coughing and sneezing with in a range of 6-7 ft (Ghinai et al. 2020). To analyze the spread of the disease more, the impact of air pollutants and meteorological factors have been demonstrated to evaluate human-to-human contact, which could rise the risk of COVID-19 infections (Auler et al. 2020; Bashir et al. 2020; Briz-redón and Serrano-aroca 2020; Chan et al. 2020a). Besides, the droplet transmission from human to human, association of air pollutants, and meteorological parameters have shown significant correlations with COVID-19 infections (Fattorini and Regoli 2020; Frontera et al. 2020; Muhammad et al. 2020; Ogen 2020; Qi et al. 2020; Wang and Su 2020; Xie and Zhu 2020). The impact of air pollution in increasing number of COVID-19 cases lacks careful attention and research.
Previous researches have recommended that the ambient meteorological factors and air pollutants were acted as the risk factors for acute to severe respiratory infection by carrying fatal micro-pathogens and organisms. The micro-pollutants and pathogens affect the human body by decreasing the level of immunity and more vulnerable and prone towards the spread of SARS-CoV-2 (Cai et al. 2019; Hernandez et al. 2018; Pettersson et al. 2019).
In this manuscript, generalized additive model (GAM) is applied to explore the association between daily reported COVID-19-infected cases, and various factors including air pollutants and meteorological conditions in India (Gerling et al. 2020; Lin et al. 2018b; Ma et al. 2020; Prata et al. 2020; Ravindra et al. 2019). The objectives of the proposed study are (i) to investigate the consequences of air pollutants and meteorological factors on COVID-19 infections, (ii) to recommend useful significance and correlations to regulate and prevent the spread of the novel SARS-CoV-2 diseases, (iii) to correlate the and analyze the inter- and intra-relationship between four air pollutants, eight meteorological factors, and daily reported COVID-19-infected cases in eight most infected states having 288 districts in India by using generalized additive model (GAM).
Materials and methodology
Study area
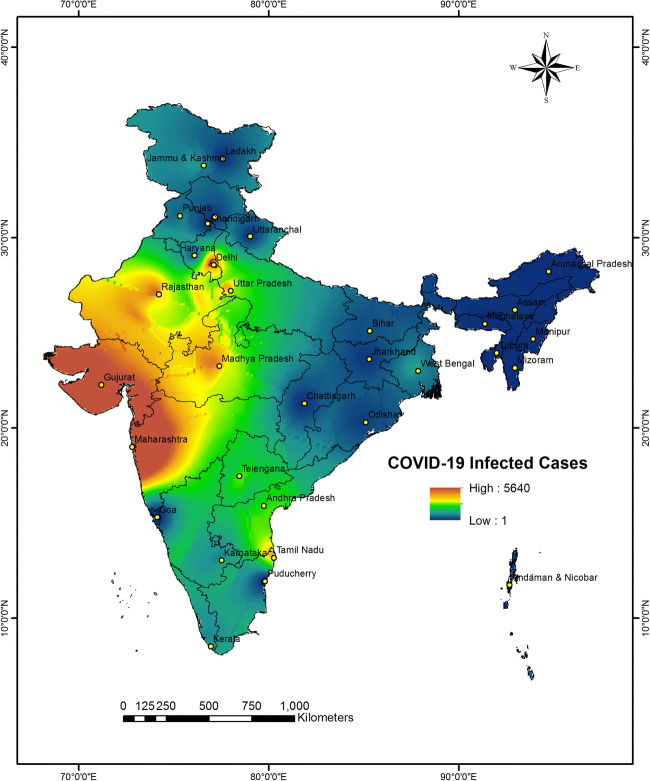
The proposed study considered 32 states and Union Territories of India having geographical location at north of the equator between 8° 4' north to 37° 6' north latitude and 68° 7' to 97° 25' east longitude as shown in Fig. 1. According to Ministry of Health and Family Welfare, Government of India, 21,700 COVID-19-infected cases have been reported in the whole of the country India as of April 23, 2020. The study included eight states with high COVID-19-infected cases covering around 65% of the total COVID-19 cases reported in the country. The analysis focused on 288 districts of the eight most COVID-19 affected States, Delhi, Uttar Pradesh, Maharashtra, Kerala, Karnataka, Telangana, Madhya Pradesh, and Tamil Nadu. The meteorological, air pollution, and consolidated COVID-19-infected cases data have collected for these eight selected States.
Fig. 1.
Locations of 32 states and union territories and cumulative COVID-19-infected cases in each state as of April 23, 2020
Data collection
Daily notified infected cases for the selected districts, states, and union territories between 30th Jan 2020 to 23rd Apr 2020 were collected from the reports updated by Ministry of Health and Family Welfare, Government of India.
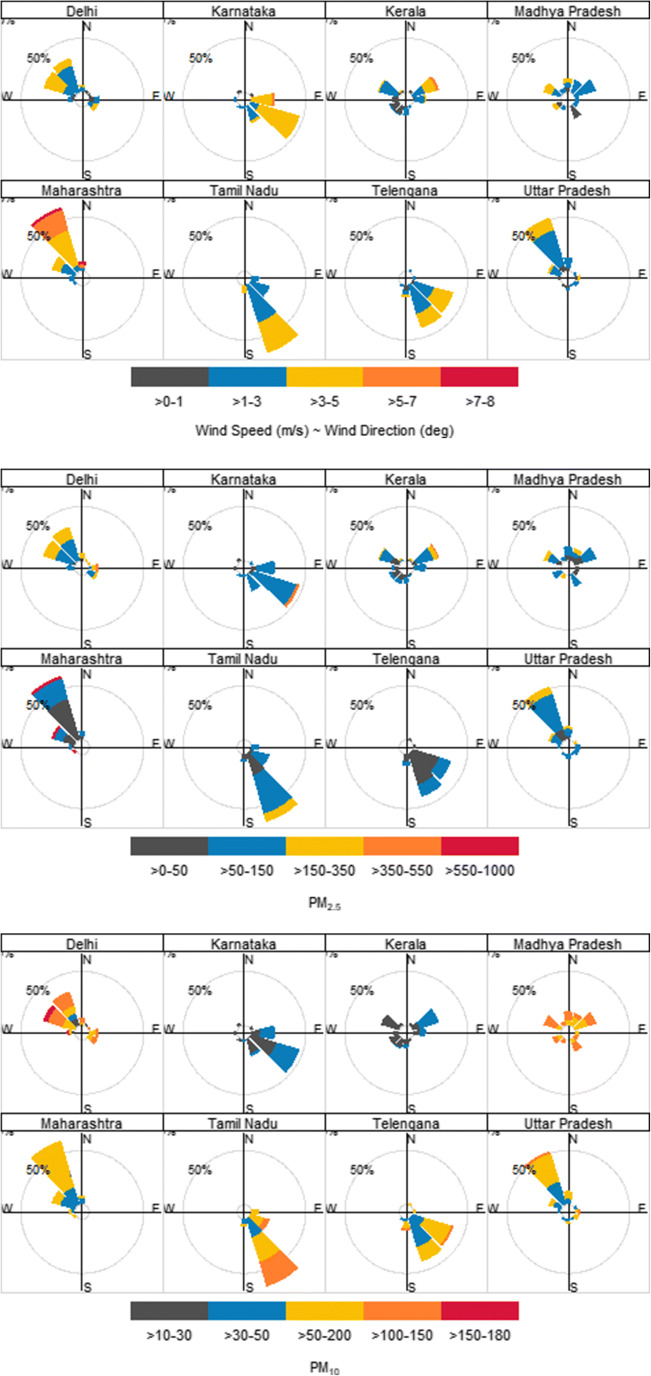
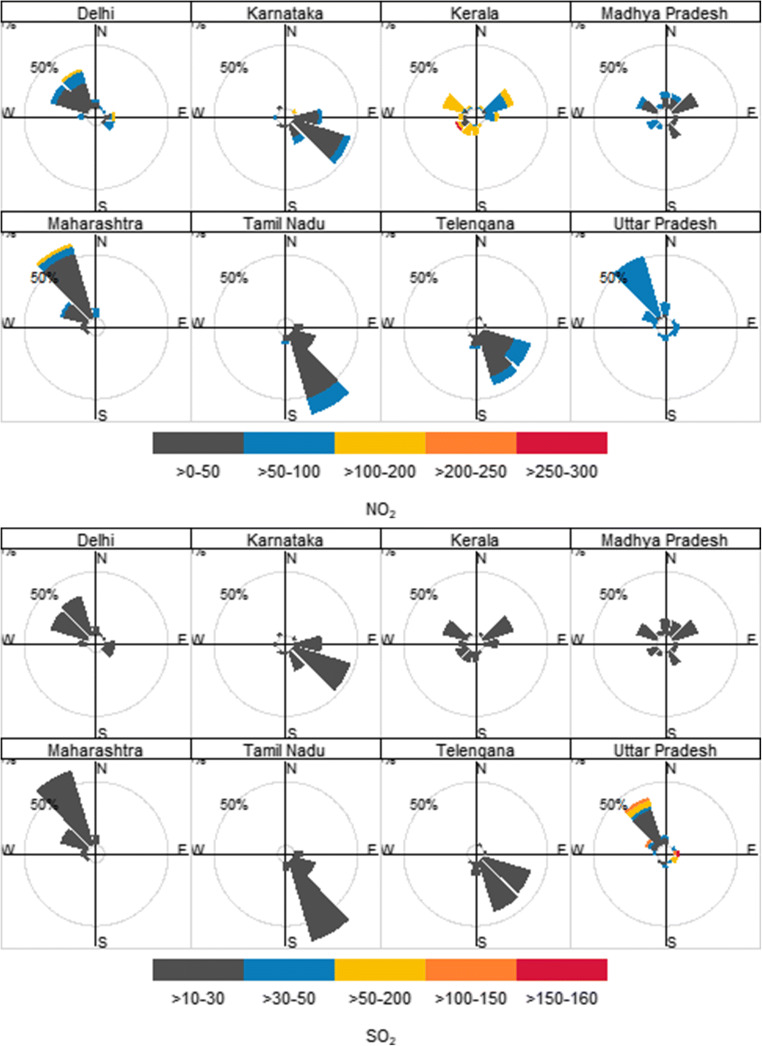
Air pollution data were collected from an online platform (www.openaq.org) monitoring daily and hourly data for air quality. The concentrations of four pollutants such as particulate matters with diameters ≤ 2.5 μm (PM2.5), particulate matters with diameters ≤ 10 μm (PM10), nitrogen dioxide (NO2), and sulfur dioxide (SO2) were extracted. The air pollutants’ concentration in eight states with respect to wind speed and wind direction was represented in Fig. 2.
Fig. 2.
The concentration of four air pollutants (PM2.5, PM10, NO2, and SO2) based on wind speed and wind direction over the eight states and union territories
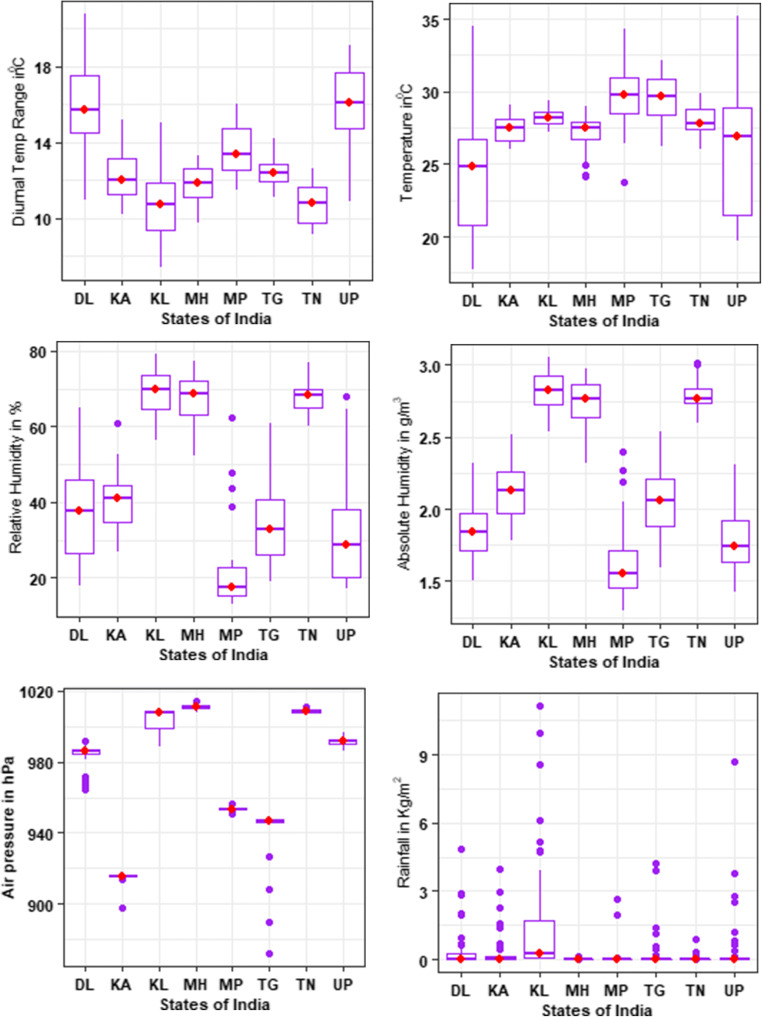
Meteorological data on daily diurnal temperature range (DTR), mean temperature, relative humidity (RH), absolute humidity (AH), air pressure (AP), Rainfall (RF), wind speed (WS), and wind direction (WD) were collected during the study period from Indian Meteorological Department (www.imdtvm.gov.in). The meteorological parameters except wind speed and wind direction were represented by box plots in Fig. 3 which depicted the maximum, minimum, 1st quartile, median, and 3rd quartile values.
Fig. 3.
Box plots for six meteorological parameters in eight states with maximum, minimum, 1st quartile, median, and 3rd quartile values. Note: name of states and UTs: DL: Delhi, KA: Karnataka, MH: Maharashtra, MP: Madhya Pradesh, TG: Telengana, TN: Tamil Nadu, and UP: Uttar Pradesh
Absolute humidity, relative humidity, and dry bulb temperature
Absolute humidity (AH, g/m3), which is considered as the mass of water in a unit volume of air, was estimated through dry bulb temperature, dew point temperature, and relative humidity using the derived equation with the assumptions of standard atmospheric pressure of the study area (Qi et al. 2020; Xu et al. 2014a).
The equation is derived as
where Tc = The dry bulb temperature, which is considered as the daily mean temperature for the study, and
where Td = the dew point temperature. Here, Td is calculated from the equation below considering dry bulb temperature and relative humidity. The equation is expressed as:
where , and . The 3-dimensional graphical representation of AH, Tc, and RH is shown in Fig. 4. Here, it can be observed that with lesser variation of the dry bulb temperature, the parametric values of RH and AH are increasing.
Fig. 4.
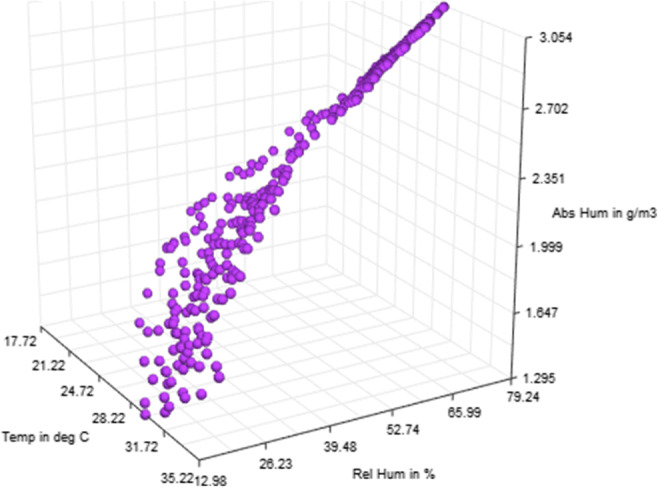
3D association of meteorological parameters, absolute humidity, relative humidity with daily mean temperature
Statistical analysis
Descriptive statistics were performed to obtain the statistical details of the environmental factors (absolute humidity, relative humidity, windspeed, air pressure, rainfall, daily mean temperature, and diurnal temperature range) at 24-h interval over the study period (Table 1). Spearman’s correlation analysis was performed to evaluate the correlations between the air pollutants, meteorological factors, and the number of infected cases due to COVID-19 (Table 2).
Table 1.
Daily pollutant parameters concentrations, meteorological parameters concentrations, and daily infected cases from COVID19 in India
| States | Air pollutants | Meteorological parameters | Infected cases | |||||||||
|---|---|---|---|---|---|---|---|---|---|---|---|---|
| PM2.5 | PM10 | NO2 | SO2 | Wind speed | Temp | Diurnal temp range | Absolute humidity | Relative humidity | Rainfall | Air pressure | COVID 19 | |
| Mean | ||||||||||||
| Delhi | 144.21 | 90.68 | 48.78 | 11.69 | 2.16 | 24.26 | 15.87 | 1.85 | 37.56 | 0.44 | 983.63 | 42.42 |
| Karnataka | 74.36 | 30.00 | 28.80 | 3.03 | 3.15 | 27.47 | 12.43 | 2.12 | 40.32 | 0.40 | 915.31 | 9.44 |
| Kerala | 80.09 | 27.37 | 99.09 | 7.07 | 1.82 | 28.24 | 10.64 | 2.83 | 68.93 | 1.38 | 1004.18 | 5.15 |
| MP | 75.31 | 113.21 | 31.62 | 18.44 | 2.03 | 29.65 | 13.61 | 1.64 | 22.79 | 0.20 | 953.57 | 48.24 |
| Maharastra | 128.58 | 54.74 | 31.32 | 4.03 | 4.07 | 27.13 | 11.76 | 2.72 | 67.51 | 0.00 | 1010.84 | 116.18 |
| Tamilnadu | 81.66 | 80.92 | 36.33 | 3.57 | 2.85 | 28.00 | 10.80 | 2.79 | 67.84 | 0.05 | 1008.75 | 33.94 |
| Telengana | 49.04 | 56.53 | 33.27 | 0.40 | 2.54 | 29.64 | 12.48 | 2.03 | 33.71 | 0.28 | 941.43 | 18.11 |
| UP | 95.95 | 53.60 | 61.30 | 32.11 | 1.98 | 26.02 | 15.91 | 1.78 | 32.22 | 0.52 | 991.76 | 28.24 |
| Std. Deviation | ||||||||||||
| Delhi | 76.86 | 41.66 | 28.61 | 8.30 | 1.07 | 4.24 | 2.51 | 0.17 | 11.80 | 1.01 | 7.28 | 72.37 |
| Karnataka | 55.68 | 6.48 | 22.26 | 3.17 | 1.18 | 0.85 | 1.50 | 0.18 | 8.03 | 0.92 | 3.11 | 9.62 |
| Kerala | 61.21 | 7.21 | 37.75 | 1.65 | 1.30 | 0.52 | 1.97 | 0.12 | 5.89 | 2.31 | 5.03 | 8.00 |
| MP | 50.65 | 19.40 | 22.85 | 6.26 | 0.96 | 2.39 | 1.44 | 0.30 | 12.63 | 0.65 | 1.17 | 65.11 |
| Maharastra | 253.49 | 11.69 | 31.14 | 0.39 | 1.52 | 1.22 | 1.00 | 0.18 | 6.01 | 0.02 | 1.36 | 155.18 |
| Tamilnadu | 66.32 | 29.85 | 12.13 | 2.36 | 0.72 | 0.96 | 1.04 | 0.11 | 3.94 | 0.15 | 1.00 | 40.52 |
| Telengana | 16.97 | 21.24 | 21.11 | 0.00 | 1.00 | 1.55 | 0.75 | 0.23 | 10.01 | 0.89 | 17.44 | 24.17 |
| UP | 42.81 | 18.71 | 7.36 | 41.46 | 0.93 | 4.17 | 2.18 | 0.22 | 13.36 | 1.55 | 2.21 | 42.66 |
| Interquartile Range | ||||||||||||
| Delhi | 103.00 | 59.80 | 48.00 | 17.06 | 1.93 | 6.56 | 3.35 | 0.26 | 21.80 | 0.24 | 3.12 | 63.50 |
| Karnataka | 22.42 | 9.12 | 37.28 | 2.39 | 1.81 | 1.54 | 1.98 | 0.29 | 10.30 | 0.12 | 1.00 | 15.50 |
| Kerala | 58.50 | 8.00 | 33.30 | 2.40 | 1.59 | 0.79 | 2.47 | 0.21 | 8.92 | 1.87 | 9.33 | 8.50 |
| MP | 52.75 | 38.50 | 44.76 | 11.88 | 1.56 | 2.89 | 2.62 | 0.29 | 8.93 | 0.04 | 1.31 | 62.00 |
| Maharastra | 41.25 | 14.00 | 34.09 | 0.51 | 2.34 | 1.21 | 1.58 | 0.23 | 9.25 | 0.00 | 1.60 | 212.50 |
| Tamilnadu | 45.73 | 57.63 | 12.73 | 2.19 | 1.14 | 1.45 | 1.98 | 0.11 | 5.76 | 0.00 | 1.31 | 66.25 |
| Telengana | 18.62 | 21.36 | 32.90 | 0.00 | 1.29 | 2.56 | 0.99 | 0.34 | 15.32 | 0.00 | 1.60 | 31.00 |
| UP | 51.50 | 14.52 | 13.06 | 38.25 | 1.39 | 7.53 | 3.09 | 0.30 | 18.24 | 0.10 | 9.82 | 40.75 |
Table 2.
Spearman’s correlation coefficients between air pollutants, meteorological factors across all districts during the study period
| Parameters | Infected cases | PM2.5 | PM10 | NO2 | SO2 | Wind speed | Temperature | DTR | Relative humidity | Air pressure | Rainfall | Absolute humidity |
|---|---|---|---|---|---|---|---|---|---|---|---|---|
| Infected Cases | 1 | |||||||||||
| PM2.5 | 0.23* | 1 | ||||||||||
| PM10 | 0.33* | 0.87* | 1 | |||||||||
| NO2 | 0.21* | 0.59* | 0.58* | 1 | ||||||||
| SO2 | -0.26* | 0.32* | 0.34* | 0.47* | 1 | |||||||
| Wind Speed | 0.02* | -0.22* | -0.16* | -0.13* | -0.03* | 1 | ||||||
| Temperature | 0.22* | 0.30* | 0.33* | -0.13* | 0.22* | -0.03 | 1 | |||||
| DTR | 0.27* | 0.42* | 0.46* | 0.24* | 0.33* | 0.19 | -0.12* | 1 | ||||
| Relative Humidity | -0.28* | -0.33* | -0.41* | -0.36* | -0.47* | 0.01 | -0.09* | 0.19 | 1 | |||
| Air Pressure | 0.03* | 0.08* | 0.06* | 0.25* | -0.19* | 0.02 | 0.15* | 0.15 | 0.73* | 1 | ||
| Rainfall | -0.13* | 0.01* | 0.03* | 0.41* | 0.05* | -0.33* | -0.08 | 0.18 | 0.40* | 0.08 | 1 | |
| Absolute Humidity | -0.02* | 0.21* | 0.27* | 0.22* | 0.12* | 0.03 | -0.01 | 0.57* | 0.96* | 0.67* | 0.38* | 1 |
Generalized additive model (GAM)
The generalized additive model (GAM) was applied to correlate the daily infected counts, air pollutants, and meteorological parameters (Liu et al. 2019a; Prata et al. 2020; Xiao et al. 2019; Xie and Zhu 2020). The model is an effective approach to determine the effects of air pollutants concentration and change of meteorological factors on health of a human being during the lag period of infection (Hu et al. 2020; Lin et al. 2018a; Ma et al. 2020; Pearce et al. 2011; Ravindra et al. 2019). As per previous studies, air pollution can be the combination of different gases and particulate matters. Both the short term- and long-term exposure to air pollutants can lead to a variety of health problems such as asthma or chronic obstructive pulmonary diseases (COPD) or can cause persistent wheezing or coughing. These studies suggested that the effect of high concentration air pollutants may last for days or week (Cirera et al. 2012; Glick et al. 2019; Hendryx et al. 2019; Hu et al. 2020; Huang et al. 2017; Van Kersen et al. 2020; Peng et al. 2019; Su et al. 2019). Qi et al. 2019 recommended that the meteorological parameters have significant effects on dispersion, dilution, and diffusion of air pollutants which ultimately affect the distribution, condensation, and concentration of pollutants (Keshavarzian et al. 2020; Lim et al. 2020; Liu et al. 2019a; Saha et al. 2018; Tiwari and Kumar 2020; Yang et al. 2020a; Yang et al. 2020c). However, there is an incubation period of 5 to 14 days to show the symptoms of COVID-19 infections as reported by the World Health Organisation and Indian Council of Medical Research (Report 2020). Following the same, moving average approach was applied to determine the cumulative lag effect of air pollutants and their association with meteorological factors (Kim et al. 2019; Qiu et al. 2020; Rojas-roa and Rodríguez-villamizar 2019; Zhang et al. 2019b; Zhang et al. 2020; Zhu et al. 2018, 2019). Focusing on previous studies and findings, generalized additive model (GAM) with Gaussian distribution was utilized to connect the infected rate due to COVID-19 and air pollutants or meteorological parameters (Chuang et al. 2011; Gao et al. 2019; Ravindra et al. 2019; Sun et al. 2015; Tong et al. 2018; Yoon 2019; Zhang and Batterman 2010). The model was also applied to estimate the correlations between moving average concentrations of air pollutants and meteorological factors at Lag0-7, Lag0-14, and Lag0-21 with daily reported COVID-19-infected cases in India (Charles et al. 2020; Ge et al. 2017; Hao et al. 2019; Liang et al. 2020a; Lin et al. 2013; Yang et al. 2020b).
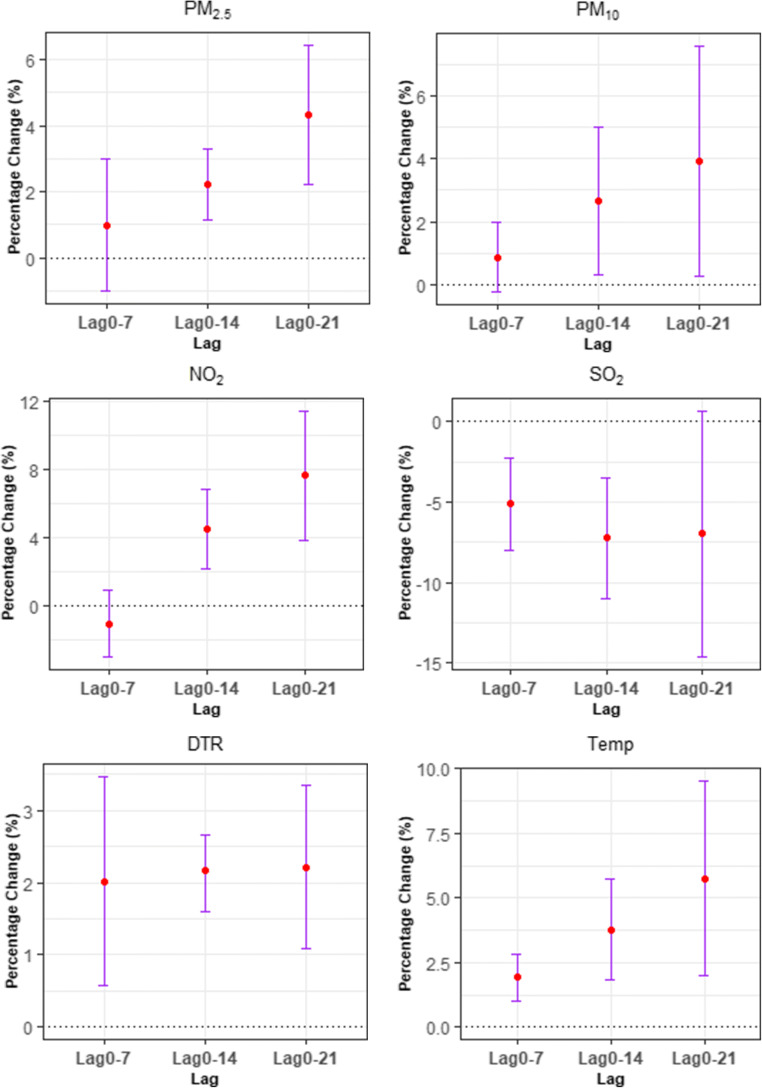
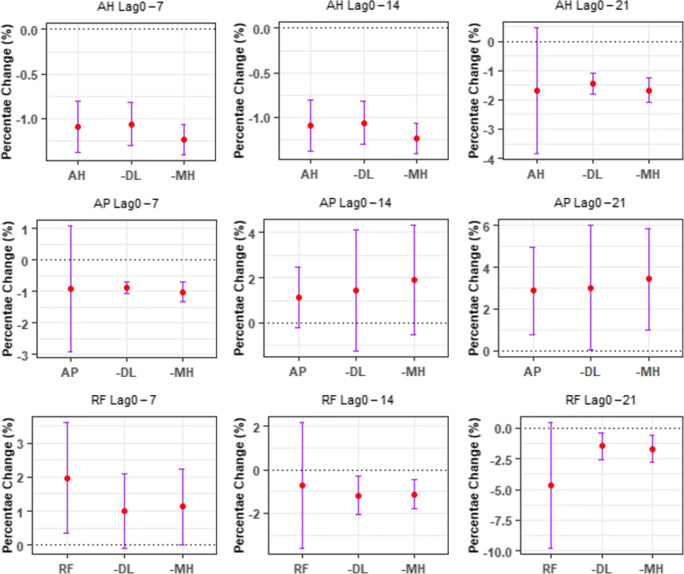
The effects of four considered air pollutants (PM2.5, PM10, NO2, and SO2) and six meteorological factors (daily mean temperature, DTR, air pressure, relative humidity, absolute humidity, and rainfall) were examined in ten separate single pollutant or meteorological model (Fig. 5) to decrease collinearity or consecutiveness as some considered pollutants or factors were remarkably correlated (Dastoorpoor et al. 2019).
Fig. 5.
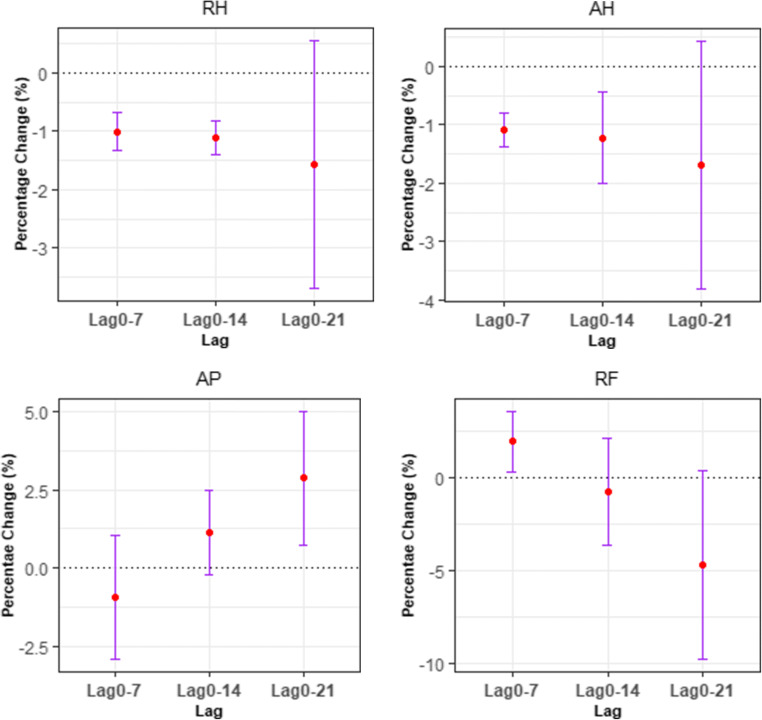
Percentage change (%) and 95% CI of daily infected COVID-19 cases correlated with a unit increase in air pollutant and meteorological concentration using single-parameter models. Note: 10 μg/m3 increase in PM2.5, PM10, NO2, and SO2 and 1 unit increase in meteorological factors (DTR: diurnal temp range, Temp: daily mean temperature, RH: relative humidity, AH: absolute humidity, AP: air pressure, RF: rainfall)
The GAM model was constructed as follows:
where log(pit) was defined the log-transformed daily infected COVID 19 counts reported on any day, t in any of the district i. To avoid considering the logarithm of 0, 1 was added in the lis. α is the intercept. Qi, d depicts the linear definite term of (d + 1) day moving average concentration of air pollutants and meteorological factor lag(0 − d) in the district i (Borge et al. 2019; Li 2017; Liang et al. 2020b; Vidale et al. 2017; Wei et al. 2020). log(pi, d − 1) was defined as the log-transformed COVID 19-infected cases reported on day (d − 1) in the district, i to determine the possible sequential correlation in the collected data (Liu et al. 2020c; Xie and Zhu 2020). In addition, contemplating the less correlated meteorological factors during the study period were regulated for the potential cofounding effect, which included the meteorological factors such as, mean temperature (tempid), diurnal temperature range (DTRid), rainfall (rainfid), relative humidity (rhumid), air pressure (apresid) absolute humidity (ahumid), and wind speed (winsid). s(.) refers to the natural smoothing function characterized by natural spline with 3 degrees of freedom (df) for meteorological variation to accommodate the daily analysis and trends for the study. Along with air pollutants and meteorological factors, time factor (timei) is added to include the district steady effects to regulate the characteristics such as demographic variation and density, day steady effects (day)t focusing on time of the day is considered to control uncertain parameters influencing the districts each day before, during and after lockdown (Chen et al. 2019, 2020; Lin et al. 2018a; Liu et al. 2019b; Tian et al. 2020; Yáñez et al. 2017).
Sensitivity analysis
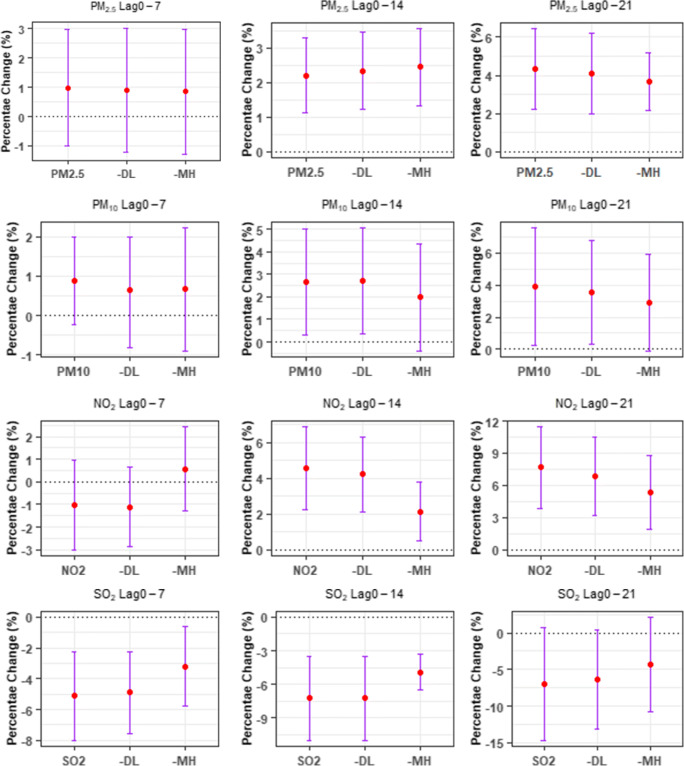
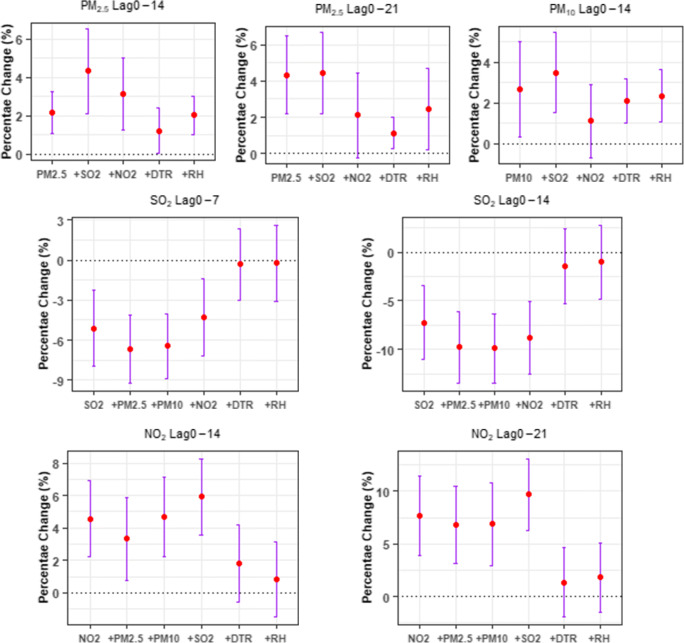
Sensitivity analyses were supervised to investigate the robustness of the proposed models. To conduct the sensitivity analysis, the state, Maharashtra with 36 districts, and the Union territory, Delhi with 11 districts were excluded from the analysis as the state Maharashtra has highest number of COVID-19-infected cases till the study period. The union territory, Delhi, was excluded to avoid the entry of foreign infected and suspected nationals through the International airport at Delhi which acted as a connecting link between the COVID-19-infected countries. In other hand, multi-parameter models were designed to differentiate the robustness between single parameter model and multi-parameter model, when supervising the pollutants in the basic constructed model (Figs. 5 and 6) (Baccini et al. 2007; Chen et al. 2018; Phosri et al. 2019; Yang et al. 2015; Zhao et al. 2012).
Fig. 6.
Percentage change (%) and 95% CI of daily infected COVID-19 cases correlated with a unit increase in air pollutants using single-parameter models after excluding Delhi and Maharashtra from the analysis. Note: 10 μg/m3 increase in PM2.5, PM10, NO2, and SO2, MH: the state, Maharashtra, DL: The union territory, Delhi
The hypothesis tests were conducted for the study were two tailed with a significance level of 0.05. The effects of air pollutants and meteorological factors were represented as percentage change (%) and corresponding 95% confidence intervals (Cis) of daily mean infected cases due to COVID-19 per unit increase in considered air pollutants concentration (i.e., 10.0 μg/m3 increase in PM2.5, PM10, NO2 and SO2) and meteorological factors (1 unit increase in daily mean temperature, diurnal temperature range, relative humidity, absolute humidity, air pressure, rainfall).
Results and discussion
Statistical representation of meteorological factors, air pollutants, and infected cases due to COVID-19
Descriptive statistics are represented in Table 1 from 30th Jan 2020 to 23rd Apr 2020 for the air pollutants such as PM2.5, PM10, NO2, and SO2; meteorological parameters such as daily mean temperature, DTR, wind speed, rainfall, relative humidity, absolute humidity, air pressure, and COVID-19-infected cases for the first reported place, Kerala and seven in seven other states such as Delhi, Karnataka, Madhya Pradesh, Maharashtra, Tamil Nadu, Telangana, and Uttar Pradesh.
During the study period, the 24-h weighted average concentrations, SD, IQR of the pollutant parameters, PM2.5, PM10, NO2, and SO2 were represented in Table 1, the concentrations of PM2.5 and PM10 were found to be high in concentration in the seven selected states out of eight whereas the values of NO2 and SO2 were with lesser concentration in seven states out of eight as per National Air Quality Standards, India (The limits for PM2.5, PM10, NO2, and SO2 were up to 60.0 μg/m3, 100 μg/m3, 80.0 μg/m3, and 80.0 μg/m3 at Industrial area, Residential area, rural, and other ecologically sensitive areas) (MoEF 2010; As 2010). Average temperature was around 28°C ranging from 24.26 to 29.65 °C, and the average relative humidity was approximately 47% varying from 32.22 to 68.93% during the period, showing a sub-humid, warm and arrival of summer climate for the considered stations, whereas the average wind speed ranged from 1.82 to 4.07 m/s.
In India, a total of 21,700 infected cases and 720 deaths occurred due to COVID-19, with an average daily average mortality rate of 3.3% within the study period.
The daily inter quartile range (IQR) for the air pollutant parameters PM2.5, PM10, NO2° and SO2 ranges from 18.62 to 103 μg/m3, 8.0 to 59.80 μg/m3, 12.73 to 48.00 μg/m3, and 0.00 to 38.25 μg/m3 respectively with the highest concentrations at Delhi in the case of PM2.5, PM10° and NO2. However, the highest number of infected and death cases was reported in the State of Maharashtra during the period of analysis.
Table 2 represented the Spearman’s correlation coefficients between air pollution parameters, meteorological indicators, and COVID-19-infected cases during the study period. The air pollutants PM2.5, PM10, and NO2 and the meteorological factors such as wind speed, daily mean temperature, DTR, and air pressure had significant positive associations with the infected cases due to COVID-19. The air pollutant, SO2 and meteorological factors, relative humidity, rainfall, and absolute humidity had negative correlation with infected cases of COVID-19. In other hand, the air pollutants (PM2.5, PM10, NO2, and SO2) had a significant correlation with each other and the pollutants had positive correlations with DTR, air pressure, absolute humidity and rainfall. The parameters such as wind speed, temperature, and relative humidity were negatively correlated with the air pollutant parameters.
Lag analysis of air pollutants, meteorological indicators in relation to COVID19 confirmed cases
The moving average lag effects considering single-parameter model with pollutants or meteorological factors were calculated for the above extracted parameters which were correlated with COVID-19-infected cases. The lag effects (Lag0-7, Lag0-14, Lag0-21) of air pollutants and meteorological factors on daily report of COVID-19 confirmed cases were represented in Fig. 5. Significant positive correlations were observed for the air pollutants, PM2.5, PM10, and NO2 and meteorological factors, daily mean temperature and DTR with COVID-19-infected cases, whereas significant negative correlations were observed for air pollutant, SO2, and meteorological factor, relative humidity. As per the analysis, a 10 μg/m3 increase during (Lag0-14) in PM2.5, PM10 and NO2 was resulted in 2.21% (95%CI: 1.13 to 3.29), 2.67% (95% CI: 0.33 to 5.01) and 4.56 (95% CI: 2.22 to 6.90) increase in daily counts of COVID-19-infected cases respectively. However, only 1 unit increase in meteorological factor levels in case of Temperature and 1 unit increase of DTR during (Lag0-14) associated with 3.78% (95%CI: 1.81 to 5.75) and 2.17% (95% CI: 1.59 to 2.66) rise of COVID-19-infected cases respectively. On other way, other meteorological parameters such as relative humidity, rainfall and absolute humidity were negatively correlated with COVID-19-infected cases as represented in Table 2 and Fig. 5. The air pollutant, SO2 and meteorological factor, relative humidity was negative associated with COVID 19-infected cases at
Lag0-7: -5.12% (95% CI: -7.99 to -2.2523) and Lag0-14: -7.23% (95% CI: -10.99 to -3.47) for SO2 and at
Lag0-7: -1.01% (95% CI: -1.34 to -0.68) and Lag0-14: -1.12% (95% CI: -1.41 to -0.83) for relative humidity.
Sensitivity analysis
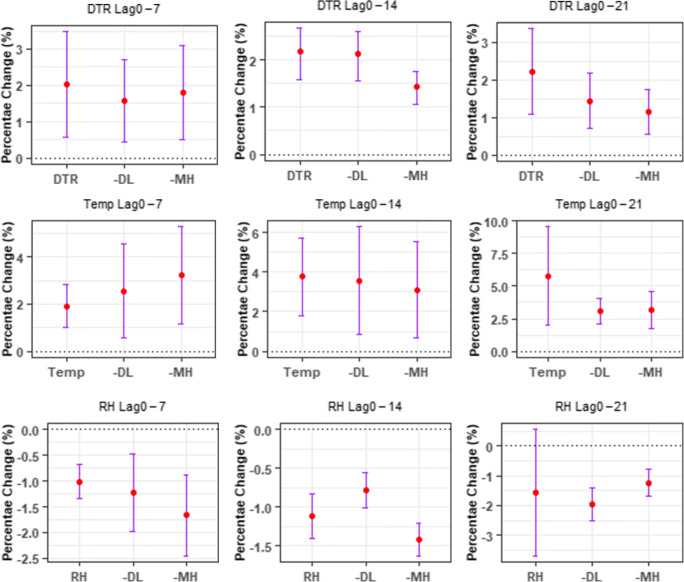
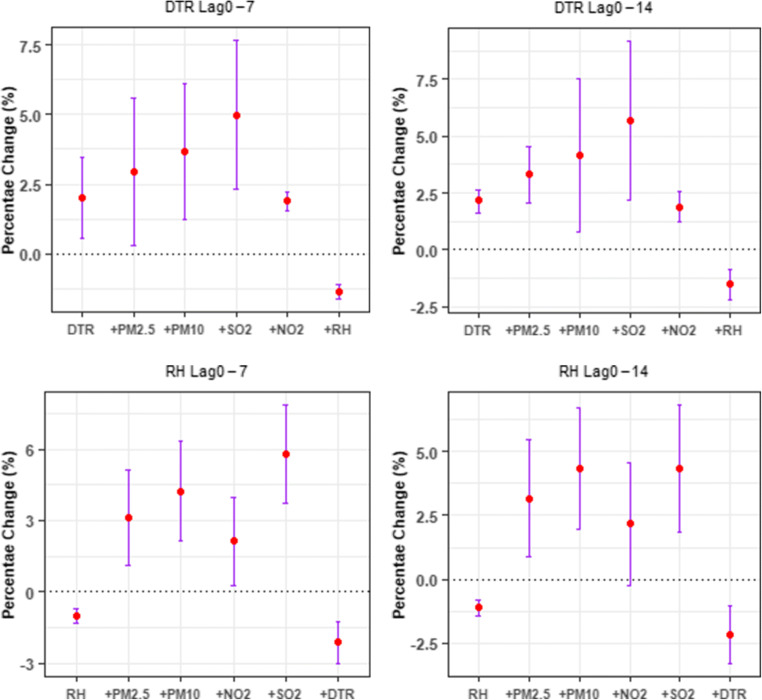
The relationships between COVID-19-infected cases and all considered parameters were robust in case of sensitivity analysis as shown in Figs. 6 and 7 when the city Delhi and State Maharashtra were excluded from the data set. Limited fluctuations were observed in the sensitivity analysis considering air pollutants when the city Delhi was excluded from the study, which was examined as the centroid of SARS-CoV-2 transmission in India, whereas there were very less to considerable variations when the state Maharashtra was excluded from the data set, which had the highest number of daily reported COVID-19-infected cases. The multi-parameter models were represented in Fig. 8 (for air pollutants and meteorological factors). The air pollutants, PM2.5 and PM10, were formed as multi-parameter model to check the affects the COVID-19-infected cases and was insignificant when effects of NO2 was restricted. Similarly, for SO2, the multi-parameter model was insignificant after adding NO2 but more variation was shown when DTR or relative humidity were added into the multi-parameter model. Similarly, for NO2, the estimation of responses due to COVID-19-infected cases was transformed to be robust when the meteorological parameter, DTR, or relative humidity was added in the multi-parameter model. In other hand, the effect of model estimation did not change much after the addition of SO2 or meteorological factors. Subsequently, when controlling for the meteorological parameters, DTR or RH, the association cases could not remain significant after adding the air pollutants (Chan et al. 2020b).
Fig. 7.
Percentage change (%) and 95% CI of daily infected COVID-19 cases correlated with a unit increase in meteorological concentration using single-parameter models after excluding Delhi and Maharashtra from the analysis. Note: 1 unit increase in meteorological factors (DTR: diurnal temp range, temp: daily mean temperature, RH: relative humidity, AH: absolute humidity, AP: air pressure, RF: rainfall), MH: the state, Maharashtra, DL: The union territory, Delhi
Fig. 8.
Percentage change (%) and 95% CI of daily infected COVID-19 cases correlated with a unit increase in air pollutant and meteorological concentration using single and multi-parameter models. Note: 10 μg/m3 increase in PM2.5, PM10, NO2, and SO2 and 1 unit increase in meteorological factors (DTR: diurnal temp range, RH: relative humidity)
Discussion
To find out the correlation between daily reported COVID-19-infected cases and air pollutants concentration at variations of meteorological factors, GAM (generalized additive model) was applied for the proposed study. As per Fig. 5, Fig.6, there are positive and significant correlations of air pollutants, PM2.5 (at L0-14 and at L0-21), PM10 (at L0-14 and at L0-21), NO2 (at L0-14 and at L0-21) and SO2 (at L0-7 and at L0-14) with COVID-19-infected cases. On the other hand, the meteorological factors represent both positive (for DTR, Temp, RF, and AP) and negative (for RH and AH) significant correlations such as, DTR (at L0-7, at L0-14 and L0-21), temperature (at L0-7, at L0-14 and L0-21), RF (at L0-7), AP (at L0-21), RH (at L0-7 and at L0-14), and AH (at L0-7 and L0-14) with COVID-19-infected cases (Fig. 7). However, following the Table 2, the air pollutants such as PM2.5, PM10, NO2, and SO2 are having the Spearman’s correlation coefficient values of 0.23, 0.23, 0.21, and -0.26 respectively with COVID-19-infected cases. Similarly, the meteorological factors such as temperature, DTR, and RH are having coefficients of 0.22, 0.27, and -0.28 respectively with COVID-19-infected cases. The parameters with lesser coefficient values are not considered for the further analysis, whereas DTR is considered for the further analysis with higher value of correlation coefficient than that of temperature as a meteorological factor. Considering the above results and discussion, multi-parameter GAM model is designed with the air pollutant parameters and meteorological parameters such as PM2.5 (at L0-14 and L0-21) PM10 (at L0-14 and at L0-21) NO2 (at L0-14 and at L0-21), SO2 (at L0-7 and at L0-14), DTR (at L0-7 and L0-14), and RH (at L0-7 and L0-14) (Fig. 8). These findings may suggest some evidences that air pollutants at meteorological variations act as important risk factors for infection in COVID-19 (Fig. 8).
The respiratory infection and pneumonia caused by microorganisms are driven by air pollutants and are closely interrelated with air pollution as per recent evidences (Hachem et al. 2019; Kim et al. 2018; Rojas-roa and Rodríguez-villamizar 2019; Thi et al. 2019a; Thi et al. 2019b; Zhang et al. 2019b). It has been reported that severe cases of COVID-19 infection lead to lungs infection, pneumonia, severe acute respiratory syndrome, body aches, kidney failure, and death (Zhao et al. 2020). Most of air quality studies reported that short-term exposure to particulate matter, PM2.5 can be related to acute lower respiratory infection (Bates et al. 2018; Li et al. 2020; Liu et al. 2020a; Martins and Carrilho 2020; Tan et al. 2019; Wu 2019). However, not only PM2.5, but PM10 was also found to have a significant relation with hospitalization due to the respiratory illness and pneumonia (Cheng et al. 2020; Chew et al. 2020; Ge et al. 2018; Liu et al. 2020b; Luong et al. 2016; Mäkelä et al. 2019; Nephew et al. 2020; Pun et al. 2017; De Rooij et al. 2019; Zhang et al. 2019a). Similarly, several studies had been conducted to find the association of air pollutants such as NO2, SO2, and other particulate matters with the increased risk of respiratory infections and mortality rates (Ã et al. 2005; Ashikin et al. 2014; Galy-lacaux et al. 2016; Lau et al. 2020; Mason et al. 2019; Pan et al. 2010; Sahoo et al. 2017; Wang and Su 2020; Yang et al. 2020b). However, it had been concluded from several researches that exposure to critical air pollutants such as PM2.5, NO2, and SO2 were harmful to human health and led to persistent and increased risk of respiratory illness (Chen et al. 2019, 2020; Dastoorpoor et al. 2019; Gao et al. 2019; Hu et al. 2020; Liu et al. 2020b; Naclerio et al. 2020; Oh et al. 2020; Sangkharat et al. 2019; Thi et al. 2018; Yao et al. 2020). Alternatively, it can be said that all the four air pollutant parameters considered for the study are harmful and can be considered as the risk factors for respiratory diseases and death (Çapraz et al. 2017; Liu et al. 2016, 2017; Zhao et al. 2017). In addition, there had been a series of researches suggested that the association between infectious diseases and air pollution particularly by NO2. These studies investigated that the increased level of NO2 up to 70 μg/m3 caused the incidence of croup due to influenza virus (Chauhan and Johnston 2003; Coccia 2020; Hao et al. 2019; Xu et al. 2013). However, as per the proposed study, SO2 had a negative correlation with COVID-19-infected cases, which may be the possible reason of low wind frequency and slow dispersion of SO2 along west-south-west and north-west directional winds across the most COVID-19 affected states such as Delhi, Gujrat, Maharashtra (Cuesta-mosquera et al. 2020; Cuhadaroglu and Demirci 1997; Mallik et al. 2019; Sangeetha and Sivakumar 2019).
As per Table 2, the Spearman’s correlation analysis examined positive associations with DTR, air pressure, absolute humidity, and rainfall with air pollutants concentration, whereas the study demonstrated negative association of wind Speed, daily mean temperature, and relative humidity with COVID-19-infected cases (Lee et al. 2019; Liu et al. 2020b; Xie et al. 2016; Zhen et al. 2017), whereas, some previous studies have reported that the mortality rate due to respiratory diseases increased with low temperature (Lin et al. 2013; Wang et al. 2007). However, some other studies have suggested that both high and low temperature might show the health effects on respiratory tracts and pneumonia mortality (Bachur et al. 2019; Brendish et al. 2019; Miao et al. 2017; Tian et al. 2020; Xu et al. 2014b; Zhen et al. 2017). Liang et al. 2009 found that the relationship between DTR and emergency room admissions in hospitals for chronic obstructive pulmonary diseases in Taiwan. The study suggested a significant negative correlation with daily average temperature and a strong positive correlation between DTR and rate of pulmonary diseases reported (Van Kersen et al. 2020; Peng et al. 2019; Yin et al. 2019). In another study, it was concluded that the risk of incidence of respiratory syncytial virus increased by 3.30% with every 1°C increase of DTR (Onozuka 2020).
As per Lowen and Steel 2014, the transmission of virus was found to be dependent on both daily mean temperature and relative humidity. The study found that the transmission rate was high at low temperature and was blocked or very low to inefficient at temperatures equivalent to room temperature. However, in case of relative humidity, average outdoor relative humidity is higher in winter than in summer, which excluded the outdoor relative humidity as a possible reason of virus transmission. In other hand, when indoor humidity is lowest during winter months and exposure to cold air outside or dry air inside during colder or flu months increase the transmission rate of virus (Lowen and Steel 2014; Steel et al. 2011) . Gralton et al. 2011 suggested that the association between aerosolized viruses and relative humidity might be a probable combination of elementary properties of virus and can cause interaction among virus, solutes, and water molecules. Relative humidity is a function of ambient temperature which determined the saturation vapour pressure of water (Herfst et al. 2017; Marr et al. 2019).
Similarly, some other study suggested that the seasonality of the influenza epidemic was linked to meteorological factors such as decreasing level of ambient humidity and temperature. Exposure to low humidity led to impaired function of trachea, and tissue repair mechanism of airway epithelial cells resulted in susceptible to virus spread and faster lethality (Kudo et al. 2019).
Consistent with these mentioned reviews, the results of the proposed study indicated that the risk of COVID-19-infected cases increases with decreased relative humidity in colder months as per the previous and proposed studies (Figs. 5, 6, 7, and 8). In addition, the study suggested some hypothesis for the prevention and spread of COVID-19. The environmental scientists and pollution management team should focus on the regions with high air pollutants concentration ranges. The regions affected more with pollution might be the regions to suffer more with COVID-19 epidemic. In other words, decreased level of air pollutants excluding SO2 could be an effective way to prevent infections caused by COVID-19.
Furthermore, researches are still needed to focus on effects of outdoor as well as indoor air pollution on virus diseases and infections. The reviews and present analysis suggested the challenges for the epidemiologists and clinical scientists must go beyond the short-term triggering cause and evidences regarding the susceptibility to air pollutants in relation to viral Infections (SARS-CoV-2) and mortality. The mechanisms by which temperature and humidity effected the infection rate due to COVID-19 remain unclear but may combine multiple consequences at the level of the host, the lag effects on virus and the respiratory droplets. There is another gap in the research that the data in the proposed study had not included gender or age specific confirmed cases due to COVID-19 because of which the sub group analyses were not investigated. In addition, the study had not related other countries cities and states. Future researches are needed to overcome the research gap and limitations.
Conclusions
The proposed study suggested that there was significant (both positive and negative) correlation between air pollutants, meteorological factors, and daily reported COVID-19-infected cases in India. However, it can be said that short-term exposure to condensed and higher concentrations air pollutants such as PM2.5, PM10, and NO2 increase the level of risk for COVID-19 infections. In addition, as per results and discussion, the meteorological factors such as diurnal temperature range and relative humidity effected the daily infected cases. There was positive association between diurnal temperature range and COVID-19-infected cases but negatively correlated with relative humidity and absolute humidity. On other hand, the study suggested that the exposure to high concentration of SO2 may not be related to COVID-19-infected cases and its increased risk. However, laboratory studies and a comfortable environment are needed for the basic elementary exploration about the disease mechanisms and the patient’s responses toward the infection caused by SARS-CoV-2.
Author contribution
Mrunmayee Manjari Sahoo: Sole Author, Data collection, analysis and paper writing.
Data availability
The details and the sources of the data are mentioned with in the manuscripts.
Declarations
Ethics approval
Not applicable
Consent for publication
Not applicable
Conflict of interest
The authors declare that they have no conflict of interest.
Footnotes
Capsule: The study concludes the significant relationship between air pollutants and meteorological factors with COVID-19-infected cases, which can substantially explain the effect of national lockdown and recommended positive implications for control and prevention of the spread of SARS-CoV-2 disease.
Highlights
• Significant correlation ship was found between air pollutants and COVID-19 infections after control measures.
• Association of meteorological factors with increased risk of COVI-19 cases are clear.
• Positive correlations of PM2.5, PM10, NO2, and DTR with COVID-19-infected cases were found.
• SO2 showed a significant negative correlation with daily reported COVID-19-infected cases.
Publisher’s note
Springer Nature remains neutral with regard to jurisdictional claims in published maps and institutional affiliations.
References
- Ã JSP, Kumar R, Devotta S (2005) Health risks of NO 2 , SPM and SO 2 in Delhi ( India ). 39:6868–6874. 10.1016/j.atmosenv.2005.08.004
- As A (2010) Revised National Ambient Air Quality Standards. 826:1–18
- Ashikin N, Mabahwi B, Ling O, Leh H, Omar D. Human Health and Wellbeing : Human health effect of air pollution. Procedia Soc Behav Sci. 2014;153:221–229. doi: 10.1016/j.sbspro.2014.10.056. [DOI] [Google Scholar]
- Auler AC, Cássaro FAM, Silva VO, Pires LF. Jo ur l P of. Sci Total Environ. 2020;139090:139090. doi: 10.1016/j.scitotenv.2020.139090. [DOI] [PMC free article] [PubMed] [Google Scholar]
- Baccini M, Biggeri A, Lagazio C (2007) Parametric and semi-parametric approaches in the analysis of short-term effects of air pollution on health. 51:4324–4336. 10.1016/j.csda.2006.05.026
- Bachur RG, Michelson KA, Neuman MI, Monuteaux MC. Temperature-Adjusted Respiratory Rate for the Prediction of Childhood Pneumonia. Acad Pediatr. 2019;19:542–548. doi: 10.1016/j.acap.2018.11.015. [DOI] [PubMed] [Google Scholar]
- Bashir MF, Ma B, Bilal KB, Bashir MA, Tan D, Bashir M. Correlation between climate indicators and COVID-19 pandemic in New York. USA Sci Total Environ. 2020;728:138835. doi: 10.1016/j.scitotenv.2020.138835. [DOI] [PMC free article] [PubMed] [Google Scholar]
- Bates MN, Pokhrel AK, Chandyo RK, Valentiner-branth P, Mathisen M, Basnet S, Strand TA, Burnett RT, Smith KR. Kitchen PM2.5 concentrations and child acute lower respiratory infection in Bhaktapur, Nepal: The importance of fuel type. Environ Res. 2018;161:546–553. doi: 10.1016/j.envres.2017.11.056. [DOI] [PubMed] [Google Scholar]
- Borge R, Requia WJ, Yagüe C, Jhun I, Koutrakis P. Impact of weather changes on air quality and related mortality in Spain over a 25 year period [ 1993 – 2017 ] Environ Int. 2019;133:105272. doi: 10.1016/j.envint.2019.105272. [DOI] [PubMed] [Google Scholar]
- Brendish NJ, Malachira AK, Beard KR, Armstrong L, Lillie PJ, Clark TW, Southampton N, Nhs S, Trust F. Hospitalised adults with pneumonia are frequently misclassified as another diagnosis. Respir Med. 2019;150:81–84. doi: 10.1016/j.rmed.2019.02.013. [DOI] [PubMed] [Google Scholar]
- Breslin N, Baptiste C, Mph CG, Miller R, Martinez R, Bernstein K, Ring L, Landau R, Purisch S, Mph AMF, Fuchs K, Xx DS, Andrikopoulou M, Rupley D, Sheen J, Aubey J, Zork N, Moroz L, Mourad M, Wapner R, Simpson LL, Alton MED, Goffman D (2020) Coronavirus disease 2019 infection among asymptomatic and symptomatic pregnant women: two weeks of confirmed presentations to an affiliated pair of New York City hospitals. Am J Obstet Gynecol MFM:100118. 10.1016/j.ajogmf.2020.100118 [DOI] [PMC free article] [PubMed]
- Briz-redón Á, Serrano-aroca Á. Science of the Total Environment A spatio-temporal analysis for exploring the effect of temperature on COVID-19 early evolution in Spain. Sci Total Environ. 2020;728:138811. doi: 10.1016/j.scitotenv.2020.138811. [DOI] [PMC free article] [PubMed] [Google Scholar]
- Cai Y, Wang D, Zhou L, Ge X, Guo X, Han J, Yang H. Application of RNAscope technology to studying the infection dynamics of a Chinese porcine epidemic diarrhea virus variant strain BJ2011C in neonatal piglets. Vet Microbiol. 2019;235:220–228. doi: 10.1016/j.vetmic.2019.07.003. [DOI] [PubMed] [Google Scholar]
- Çapraz Ö, Deniz A, Doğan N. Effects of air pollution on respiratory hospital admissions in İstanbul, Turkey, 2013 to 2015. ECSN. 2017;181:544–550. doi: 10.1016/j.chemosphere.2017.04.105. [DOI] [PubMed] [Google Scholar]
- Cevik M, Bamford C, Ho A. COVID-19 pandemic – A focused review for clinicians. Clin Microbiol Infect. 2020;26:842–847. doi: 10.1016/j.cmi.2020.04.023. [DOI] [PMC free article] [PubMed] [Google Scholar]
- Chan JFW, Kok KH, Zhu Z, Chu H, To KKW, Yuan S, Yuen KY. Genomic characterization of the 2019 novel human-pathogenic coronavirus isolated from a patient with atypical pneumonia after visiting Wuhan. Emerg Microbes Infect. 2020;9:221–236. doi: 10.1080/22221751.2020.1719902. [DOI] [PMC free article] [PubMed] [Google Scholar]
- Chan JF, Yuan S, Kok KH, To KK. Chu H, Yang J, Xing F, Liu J, Yip CC, Poon RW, Tsoi HW, Lo SK, Chan KH, Poon VK, Chan WM, Ip JD, Cai JP, Cheng VC, Chen H, Hui CK, Yuen KY. A familial cluster of pneumonia associated with the 2019 novel coronavirus indicating person-to-person transmission: a study of a family cluster. Lancet. 2020;395(10223):514–523. doi: 10.1016/S0140-6736(20)30154-9. [DOI] [PMC free article] [PubMed] [Google Scholar]
- Charles M, Bernard I, Villalba A, Oden E, Burioli EAV, Allain G, Trancart S, Bouchart V, Houssin M. High mortality of mussels in northern Brittany – Evaluation of the involvement of pathogens, pathological conditions and pollutants. J Invertebr Pathol. 2020;170:107308. doi: 10.1016/j.jip.2019.107308. [DOI] [PubMed] [Google Scholar]
- Chauhan AJ, Johnston SL. Air pollution and infection in respiratory illness. 2003. pp. 95–112. [DOI] [PubMed] [Google Scholar]
- Chen C, Liu C, Chen R, Wang W, Li W, Kan H, Fu C. Ambient air pollution and daily hospital admissions for mental disorders in Shanghai. China Sci Total Environ. 2018;613:324–330. doi: 10.1016/j.scitotenv.2017.09.098. [DOI] [PubMed] [Google Scholar]
- Chen D, Xiao Y, Tang S. Air quality index induced nonsmooth system for respiratory infection. J Theor Biol. 2019;460:160–169. doi: 10.1016/j.jtbi.2018.10.016. [DOI] [PubMed] [Google Scholar]
- Chen Z, Chen D, Zhao C, Kwan M, Cai J, Zhuang Y, Zhao B, Wang X, Chen B, Yang J, Li R, He B, Gao B, Wang K, Xu B. Influence of meteorological conditions on PM 2 . 5 concentrations across China : A review of methodology and mechanism. Environ Int. 2020;139:105558. doi: 10.1016/j.envint.2020.105558. [DOI] [PubMed] [Google Scholar]
- Cheng M, Wang B, Yang M, Ma J, Ye Z, Xie L, Zhou M (2020) microRNAs expression in relation to particulate matter exposure: A systematic review. Journal Pre-proof. 10.1016/j.envpol.2020.113961 [DOI] [PubMed]
- Chew S, Kolosowska N, Saveleva L, Malm T, Kanninen KM. Impairment of mitochondrial function by particulate matter: Implications for the brain. Neurochem Int. 2020;104694:104694. doi: 10.1016/j.neuint.2020.104694. [DOI] [PubMed] [Google Scholar]
- Chinazzi M, Davis JT, Ajelli M, Gioannini C, Litvinova M, Merler S, Pastore Y, Piontti A, Mu K, Rossi L, Sun K, Viboud C, Xiong X, Yu H, Halloran ME, Longini IM Jr, Vespignani A (2020) The effect of travel restrictions on the spread of the 2019 novel coronavirus (COVID-19) outbreak. Science:pii: eaba9757. 10.1126/science.aba9757 [DOI] [PMC free article] [PubMed]
- Chong K, Kee N, Mehta PR, Shukla G, Mehta AR. COVID-19, SARS and MERS: A neurological perspective. J Clin Neurosci. 2020;77:13–16. doi: 10.1016/j.jocn.2020.04.124. [DOI] [PMC free article] [PubMed] [Google Scholar]
- Chuang YH, Mazumdar S, Park T, Tang G, Arena VC, Nicolich MJ. Atmospheric Pollution Research Generalized linear mixed models in time series studies of air pollution. Atmos Pollut Res. 2011;2:428–435. doi: 10.5094/APR.2011.049. [DOI] [Google Scholar]
- Cirera L, García-marcos L, Giménez J, Moreno-grau S, Tobías A (2012) Daily effects of air pollutants and pollen types on asthma and COPD hospital emergency visits in the industrial and Mediterranean Spanish city of Cartagena. 40:231–237. 10.1016/j.aller.2011.05.012 [DOI] [PubMed]
- Civil I, Morettini M. COVID-19 in Italy : Dataset of the Italian Civil Protection Department. Data Br. 2020;30:105526. doi: 10.1016/j.dib.2020.105526. [DOI] [PMC free article] [PubMed] [Google Scholar]
- Coccia M. Jo ur l P re. Sci Total Environ. 2020;138474:138474. doi: 10.1016/j.scitotenv.2020.138474. [DOI] [PMC free article] [PubMed] [Google Scholar]
- Cuesta-mosquera AP, Wahl M, Acosta-lópez JG, García-reynoso JA, Aristizábal-zuluaga BH. Mixing layer height and slope wind oscillation : Factors that control ambient air SO 2 in a tropical mountain city. Sustain Cities Soc. 2020;52:101852. doi: 10.1016/j.scs.2019.101852. [DOI] [Google Scholar]
- Cuhadaroglu B, Demirci E (1997) AI ID =JUlLr.r,)li 15.
- Dastoorpoor M, Masoumi K, Vahedian M. Associations of short-term exposure to air pollution with respiratory hospital admissions in Ahvaz. Iran Process Saf Environ Prot. 2019;123:150–160. doi: 10.1016/j.psep.2019.01.012. [DOI] [Google Scholar]
- De Rooij MMT, Smit LAM, Erbrink HJ, Hagenaars TJ, Hoek G, Ogink NWM, Winkel A, Heederik DJJ, Wouters IM. Endotoxin and particulate matter emitted by livestock farms and respiratory health e ff ects in neighboring residents. Environ Int. 2019;132:105009. doi: 10.1016/j.envint.2019.105009. [DOI] [PubMed] [Google Scholar]
- Fattorini D, Regoli F. Role of the chronic air pollution levels in the Covid-19 outbreak risk in Italy. Environ Pollut. 2020;114732:114732. doi: 10.1016/j.envpol.2020.114732. [DOI] [PMC free article] [PubMed] [Google Scholar]
- Frontera A, Martin C, Vlachos K, Sgubin G (2020) Regional air pollution persistence links to COVID-19 infection zoning. J. Infect.:2019, 318–2020, 356. 10.1016/j.jinf.2020.03.045 [DOI] [PMC free article] [PubMed]
- Galy-lacaux C, Liousse C, Adon M, Diop B, Hadji E, Doumbia T, Gardrat E, Ababacar S, Jarnot C (2016) Measurements of NO 2 , SO 2 , NH 3 , HNO 3 and O 3 in West African urban environments ronique. Yobou e 135. 10.1016/j.atmosenv.2016.03.050
- Gao Y, Wang Z, Liu C, Peng Z. Assessing neighborhood air pollution exposure and its relationship with the urban form. Build Environ. 2019;155:15–24. doi: 10.1016/j.buildenv.2018.12.044. [DOI] [Google Scholar]
- Ge E, Ph D, Fan M, Qiu H, Ph D, Hu H, Sc D, Tian L, Ph D, Wang X, Xu G, Ph D, Wei X, Ph D. Ambient sulfur dioxide levels associated with reduced risk of initial outpatient visits for tuberculosis : A population based time series. Environ Pollut. 2017;228:408–415. doi: 10.1016/j.envpol.2017.05.051. [DOI] [PubMed] [Google Scholar]
- Ge E, Lai K, Xiao X, Luo M, Fang Z, Zeng Y, Ju H, Zhong N. AC SC. Environ Pollut. 2018;243:336–345. doi: 10.1016/j.envpol.2018.08.068. [DOI] [PubMed] [Google Scholar]
- Gerling L, Löschau G, Wiedensohler A, Weber S. Statistical modelling of roadside and urban background ultrafine and accumulation mode particle number concentrations using generalized additive models. Sci Total Environ. 2020;703:134570. doi: 10.1016/j.scitotenv.2019.134570. [DOI] [PubMed] [Google Scholar]
- Ghinai I, McPherson TD, Hunter JC, Kirking HL, Christiansen D, Joshi K, Rubin R, Morales-Estrada S, Black SR, Pacilli M, Fricchione MJ, Chugh RK, Walblay KA, Ahmed NS, Stoecker WC, Hasan NF, Burdsall DP, Reese HE, Wallace M, Wang C, Moeller D, Korpics J, Novosad SA, Benowitz I, Jacobs MW, Dasari VS, Patel MT, Kauerauf J, Charles EM, Ezike NO, Chu V, Midgley CM, Rolfes MA, Gerber SI, Lu X, Lindstrom S, Verani JR, Layden JE, Illinois COVID-19 Investigation Team (2020) First known person-to-person transmission of severe acute respiratory syndrome coronavirus 2 (SARS-CoV-2) in the USA. Lancet:pii: S0140-6736 (20)30607-3. 10.1016/S0140-6736(20)30607-3 [DOI] [PMC free article] [PubMed]
- Giacomelli E, Dorigo W, Fargion A, Calugi G, Cianchi G, Pratesi C. Acute thrombosis of an aortic prosthetic graft in a patient with severe COVID-19 related pneumonia. Ann Vasc Surg. 2020;66:8–10. doi: 10.1016/j.avsg.2020.04.040. [DOI] [PMC free article] [PubMed] [Google Scholar]
- Glick AF, Tomopoulos S, Fierman AH, Elixhauser A, Trasande L, M, A.G.E.D.H Association Between Outdoor Air Pollution Levels and Inpatient Outcomes in Pediatric Pneumonia Hospitalizations, 2007 to 2008. Acad Pediatr. 2019;19:414–420. doi: 10.1016/j.acap.2018.12.001. [DOI] [PMC free article] [PubMed] [Google Scholar]
- Gralton J, Tovey E, McLaws ML, Rawlinson WD. The role of particle size in aerosolised pathogen transmission: A review. J Infect. 2011;62:1–13. doi: 10.1016/j.jinf.2010.11.010. [DOI] [PMC free article] [PubMed] [Google Scholar]
- Hachem M, Saleh N, Paunescu A, Momas I, Bensefa-colas L. Science of the Total Environment Exposure to traf fi c air pollutants in taxicabs and acute adverse respiratory effects : A systematic review. Sci Total Environ. 2019;693:133439. doi: 10.1016/j.scitotenv.2019.07.245. [DOI] [PubMed] [Google Scholar]
- Hao J, Yang Z, Huang S, Yang W, Zhu Z, Tian L. The association between short-term exposure to ambient air pollution and the incidence of mumps in Wuhan, China: A time-series study. Environ Res. 2019;177:108660. doi: 10.1016/j.envres.2019.108660. [DOI] [PubMed] [Google Scholar]
- Hellewell J, Abbott S, Gimma A, Bosse NI, Jarvis CI, Russell TW, Munday JD, Kucharski AJ (2020) Articles Feasibility of controlling COVID-19 outbreaks by isolation of cases and contacts:488–496. 10.1016/S2214-109X(20)30074-7 [DOI] [PMC free article] [PubMed]
- Hendryx M, Luo J, Chojenta C, Byles JE. Air pollution exposures from multiple point sources and risk of incident chronic obstructive pulmonary disease ( COPD ) and asthma. Environ Res. 2019;179:108783. doi: 10.1016/j.envres.2019.108783. [DOI] [PubMed] [Google Scholar]
- Her M. Jo u rn Pr pr oo f. One Heal. 2020;100137:100137. doi: 10.1016/j.onehlt.2020.100137. [DOI] [Google Scholar]
- Herfst S, Böhringer M, Karo B, Lawrence P, Lewis NS, Mina MJ, Russell CJ, Steel J, de Swart RL, Menge C. Drivers of airborne human-to-human pathogen transmission. Curr Opin Virol. 2017;22:22–29. doi: 10.1016/j.coviro.2016.11.006. [DOI] [PMC free article] [PubMed] [Google Scholar]
- Hernandez AD, Boag B, Neilson R, Forrester NL. IJP : Parasites and Wildlife Variable changes in nematode infection prevalence and intensity after Rabbit Haemorrhagic Disease Virus emerged in wild rabbits in Scotland and New Zealand. IJP Parasites Wildl. 2018;7:187–195. doi: 10.1016/j.ijppaw.2018.05.002. [DOI] [PMC free article] [PubMed] [Google Scholar]
- Hu Y, Xu Z, Jiang F, Li S, Liu S, Wu M, Yan C, Tan J, Yu G, Hu Y, Yin Y, Tong S. Science of the Total Environment Relative impact of meteorological factors and air pollutants on childhood allergic diseases in Shanghai. China. 2020;706:135975. doi: 10.1016/j.scitotenv.2019.135975. [DOI] [PubMed] [Google Scholar]
- Huang C, Lin H, Tsai C, Huang H, Lian I (2017) The Interaction Effects of Meteorological Factors and Air Pollution on the Development of Acute Coronary Syndrome:1–10. 10.1038/srep44004 [DOI] [PMC free article] [PubMed]
- Keshavarzian E, Jin R, Dong K, Kwok KCS, Zhang Y, Zhao M. Highlights : Appl. Math Model. 2020;81:582–602. doi: 10.1016/j.apm.2020.01.019. [DOI] [PMC free article] [PubMed] [Google Scholar]
- Khan S, Siddique R, Shereen MA, Ali A, Liu J, Bai Q, Bashir N, Xue M. Emergence of a Novel Coronavirus, Severe Acute Respiratory Syndrome Coronavirus 2: Biology and Therapeutic Options. J Clin Microbiol. 2020;58:1–9. doi: 10.1128/jcm.00187-20. [DOI] [PMC free article] [PubMed] [Google Scholar]
- Kim D, Chen Z, Zhou L, Huang S. ScienceDirect Air pollutants and early origins of respiratory diseases. Chronic Dis Transl Med. 2018;4:75–94. doi: 10.1016/j.cdtm.2018.03.003. [DOI] [PMC free article] [PubMed] [Google Scholar]
- Kim H, Kim H, Lee J. Effect of air pollutant emission reduction policies on hospital visits for asthma in Seoul, Korea; Quasi-experimental study. Environ Int. 2019;132:104954. doi: 10.1016/j.envint.2019.104954. [DOI] [PubMed] [Google Scholar]
- Kudo E, Song E, Yockey LJ, Rakib T, Wong PW, Homer RJ (2019) Low ambient humidity impairs barrier function and innate resistance against influenza infection. 116:10905–10910. 10.1073/pnas.1902840116 [DOI] [PMC free article] [PubMed]
- Lau H, Khosrawipour V, Kocbach P, Mikolajczyk A, Ichii H, Schubert J, Bania J, Khosrawipour T. ScienceDirect Internationally lost COVID-19 cases. J Microbiol Immunol Infect. 2020;1–5:454–458. doi: 10.1016/j.jmii.2020.03.013. [DOI] [PMC free article] [PubMed] [Google Scholar]
- Lee SW, Yon DK, James CC, Lee S, Koh HY, Sheen YH, Oh J, Han MY, Sugihara G. Short-term effects of multiple outdoor environmental factors on risk of asthma exacerbations: age-stratified time-series analysis. J Allergy Clin Immunol. 2019;144:1542–1550.e1. doi: 10.1016/j.jaci.2019.08.037. [DOI] [PubMed] [Google Scholar]
- Li S (2017) A Generalized Additive Model Combining Principal Component Analysis for PM 2. 5 Concentration Estimation. 10.3390/ijgi6080248
- Li J, Hu Y, Liu L, Wang Q, Zeng J, Chen C (2020) l P of Sci Total Environ:137432. 10.1016/j.scitotenv.2020.137432 [DOI] [PubMed]
- Liang W, Liu W, Kuo H (2009) Diurnal temperature range and emergency room admissions for chronic obstructive pulmonary disease in Taiwan:17–23. 10.1007/s00484-008-0187-y [DOI] [PubMed]
- Liang Z, Xu C, Fan Y, Liang Z-q, Kan H, Chen R. Ecotoxicology and Environmental Safety Association between air pollution and menstrual disorder outpatient visits : A time-series analysis. Ecotoxicol Environ Saf. 2020;192:110283. doi: 10.1016/j.ecoenv.2020.110283. [DOI] [PubMed] [Google Scholar]
- Liang Z, Xu C, Ji A, Liang S, Kan H, Chen R, Lei J, Li Y, Liang Z-q, Cai T. Chemosphere Effects of short-term ambient air pollution exposure on HPV infections : A fi ve-year hospital-based study. Chemosphere. 2020;252:126615. doi: 10.1016/j.chemosphere.2020.126615. [DOI] [PubMed] [Google Scholar]
- Lim E, Chung J, Sandberg M, Ito K. Influence of chemical reactions and turbulent diffusion on the formation of local pollutant concentration distributions. Build Environ. 2020;168:106487. doi: 10.1016/j.buildenv.2019.106487. [DOI] [Google Scholar]
- Lin Y, Chang C, Chang S, Chen P, Lin C, Wang Y. Temperature , nitrogen dioxide , circulating respiratory viruses and acute upper respiratory infections among children in Taipei , Taiwan : A population-based study. Environ Res. 2013;120:109–118. doi: 10.1016/j.envres.2012.09.002. [DOI] [PMC free article] [PubMed] [Google Scholar]
- Lin M, Kor C, Chang C, Chai W, Soon M. Association of meteorological factors and air NO 2 and O 3 concentrations with acute exacerbation of elderly chronic obstructive pulmonary disease. Sci Rep. 2018;1–9:10192. doi: 10.1038/s41598-018-28532-5. [DOI] [PMC free article] [PubMed] [Google Scholar]
- Lin X, Liao Y, Hao Y. Chemosphere The burden associated with ambient PM 2 . 5 and meteorological factors in Guangzhou , China , 2012 e 2016 : A generalized additive modeling of temporal years of life lost. Chemosphere. 2018;212:705–714. doi: 10.1016/j.chemosphere.2018.08.129. [DOI] [PubMed] [Google Scholar]
- Liu W, Huang C, Hu Y, Fu Q, Zou Z, Sun C, Shen L, Wang X, Cai J, Pan J, Huang Y, Chang J, Sun Y, Sundell J. Associations of gestational and early life exposures to ambient air pollution with childhood respiratory diseases in Shanghai. China : A retrospective cohort study. 2016;93:284–293. doi: 10.1016/j.envint.2016.04.019. [DOI] [PubMed] [Google Scholar]
- Liu Y, Xie S, Yu Q, Huo X, Ming X, Wang J. Short-term effects of ambient air pollution on pediatric outpatient visits for respiratory diseases in Yichang city , China *. Environ Pollut. 2017;227:116–124. doi: 10.1016/j.envpol.2017.04.029. [DOI] [PubMed] [Google Scholar]
- Liu X, Lv X, Peng Z, Shi C (2019a) Sustain Cities Soc:101822. 10.1016/j.scs.2019.101822
- Liu X, Wang J, Zhang Y, Yu H, Xu B, Zhang C. Comparison between two GAMs in quantifying the spatial distribution of Hexagrammos otakii in Haizhou Bay. China Fish Res. 2019;218:209–217. doi: 10.1016/j.fishres.2019.05.019. [DOI] [Google Scholar]
- Liu G, Yan X, Sedykh A, Pan X, Zhao X, Yan B. Ecotoxicology and Environmental Safety Analysis of model PM 2 . 5 -induced in fl ammation and cytotoxicity by the combination of a virtual carbon nanoparticle library and computational modeling. Ecotoxicol Environ Saf. 2020;191:110216. doi: 10.1016/j.ecoenv.2020.110216. [DOI] [PMC free article] [PubMed] [Google Scholar]
- Liu J, Zhou J, Yao J, Zhang X, Li L, Yan J, Shi Y, Ren X, Niu J, Zhu W (2020b) ur l P re Sci Total Environ:138513. 10.1016/j.scitotenv.2020.138513 [DOI] [PMC free article] [PubMed]
- Liu W, Cai J, Fu Q, Zou Z, Sun C, Zhang J. Chemosphere Associations of ambient air pollutants with airway and allergic symptoms in 13 , 335 preschoolers in Shanghai , China. Chemosphere. 2020;252:126600. doi: 10.1016/j.chemosphere.2020.126600. [DOI] [PubMed] [Google Scholar]
- Lodigiani C, Iapichino G, Carenzo L, Cecconi M, Ferrazzi P, Sebastian T, Kucher N, Studt J, Sacco C, Alexia B, Teresa M, Barco S, Task HC. Venous and arterial thromboembolic complications in COVID-19 patients admitted to an academic hospital in Milan , Italy. Thromb Res. 2020;191:9–14. doi: 10.1016/j.thromres.2020.04.024. [DOI] [PMC free article] [PubMed] [Google Scholar]
- Lowen AC, Steel J (2014) Roles of humidity and temperature in shaping influenza seasonality:1–13. 10.1128/JVI.03544-13 [DOI] [PMC free article] [PubMed]
- Lu H, Stratton CW, Tang Y (n.d.) Outbreak of Pneumonia of Unknown Etiology in Wuhan China: the Mystery and the Miracle. J Med Virol [DOI] [PMC free article] [PubMed]
- Luong LMT, Phung D, Sly PD, Morawska L, Thai PK. Science of the Total Environment The association between particulate air pollution and respiratory admissions among young children in Hanoi. Vietnam Sci Total Environ. 2016;578:249–255. doi: 10.1016/j.scitotenv.2016.08.012. [DOI] [PubMed] [Google Scholar]
- Ma Y, Zhao Y, Liu J, He X, Wang B, Fu S, Yan J, Niu J, Zhou J, Luo B. Jo ur na of. Sci Total Environ. 2020;138226:138226. doi: 10.1016/j.scitotenv.2020.138226. [DOI] [PMC free article] [PubMed] [Google Scholar]
- Mäkelä K, Ollila H, Sutinen E, Vuorinen V, Peltola E, Kaarteenaho R. Annals of Diagnostic Pathology Inorganic particulate matter in the lung tissue of idiopathic pulmonary fibrosis patients reflects population density and fine particle levels. Ann Diagn Pathol. 2019;40:136–142. doi: 10.1016/j.anndiagpath.2019.04.011. [DOI] [PubMed] [Google Scholar]
- Mallik C, Sarathi P, Kumar P, Panda S, Boopathy R, Das T, Lal S. Influence of regional emissions on SO2 concentrations over Bhubaneswar, a capital city in eastern India downwind of the Indian SO2 hotspots. Atmos Environ. 2019;209:220–232. doi: 10.1016/j.atmosenv.2019.04.006. [DOI] [Google Scholar]
- Marr LC, Tang JW, Van Mullekom J, Lakdawala SS (2019) Mechanistic insights into the effect of humidity on airborne influenza virus survival , transmission and incidence. [DOI] [PMC free article] [PubMed]
- Martins NR, Carrilho G. A simulation study of decreased life expectancy from exposure to ambient particulate air pollution ( PM2 . 5 ) in naturally ventilated workspaces. J Build Eng. 2020;30:101268. doi: 10.1016/j.jobe.2020.101268. [DOI] [Google Scholar]
- Mason TG, Schooling CM, Chan KP, Tian L. An evaluation of the air quality health index program on respiratory diseases in Hong Kong : An interrupted time series analysis. Atmos Environ. 2019;211:151–158. doi: 10.1016/j.atmosenv.2019.05.013. [DOI] [Google Scholar]
- Miao Y, Shen Y, Lu C, Zeng J, Deng Q. Maternal exposure to ambient air temperature during pregnancy and early childhood pneumonia. J Therm Biol. 2017;69:288–293. doi: 10.1016/j.jtherbio.2017.09.001. [DOI] [PubMed] [Google Scholar]
- MoEF (Ministry of Environment and Forest) (2010) National ambient air quality standards, government of India, New Delhi, p 4
- Moghanibashi-mansourieh A. Assessing the anxiety level of Iranian general population during COVID-19 outbreak. Asian J Psychiatr. 2020;51:102076. doi: 10.1016/j.ajp.2020.102076. [DOI] [PMC free article] [PubMed] [Google Scholar]
- Muhammad S, Long X, Salman M. Science of the Total Environment COVID-19 pandemic and environmental pollution : A blessing in disguise ? Sci Total Environ. 2020;728:138820. doi: 10.1016/j.scitotenv.2020.138820. [DOI] [PMC free article] [PubMed] [Google Scholar]
- Naclerio R, Ansotegui IJ, Bousquet J, Canonica GW. International expert consensus on the management of allergic rhinitis ( AR ) aggravated by air pollutants Impact of air pollution on patients with AR : Current knowledge and future strategies. World Allergy Organ J. 2020;13:100106. doi: 10.1016/j.waojou.2020.100106. [DOI] [PMC free article] [PubMed] [Google Scholar]
- Nephew BC, Nemeth A, Hudda N, Beamer G, Mann P, Petitto J, Cali R, Febo M, Kulkarni P, Poirier G, King J, Durant JL, Brugge D (2020) Tra ffi c-related particulate matter a ff ects behavior , in fl ammation , and neural integrity in a developmental rodent model:183. 10.1016/j.envres.2020.109242 [DOI] [PMC free article] [PubMed]
- Niu S, Tian S, Lou J, Kang X, Zhang L, Lian H, Zhang J. Clinical characteristics of older patients infected with COVID-19 : A descriptive study. Arch Gerontol Geriatr. 2020;89:104058. doi: 10.1016/j.archger.2020.104058. [DOI] [PMC free article] [PubMed] [Google Scholar]
- Ogen Y. Assessing nitrogen dioxide (NO2) levels as a contributing factor to coronavirus (COVID-19) fatality. Sci Total Environ. 2020;726:138605. doi: 10.1016/j.scitotenv.2020.138605. [DOI] [PMC free article] [PubMed] [Google Scholar]
- Oh H, Ho C, Koo Y, Baek K, Yun H, Hur S, Choi D, Jhun J, Shim J. Impact of Chinese air pollutants on a record-breaking PMs episode in South Korea for 11–15 January 2019. Atmos Environ. 2020;117262:117262. doi: 10.1016/j.atmosenv.2020.117262. [DOI] [Google Scholar]
- Onozuka D (2020) The in fl uence of diurnal temperature range on the incidence of respiratory syncytial virus in Japan:813–820. 10.1017/S0950268814001575 [DOI] [PMC free article] [PubMed]
- Pan G, Zhang S, Feng Y, Takahashi K. Air pollution and children ’ s respiratory symptoms in six cities of Northern China. Respir Med. 2010;104:1903–1911. doi: 10.1016/j.rmed.2010.07.018. [DOI] [PubMed] [Google Scholar]
- Pearce JL, Beringer J, Nicholls N, Hyndman RJ, Tapper NJ. Quantifying the in fl uence of local meteorology on air quality using generalized additive models. Atmos Environ. 2011;45:1328–1336. doi: 10.1016/j.atmosenv.2010.11.051. [DOI] [Google Scholar]
- Peng L, Xiao S, Gao W, Zhou Y, Zhou J, Yang D, Ye X. Short-term associations between size-fractionated particulate air pollution and COPD mortality in Shanghai , China *. Environ Pollut. 2019;113483:113483. doi: 10.1016/j.envpol.2019.113483. [DOI] [PubMed] [Google Scholar]
- Pettersson JH, Piorkowski G, Mayxay M, Rattanavong S, Vongsouvath M, Davong V, Alfsnes K, Eldholm V, De Lamballerie X, Holmes EC, Newton PN, Dubot-pérès A. Meta-transcriptomic identi fi cation of hepatitis B virus in cerebrospinal fl uid in patients with central nervous system disease. Diagn Microbiol Infect Dis. 2019;95:114878. doi: 10.1016/j.diagmicrobio.2019.114878. [DOI] [PMC free article] [PubMed] [Google Scholar]
- Phosri A, Ueda K, Phung VLH, Tawatsupa B, Honda A, Takano H. Effects of ambient air pollution on daily hospital admissions for respiratory and cardiovascular diseases in Bangkok. Thailand Sci Total Environ. 2019;651:1144–1153. doi: 10.1016/j.scitotenv.2018.09.183. [DOI] [PubMed] [Google Scholar]
- Prata DN, Rodrigues W, Bermejo PH. Science of the Total Environment Temperature signi fi cantly changes COVID-19 transmission in ( sub ) tropical cities of Brazil. Sci Total Environ. 2020;729:138862. doi: 10.1016/j.scitotenv.2020.138862. [DOI] [PMC free article] [PubMed] [Google Scholar]
- Pun VC, Tian L, Ho K. Particulate matter from re-suspended mineral dust and emergency cause-specific respiratory hospitalizations in Hong Kong. Atmos Environ. 2017;165:191–197. doi: 10.1016/j.atmosenv.2017.06.038. [DOI] [Google Scholar]
- Qi X, Mei G, Cuomo S, Liu C, Xu N. Data analysis and mining of the correlations between meteorological conditions and air quality : A case study in. Internet of Things. 2019;100127:100127. doi: 10.1016/j.iot.2019.100127. [DOI] [Google Scholar]
- Qi L, Gao Y, Yang J, Ding X, Xiong Y, Su K, Liu T, Li Q, Tang W, Liu Q, Gao Y, Yang J (2020) Jo ur l P re:2012–2018. 10.1016/j.scitotenv.2020.136682
- Qiu X, Wei Y, Wang Y, Di Q, Sofer T, Abu Y, Schwartz J. Inverse probability weighted distributed lag e ff ects of short-term exposure to PM 2 . 5 and ozone on CVD hospitalizations in New England Medicare participants - Exploring the causal e ff ects. Environ Res. 2020;182:109095. doi: 10.1016/j.envres.2019.109095. [DOI] [PMC free article] [PubMed] [Google Scholar]
- Ravindra K, Rattan P, Mor S, Nath A. Generalized additive models: Building evidence of air pollution, climate change and human health. Environ Int. 2019;132:104987. doi: 10.1016/j.envint.2019.104987. [DOI] [PubMed] [Google Scholar]
- Remuzzi A, Remuzzi G. Health Policy COVID-19 and Italy : what next ? Lancet. 2020;2:10–13. doi: 10.1016/S0140-6736(20)30627-9. [DOI] [PMC free article] [PubMed] [Google Scholar]
- Report S (2020) Novel Coronavirus ( 2019-nCoV )
- Rojas-roa Y, Rodríguez-villamizar LA (2019) Short-term joint effects of ambient air pollutants on emergency department visits for respiratory and circulatory diseases in Colombia. 248:380–387. 10.1016/j.envpol.2019.02.028 [DOI] [PubMed]
- Saha PK, Khlystov A, Snyder MG, Grieshop AP. SC. Atmos Environ. 2018;177:143–153. doi: 10.1016/j.atmosenv.2018.01.019. [DOI] [Google Scholar]
- Sahoo MM, Patra KC, Swain JB, Khatua KK. Evaluation of water quality with application of Bayes’ rule and entropy weight method. Eur J Environ Civ Eng. 2017;21:730–752. doi: 10.1080/19648189.2016.1150895. [DOI] [Google Scholar]
- Sangeetha SK, Sivakumar V. Journal of Atmospheric and Solar-Terrestrial Physics Long-term temporal and spatial analysis of SO 2 over Gauteng and Mpumalanga monitoring sites of South Africa. J Atmos Solar-Terrestrial Phys. 2019;191:105044. doi: 10.1016/j.jastp.2019.05.008. [DOI] [Google Scholar]
- Sangkharat K, Fisher P, Thomas GN, Thornes J, Pope FD. The impact of air pollutants on ambulance dispatches : A systematic review and meta-analysis of acute effects *. Environ Pollut. 2019;254:112769. doi: 10.1016/j.envpol.2019.06.065. [DOI] [PubMed] [Google Scholar]
- Segars J, Katler Q, Mcqueen DB, Glenn T, Knight Z, Feinberg EC, Hugh S, Toner JP, Kawwass JF. Prior and Novel Coronaviruses, COVID-19, and Human Reproduction: What Is Known? Fertil Steril. 2020;113:1140–1149. doi: 10.1016/j.fertnstert.2020.04.025. [DOI] [PMC free article] [PubMed] [Google Scholar]
- Shahzad F, Shahzad U, Fareed Z, Iqbal N (2020) of. Sci. Total Environ. 139115. 10.1016/j.scitotenv.2020.139115 [DOI] [PMC free article] [PubMed]
- Shereen MA, Khan S, Kazmi A, Bashir N, Siddique R. COVID-19 infection: origin, transmission, and characteristics of human coronaviruses. J Adv Res. 2020;24:91–98. doi: 10.1016/j.jare.2020.03.005. [DOI] [PMC free article] [PubMed] [Google Scholar]
- Steel J, Palese P, Lowen AC. Transmission of a 2009 pandemic influenza virus shows a sensitivity to temperature and humidity similar to that of an H3N2 seasonal strain. J Virol. 2011;85:1400–1402. doi: 10.1128/JVI.02186-10. [DOI] [PMC free article] [PubMed] [Google Scholar]
- Su W, Wu X, Geng X, Zhao X, Liu Q, Liu T (2019) The short-term effects of air pollutants on influenza-like illness in Jinan. China:1–12 [DOI] [PMC free article] [PubMed]
- Sun W, Palazoglu A, Singh A, Zhang H, Wang Q, Zhao Z, Cao D. A tm spheric P ollution. Atmos Pollut Res. 2015;6:245–253. doi: 10.5094/APR.2015.029. [DOI] [Google Scholar]
- Tan W, Zhu H, Zhang N, Dong D, Wang S (2019) Characterization of the PM2 . 5 concentration in surgical smoke in di ff erent tissues during hemihepatectomy and protective measures. 72. 10.1016/j.etap.2019.103248 [DOI] [PubMed]
- Thi N, Nhung T, Schindler C, Minh T, Probst-hensch N. Acute e ff ects of ambient air pollution on lower respiratory infections in Hanoi children : An eight-year time series study. Environ Int. 2018;110:139–148. doi: 10.1016/j.envint.2017.10.024. [DOI] [PubMed] [Google Scholar]
- Thi L, Luong M, Dang TN, Thi N, Huong T, Phung D, Tran LK, Van Dung D, Thai PK. Particulate air pollution in Ho Chi Minh city and risk of hospital admission for acute lower respiratory infection (ALRI) among young children. Environ Pollut. 2019;113424:113424. doi: 10.1016/j.envpol.2019.113424. [DOI] [PubMed] [Google Scholar]
- Thi N, Nhung T, Schindler C, Minh T. Association of ambient air pollution with lengths of hospital stay for hanoi children with acute lower-respiratory infection, 2007–2016*. Environ Pollut. 2019;247:752–762. doi: 10.1016/j.envpol.2019.01.115. [DOI] [PubMed] [Google Scholar]
- Tian S, Hu N, Lou J, Chen K, Kang X, Xiang Z, Chen H, Wang D, Liu N, Liu D, Chen G, Zhang Y, Li D, Li J, Lian H, Niu S, Zhang L, Zhang J. Characteristics of COVID-19 infection in Beijing. J. Infect. 2020;80:401–406. doi: 10.1016/j.jinf.2020.02.018. [DOI] [PMC free article] [PubMed] [Google Scholar]
- Tiwari A, Kumar P. Science of the Total Environment Integrated dispersion-deposition modelling for air pollutant reduction via green infrastructure at an urban scale. Sci Total Environ. 2020;723:138078. doi: 10.1016/j.scitotenv.2020.138078. [DOI] [PubMed] [Google Scholar]
- Tong Y, Luo K, Li R, Pei L, Li A, Yang M, Xu Q. Association between multi-pollutant mixtures pollution and daily cardiovascular mortality : An exploration of exposure-response relationship. Atmos Environ. 2018;186:136–143. doi: 10.1016/j.atmosenv.2018.05.034. [DOI] [Google Scholar]
- Tyrrell DAJ, Myint SH (1996) Coronaviruses, in: Medical Microbiology, 4th edn. University of Texas Medical Branch at Galveston [PubMed]
- Van Kersen W, Oldenwening M, Aalders B, Bloemsma LD. Acute respiratory e ff ects of livestock-related air pollution in a panel of COPD patients. Environ Int. 2020;136:105426. doi: 10.1016/j.envint.2019.105426. [DOI] [PubMed] [Google Scholar]
- Vidale S, Arnaboldi M, Bosio V, Corrado G, Guidotti M, Sterzi R, Campana C. Short-term air pollution exposure and cardiovascular events: A 10-year study in the urban area of Como. Italy Int J Cardiol. 2017;248:389–393. doi: 10.1016/j.ijcard.2017.06.037. [DOI] [PubMed] [Google Scholar]
- Wang Q, Su M. Jo u rn Pr pr oo. Sci Total Environ. 2020;138915:138915. doi: 10.1016/j.scitotenv.2020.138915. [DOI] [PMC free article] [PubMed] [Google Scholar]
- Wang G, Hernandez R, Weninger K, Brown DT (2007) Infection of cells by Sindbis virus at low temperature. 362:461–467. 10.1016/j.virol.2006.12.036 [DOI] [PubMed]
- Wang R, Pan M, Zhang X, Fan X, Han M. l P re of. Int J Infect Dis. 2020;95:421–428. doi: 10.1016/j.ijid.2020.03.070. [DOI] [PMC free article] [PubMed] [Google Scholar]
- Wei F, Wu M, Qian S, Li D, Jin M, Wang J, Shui L, Lin H, Tang M, Chen K. Science of the Total Environment Association between short-term exposure to ambient air pollution and hospital visits for depression in China. Sci Total Environ. 2020;724:138207. doi: 10.1016/j.scitotenv.2020.138207. [DOI] [PubMed] [Google Scholar]
- World Health Organization (2020) Novel Coronavirus (2019-nCoV): situation report, 19. World Health Organization. https://apps.who.int/iris/handle/10665/330988
- Wu Z. Study on the spatial – temporal change characteristics and influence factors of fog and haze pollution based on GAM. Neural Comput Applic. 2019;31:1619–1631. doi: 10.1007/s00521-018-3532-z. [DOI] [Google Scholar]
- Wu Y, Jing W, Liu J, Ma Q, Yuan J, Wang Y, Du M, Liu M (2020) Science of the Total Environment Effects of temperature and humidity on the daily new cases and new deaths of COVID-19 in 166 countries. 729:1–7. 10.1016/j.scitotenv.2020.139051 [DOI] [PMC free article] [PubMed]
- Xiao T, Yang Y, Zhang Y, Cheng P, Yu H. Jo Pr f. Res Vet Sci. 2019;128:118–123. doi: 10.1016/j.rvsc.2019.11.006. [DOI] [PubMed] [Google Scholar]
- Xie J, Zhu Y. Science of the Total Environment Association between ambient temperature and COVID-19 infection in 122 cities from China. Sci Total Environ. 2020;724:138201. doi: 10.1016/j.scitotenv.2020.138201. [DOI] [PMC free article] [PubMed] [Google Scholar]
- Xie M, Ni H, Zhao D, Cheng J, Wen L, Li K, Yang H, Wang S, Zhang H, Wang X, Su H. Effect of diurnal temperature range on the outpatient visits for acute bronchitis in children : a time-series study in Hefei. China. 2016;4:4–9. doi: 10.1016/j.puhe.2016.12.016. [DOI] [PubMed] [Google Scholar]
- Xu Z, Hu W, Williams G, Clements ACA, Kan H, Tong S. Air pollution, temperature and pediatric influenza in Brisbane, Australia. Australia Environ Int. 2013;59:384–388. doi: 10.1016/j.envint.2013.06.022. [DOI] [PubMed] [Google Scholar]
- Xu H, Fu X, Kim L, Lee H, Ma S, Goh KT, Wong J, Habibullah S, Kee G, Lee K, Lim TK, Tambyah PA, Lim L, Ng LC (2014a) Statistical Modeling Reveals the Effect of Absolute Humidity on Dengue in Singapore. 8:8. 10.1371/journal.pntd.0002805 [DOI] [PMC free article] [PubMed]
- Xu Z, Liu Y, Ma Z, Li S, Hu W, Tong S. Impact of temperature on childhood pneumonia estimated from satellite remote sensing $ Environ Res. 2014;132:334–341. doi: 10.1016/j.envres.2014.04.021. [DOI] [PubMed] [Google Scholar]
- Xu Z, Shi L, Wang Y (n.d.) Pathological findings of COVID-19 associated with acute respiratory distress syndrome [published online ahead of print February 18, 2020]. Lancet Respir Med [DOI] [PMC free article] [PubMed]
- Yáñez MA, Baettig R, Cornejo J, Zamudio F, Fica R (2017) Urban airborne matter in central and southern Chile: Effects of meteorological conditions on fine and coarse particulate matter. Atmos Environ. 10.1016/j.atmosenv.2017.05.007
- Yang Y, Cao Y, Li W, Li R, Wang M, Wu Z, Xu Q. Science of the Total Environment Multi-site time series analysis of acute effects of multiple air pollutants on respiratory mortality : A population-based study in Beijing. China Sci Total Environ. 2015;508:178–187. doi: 10.1016/j.scitotenv.2014.11.070. [DOI] [PubMed] [Google Scholar]
- Yang J, Kang S, Ji Z, Yin X, Tripathee L. Investigating air pollutant concentrations, impact factors, and emission control strategies in western China by using a regional climate-chemistry model. ECSN. 2020;125767:125767. doi: 10.1016/j.chemosphere.2019.125767. [DOI] [PubMed] [Google Scholar]
- Yang J, Zhang M, Chen Y, Ma L (2020b) l P re of. 10.1016/j.ijid.2020.03.032
- Yang Z, Hao J, Huang S, Yang W, Zhu Z. Acute effects of air pollution on the incidence of hand , foot , and mouth disease in Wuhan. China Atmos Environ. 2020;225:117358. doi: 10.1016/j.atmosenv.2020.117358. [DOI] [PMC free article] [PubMed] [Google Scholar]
- Yao M, Wu G, Zhao X, Zhang J. Estimating health burden and economic loss attributable to short-term exposure to multiple air pollutants in China. Environ Res. 2020;109184:109184. doi: 10.1016/j.envres.2020.109184. [DOI] [PubMed] [Google Scholar]
- Yin G, Liu C, Hao L, Chen Y, Wang W, Huo J, Zhao Q, Zhang Y, Duan Y, Fu Q, Chen R, Kan H. Associations between size-fractionated particle number concentrations and COPD mortality in Shanghai. China Atmos Environ. 2019;214:116875. doi: 10.1016/j.atmosenv.2019.116875. [DOI] [Google Scholar]
- Yoon H. Effects of particulate matter ( PM 10 ) on tourism sales revenue : A generalized additive modeling approach. Tour Manag. 2019;74:358–369. doi: 10.1016/j.tourman.2019.04.008. [DOI] [Google Scholar]
- Zhang K, Batterman S. Near-road air pollutant concentrations of CO and PM 2 . 5 : A comparison of MOBILE6 . 2 / CALINE4 and generalized additive models. Atmos Environ. 2010;44:1740–1748. doi: 10.1016/j.atmosenv.2010.02.008. [DOI] [Google Scholar]
- Zhang J, Wei X, Jiang L, Li Y, Li M, Zhu H, Yu X, Tang J, Chen G, Zhang X (2019a) Bacterial community diversity in particulate matter ( PM 2 . 5 and PM 10 ) within broiler houses in different broiler growth stages under intensive rearing conditions in summer. 10.3382/japr/pfz006
- Zhang Y, Ye C, Yu J, Zhu W, Wang Y, Li Z, Xu Z, Cheng J, Wang N, Hao L, Hu W (2019b) Seasonal influenza A and B virus transmission in subtropical Shanghai , China Authors Wenbiao Hu , School of Public Health and Social Work ; Institute of Health and. Sci Total Environ:134607. 10.1016/j.scitotenv.2019.134607 [DOI] [PMC free article] [PubMed]
- Zhang Y, Xiang Q, Yu C, Yang Z. Asthma mortality is triggered by short-term exposures to ambient air pollutants: Evidence from a Chinese urban population. Atmos Environ. 2020;117271:117271. doi: 10.1016/j.atmosenv.2020.117271. [DOI] [Google Scholar]
- Zhao Y, Aarnink AJA, Dijkman R, Fabri T, De Jong MCM, Koerkamp PWGG (2012) Effects of Temperature , Relative Humidity , Absolute Humidity , and Evaporation Potential on Survival of Airborne Gumboro:1048–1054. 10.1128/AEM.06477-11 [DOI] [PMC free article] [PubMed]
- Zhao R, Chen S, Wang W, Huang J, Wang K, Liu L, Wei S. The impact of short-term exposure to air pollutants on the onset of out-of-hospital cardiac arrest : A systematic review and meta-analysis. Int J Cardiol. 2017;226:110–117. doi: 10.1016/j.ijcard.2016.10.053. [DOI] [PubMed] [Google Scholar]
- Zhao D, Yao F, Wang L, Zheng L, Gao Y, Ye J, Guo F, Zhao H, Gao R (2020) A comparative study on the clinical features of COVID-19 pneumonia to other pneumonias. Clin Infect Dis:pii: ciaa247. 10.1093/cid/ciaa247 [DOI] [PMC free article] [PubMed]
- Zhen Q, Deng Y, Wang Y, Wang X, Zhang H, Sun X, Ouyang Z. Science of the Total Environment Meteorological factors had more impact on airborne bacterial communities than air pollutants. Sci Total Environ. 2017;601–602:703–712. doi: 10.1016/j.scitotenv.2017.05.049. [DOI] [PubMed] [Google Scholar]
- Zhu S, Xia L, Wu J, Chen S, Chen F, Zeng F, Chen X, Chen C, Xia Y, Zhao X, Zhang J. Science of the Total Environment Ambient air pollutants are associated with newly diagnosed tuberculosis : A time-series study in Chengdu. China Sci Total Environ. 2018;631–632:47–55. doi: 10.1016/j.scitotenv.2018.03.017. [DOI] [PubMed] [Google Scholar]
- Zhu Y, Wang Y, Xu H, Luo B, Zhang W, Guo B, Chen S, Zhao X, Li W. Joint effect of multiple air pollutants on daily emergency department visits in Chengdu. China Environ Pollut. 2019;113548:113548. doi: 10.1016/j.envpol.2019.113548. [DOI] [PubMed] [Google Scholar]
Associated Data
This section collects any data citations, data availability statements, or supplementary materials included in this article.
Data Availability Statement
The details and the sources of the data are mentioned with in the manuscripts.


