

Abstract
Background
Malignant brain tumor diseases exhibit differences within molecular features depending on the patient’s age.
Methods
In this work, we use gene mutation data from public resources to explore age specifics about glioma. We use both an explainable clustering as well as classification approach to find and interpret age-based differences in brain tumor diseases. We estimate age clusters and correlate age specific biomarkers.
Results
Age group classification shows known age specifics but also points out several genes which, so far, have not been associated with glioma classification.
Conclusions
We highlight mutated genes to be characteristic for certain age groups and suggest novel age-based biomarkers and targets.
Keywords: Glioma classification, pediatric cancer, explainable artificial intelligence, XAI, Age clusters, K-Means, Random Forest, IDH1
Background
Incidence of cancer subtypes varies among children and adults. Malignant brain tumors are the leading cause of cancer death of younger patients, while in older cohorts it is lung and bronchus cancer [1, 2].
Gliomas are brain tumors holding grades from I to IV depending on their malignancy [3]. High Grade Gliomas (HGG) are brain tumors of grade III–IV. HGG are more likely to be found in older population, while patients suffering from the most aggressive form of gliomas, the glioblastoma multiforme (GBM), have a median age of 65 years at diagnosis [4]. Childhood gliomas more often include low-grade gliomas (LGG) [5]. Regarding the term LGG, it is recommended by WHO to distinguish between diffuse gliomas and astrocytic tumors due to the substantially biologically heterogeneous group of grade I–II gliomas [6].
There are considerable molecular differences between pediatric and adult gliomas [7]. Age-dependent heterogeneity in brain tumor subgroups such as HGG and LGG differences have been described [8]. So far, there are several studies on molecular features [9–11] within pediatric or elderly patients, however, a classification involving age specifics has not been included in established schemes.
Therapy-relevant glioma classification depends on the knowledge of underlying molecular variations [12, 13]. The conventional classification was updated in 2016 and is based on gene variations. These include, primarily, codeletion of chromosomal arms 1p and 19q, and the genetic status of isocitrate dehydrogenase 1 (IDH1) [13]. Further mutations are described for Alpha thalassemia/mental retardation syndrome X-linked chromatin remodeler (ATRX) [14], tumor protein P53 (TP53) [15], telomerase reverse transcriptase (TERT) [16], H3 histone family member 3A (H3F3A) and histone cluster 1 H3 family member B or C (HIST1H3B/C) [17], B-Raf proto-oncogene, serine/threonine kinase (BRAF) [18] and KIAA1549-BRAF fusion [19], deletions of cyclin dependent kinase inhibitor 2A or 2B (CDKN2A/B) [20], fusions of RELA proto-oncogene, NF-KB subunit (RELA) [21], catenin-beta 1 (CTNNB1) referred to the group of wingless-type MMTV integration site family (WNT) [22], or PTCH and SUFU within sonic hedgehog signaling molecule (SHH)-activated subgroup [13, 23].
Over time, brain tumor classification systems have been and are, still, evolving [24]. Molecular signatures in adult gliomas have been explored and show certain subtypes in dependence on age [25, 26]. By using graph analysis on existing data we highlighted disturbed signaling components in brain cancer subtypes of gliomas [27]. Information exists on prominent mutations within gliomas that suggests different biomarkers for specific age groups [28, 29]. Further, alterations have been shown to be prevalent for specific age groups by the comparison of older and young adults [30].
Some tumors primarily occur in children, such as diffuse midline gliomas with their molecular feature of mutated H3F3A or HIST1H3B/C [31]. Pilocytic astrocytomas are common for pediatric but not elderly patients and frequently exhibit BRAF mutations and fusion transcripts [32]. Pediatric HGG frequently include PDGFR- amplification different to the adult equivalent [33]. And gliomas from younger children rarely exhibit IDH mutations [34].
In spite of medical advances in cancer diagnosis and treatment, for instance, GBM treatment remains to be mostly the same (old) approach across all ages, surgery followed by radiotherapy and only occasionally more targeted chemotherapy [35]. Still, a well-tolerated therapy by adults may not be likewise applicable for a pediatric patient due to the ongoing brain development.
The older population can also be subdivided into an adult group and patients with a more advanced age. Thereby, elderly show different clinical pictures, such as larger tumor mass and distinct prognostic biomarkers [36]. The elderly population commonly refers to patients older than 65 or 70 years of age, while the term “elderly” is defined as a specific age threshold. This threshold, however, varies with geographical, social, and cultural factors [37].
Overall, novel biomarkers of brain tumors will be used for more detailed diagnostics, prognosis, therapy response control as well as targets for anti-cancer therapy towards personalized medicine [38]. So far, various targets within the signaling cascades of growth factor receptors, cell cycle, angiogenesis, antitumor immune responses and epigenetic modulators have been investigated for therapy [39]. In general, cancer signaling in glioma is predominated by angiogenesis-related pathways involving MAPK, VEGF and EFGR [40]. There are several therapeutics targeting for instance VEGF, EGFR, PDGFRa, PTEN, MDM2 [38]. Still, the heterogeneous intra-tumor microenvironment demands for new strategies. Furthermore, meaningful biological subgroups are necessary to guide the design of future clinical trials [41].
We use an explainable artificial intelligence (XAI) method, i.e. SHAP, on clinical and gene mutation data to classify and explain age-related subgroups within various gliomas.
Methods
Data and preprocessing
The graphical abstract is shown in Fig. 1. We use data from glioma samples, including both LGG and HGG, out of 18 different projects from pedcbioportal [42, 43] via https://tinyurl.com/y5d8gubl and of 5 more projects from cbioportal via https://tinyurl.com/y2s2ogez. Both web-portals offer clinical data such as age as well as mutation details. Clinical data can be obtained through the “download” option in both web-portals. The column “mutated genes” within the overview of the web user interface (UI) can be further used to download mutation details. To overcome the query limit of max 167 different gene IDs, we further sorted the exported clinical data file by mutation count and selected only those genes that have mutations. Thereby, we limited the query to the 140 top mutated genes. This list contains genes with highest mutation frequency, preceded by TP53, followed by TERT, then IDH1, etc. The 140 genes are provided as list of gene symbols as additional file 1 and on https://github.com/radiance/glioma-mutations-xai/. Filtered mutation data can be downloaded by querying the selected 140 gene names within the 18 projects from pedcbioportal as well as the 5 selected studies from cbioportal, each specified as link above.
Fig. 1.

Graphical abstract
Queried genes in pedcbioportal’s projects’ data are altered in 4210 (77%) of queried patients and 4614 (77%) of queried samples. Queried genes in cbioportal’s provided projects’ data are altered in 3032 (96%) of queried patients and 3165 (96%) of queried samples.
We extracted those columns that are relevant for clustering and classification including sample id, age and mutation count. We removed duplicated rows (such as from pbta_all and plgg_cbttc that contain parts of the same samples). We further processed the different studies’ columns by merging similar columns. Labels for clinical metadata concerning age can vary from capitalized “Age” (phgg_jones_meta_2017) and uppercase “AGE” (pbta_all, pbta_pnoc, phgg_cbttc), or “Diagnosis Age” (lgg_tcga, lgg_ucsf, gbm_tcga). We thereby excluded samples with empty or incomplete information on age as well as recurrence samples or duplicates.
We further processed mutation data. The value “na” stands for 0 mutations. Any other string represents a mutated gene. If there is a blank between characters, there are multiple mutations listed within the field. “Mutation strings” per gene can be found in the mutations.txt file. Mutation details on amino acid-changes within the specified genes are included.
Most studies provide age data as integer values. Therefore, a few samples with floating point numbers were rounded to be comparable to other integer values. We removed samples without suitable age information. Merged, filtered and reduced data covers only 2894 sample lines of 14 different projects with an age range from 0 to 90, a mutation count from 0 to 14063 and the several mutation types according to the 140 selected mutated genes. Due to this filtering process of incomplete data, 87 genes remain of the previously 140 selected genes.
Age distribution is visualized in Figs. 2a and 3. Sample count per study distribution is visualized in Fig. 2b. Processed data is available as additional file 2 and on https://github.com/radiance/glioma-mutations-xai/.
Fig. 2.

Glioma sample data distribution
Fig. 3.

Top 10 mutated genes distribution
Workflow
Both clustering and classification were used to explore age-related differences in glioma diseases. We took an XAI approach to compare conventional age groups and to explore possible new age groups. Within the first classification approach the following age groups were assumed:
Age group 0: age below 19
Age group 1: age 19 to 70
Age group 2: age greater than 70
We compared classifier performance by using means and standard deviation from stratified k-fold cross-validation. We selected a Random Forest approach, the best algorithm according to results from the classifier comparison, shown in Table 1. We selected the top 20 mutated genes as features. To better explain classifier results we applied SHAP (SHapley Additive exPlanations) [44] to summarize the effects of all the selected features. In parallel, we started a separate clustering approach to explore possible novel age groups. We applied a K-Means algorithm. We further used XAI principles and visually analyzed each step. Final clustering results are visualized in Fig. 5.
Table 1.
Model comparison for classifying traditional and updated age groups (bold: best results)
| Ages 0–18, 19–70, 70+ | Ages 0–22, 23–48, 48+ | Ages 0–9, 10–26, 27–50, 50+ | ||||
|---|---|---|---|---|---|---|
| Mean | SD | Mean | SD | Mean | SD | |
| Random Forest | 0.792226 | 0.018431 | 0.709313 | 0.035924 | 0.580960 | 0.034479 |
| Linear Discriminant | 0.733046 | 0.028101 | 0.671703 | 0.031654 | 0.545130 | 0.031640 |
| K Neighbors | 0.738271 | 0.027061 | 0.603038 | 0.037627 | 0.473873 | 0.020474 |
| Decision Tree | 0.758096 | 0.012999 | 0.683384 | 0.031697 | 0.552452 | 0.033747 |
| Gaussian Naive Bayes | 0.225052 | 0.018959 | 0.500274 | 0.052508 | 0.358057 | 0.059829 |
| C-Support Vector | 0.718389 | 0.015940 | 0.561992 | 0.038804 | 0.445800 | 0.027187 |
| Logistic Regression | 0.750756 | 0.019220 | 0.665224 | 0.035580 | 0.549440 | 0.029133 |
Fig. 5.
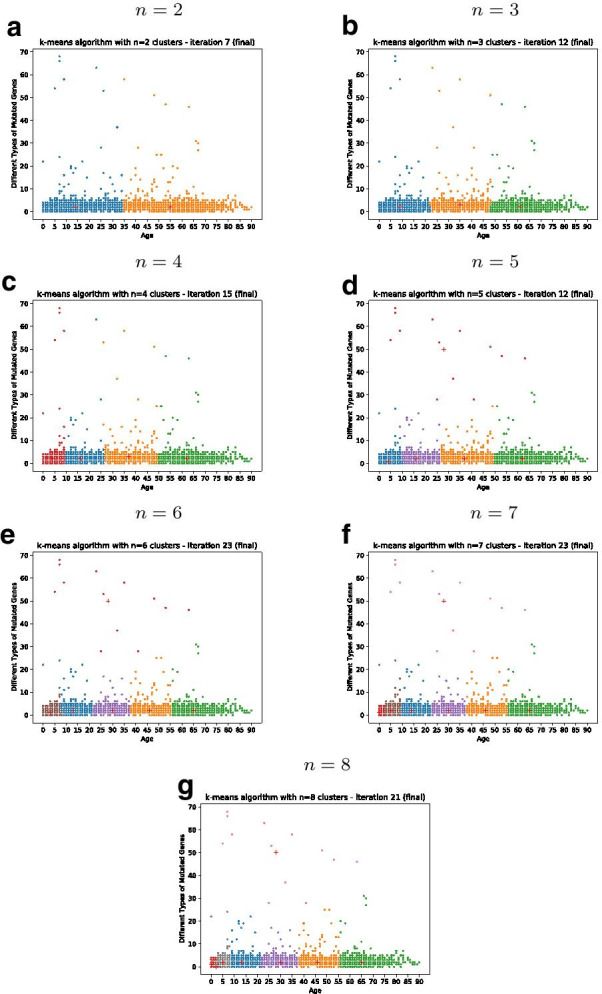
Results from gene-based clustering of age groups with different number of clusters n
We applied the clustering for the number of clusters to , as suggested by the elbow method and the silhouette coefficient, shown in Fig. 4.
Fig. 4.

Performance functions for different number of clusters
Based on the visual clustering results, shown in Fig. 5, we repeated the first classification approach adapted to the three age groups as well as the four groups accordingly.
Implementation
We implemented both a clustering as well as a classification algorithm in Python. Source code for both clustering as well as classification is available on https://github.com/radiance/glioma-mutations-xai.
Clustering
Clustering is based on a K-Means algorithm using Scikit-learn [45]. We further used the python libraries Pandas [46], Numpy, Matplotlib and Seaborn for data processing and visualizing results.
Classification
We used Scikit-learn [45] for implementing the classifiers. We used Pandas [46] for data structuring and manipulation. SHAP (SHapley Additive exPlanations) [44] was used for explainable artificial intelligence (XAI) results. We processed data and visualized the results using SHAP, Pandas and Matplotlib library.
For comparison, we repeated the classification using suggested age groups from clustering.
Results
Glioma sample disposition across age and clustering of age groups
Age groups are defined by using gene mutation data collected from various glioma projects. Distribution metrics of downloaded samples are shown in Figs. 2a, b and 3. Raw data included an overall of 9264 data rows, with 5961 from the studies selected via pedcbioportal and 3303 via cbioportal. After first filtering and merging data, the comma-separated values (csv) file included only 5478 data rows. The other 3786 were removed due to incompleteness and/or inappropriateness of available metadata. The column mutation count is available for only 5628 out of 6396 (768 samples not available and/or 0). This means that the 140 queried genes are altered in only 77% of selected data. The overall mutation count is not available for all samples and non-uniformly distributed over age. On the one hand, this can be explained by the fact that web portals limit query size, at least via the web user interface we used. On the other hand, pedcbioportal offered more resources on children than adult patients. Therefore, we added additional adult samples from cbioportal in order to have a more balanced age distribution. Still, we find a higher number of different mutated genes in younger patients. Finally, we excluded samples with empty or incomplete information on age and/or mutation count as well as recurrence samples and duplicates. After data cleansing, 2894 samples are left for clustering and classification experiments.
The number of clusters n of the K-Means algorithm can be adjusted. By computing both the sum of the squared error (SSE) as well as the silhouette coefficient, shown in Fig. 4, cluster numbers of are suggested. Different clustering results for are shown in Fig. 5. The K-Means clustering for clusters reveals three distinctive age groups after multiple iterations:
Class 1: age below 23
Class 2: age 23 to 48
Class 3: age greater than 48
The K-Means clustering for clusters reveals the four distinctive age groups:
Class 1: age below 10
Class 2: age 10 to 26
Class 3: age 27 to 50
Class 4: age greater than 50
Figure 5 shows a cluster number to show higher dissimilarity within at least one cluster (the red group in ). In case of there is at least one cluster distributed over a wide range of age.
Figure 14 and Table 2 illustrate top mutated genes of age groups from conventional and updated classes. The chart illustrates several genes associated with age. For instance, H3F3A, AHNAK2, SOX1, SUSD2 and KMT2C are most frequently mutated in young age classes. PIK3CA and TERT are upon top mutated genes within adult samples and RYR2 mutations are more frequent within older adults.
Fig. 14.

Distribution of top mutated genes within various age groups: examples from top 20 mutated genes among selected age groups of children, young adults and elderly patients suffering from glioma
Table 2.
Age class-specific top mutated genes: top 20 mutated genes within traditional or updated age groups from clustering within selected glioma projects
| 0–9 | 0–18 | 0–22 | 9–26 | 18–70 | 23–48 | 26–50 | 48+ | 70+ |
|---|---|---|---|---|---|---|---|---|
| TTN | TTN | TTN | TP53 | TP53 | IDH1 | IDH1 | TP53 | TP53 |
| AHNAK2 | TP53 | TP53 | ATRX | IDH1 | TP53 | TP53 | PTEN | PTEN |
| TP53 | AHNAK2 | AHNAK2 | IDH1 | ATRX | ATRX | ATRX | TTN | TTN |
| AHNAK | H3F3A | AHNAK | TTN | PTEN | CIC | CIC | EGFR | TERT |
| H3F3A | AHNAK | H3F3A | AHNAK2 | TTN | TTN | TTN | IDH1 | EGFR |
| MUC17 | FLG2 | ATRX | H3F3A | TERT | TERT | TERT | NF1 | NF1 |
| MUC16 | MUC17 | FLG2 | FLG2 | EGFR | NOTCH1 | PTEN | MUC16 | PIK3R1 |
| FLG2 | MUC16 | MUC17 | NF1 | CIC | PTEN | PIK3CA | PIK3CA | PIK3CA |
| PHLPP1 | PHLPP1 | MUC16 | ERBB2 | NF1 | PIK3CA | NOTCH1 | PIK3R1 | MUC16 |
| OBSCN | RAMP2 | OBSCN | BRAF | PIK3CA | NF1 | NF1 | FLG | RB1 |
| KMT2D | ATRX | NF1 | RAMP2 | MUC16 | FUBP1 | FUBP1 | TERT | MUC17 |
| SUSD2 | KMT2D | RAMP2 | MUC16 | NOTCH1 | EGFR | EGFR | CIC | PCLO |
| SOX1 | OBSCN | KMT2D | AHNAK | PIK3R1 | KMT2D | KMT2D | RYR2 | RYR2 |
| NF1 | NF1 | PHLPP1 | MUC17 | FUBP1 | MUC16 | MUC16 | ATRX | IDH1 |
| ATRX | BRAF | BRAF | CIC | KMT2D | SMARCA4 | SMARCA4 | RB1 | FLG |
| KMT2C | SUSD2 | IDH1 | KMT2D | FLG | PIK3R1 | PIK3R1 | PCLO | USH2A |
| RAMP2 | SOX1 | KMT2C | TEX13D | RB1 | ARID1A | ARID1A | SPTA1 | CIC |
| SVIL | KMT2C | SUSD2 | KMT2C | RYR2 | RB1 | RB1 | LRP2 | PDGFRA |
| MKI67 | TEX13D | SOX1 | CTNNB1 | LRP1 | BCOR | RYR2 | MUC17 | ATRX |
| ISM2 | SVIL | TEX13D | PIK3CA | SMARCA4 | NOTCH2 | ATM | PKHD1 | HMCN1 |
Classification of age-related mutation data among gliomas
Selected age groups are compared and classified by their gene mutation signatures. At least three age groups can be distinguished from incidence reports and further studies [47, 48]. Therefore, the first classification approach is based on conventional age groups from 0–18, 19–70 and 70+.
The comparison of classifier performances suggests a Random Forest algorithm, as shown in Table 1, resulting in the best mean and standard deviation (SD). The first classification approach with 0–18, 19–70, 70+ has an accuracy of 78.41% and shows important features for age classes.
Adapting the classifier regarding the younger group to 0–22, 23–70, 70+ the accuracy drops minimally to 78.07%. Adapting the classifier regarding the older group to 0–18, 19–48, 48+ the accuracy drops to 73.58%. The adapted classifier with both groups adapted to 0–22, 23–48, 48+, as suggested by clustering results, has again a minimal lower accuracy of 72.54%. Adapting the classifier to the four suggested classes 0–9, 10–26, 27–50, 50+ lowers the accuracy further to 59.24%. An increased range of the adult age group, such as for 0–9, 10–18, 19–70, 70+, increases the accuracy to 69.08%. The use of two clusters ranging from 0–34 and 34+ leads to a classifier accuracy of 75.82%.
Figure 6 shows that the updated 0–22, 23–48, 48+ classifier results in a lower number of correct predictions than the first classifier with 0–18, 19–70, 70+ (420 versus 454 from overall 579). The classifier in case of four age groups shows 343 correct predictions out of 579. By comparing Tables 1 and 3 it is also shown that computed clusters are not improving the classifier’s overall performance but have impact on age group specifics. Table 3 shows precision and recall scores for the classifier versions 0–18, 19–70, 70+ and 0–22, 23–48, 48+ and 0–9, 10–26, 27–50, 50+. Comparing the youngest age group, both 3 age groups classifiers show similar results, while the 0–18, 19–70, 70+ classifier suits the middle group better, and the updated version with 0–22, 23–48, 48+ classifier performs well for the older age group. Predicting age group 50+ works best with the 0–9, 10–26, 27–50, 50+ classifier of four age groups.
Fig. 6.

Comparison of classifier confusion matrices, showing classifier performance (darker means better prediction)
Table 3.
Performance report for classifier with traditional and updated age groups (bold: highest performing age group compared to other age groups)
| Age classes | id | Precision | Recall | f1 score |
|---|---|---|---|---|
| 0–18 | 1 | 0.79 | 0.76 | 0.77 |
| 19–70 | 2 | 0.81 | 0.87 | 0.84 |
| 70+ | 3 | 0.11 | 0.05 | 0.07 |
| 0–22 | 1 | 0.75 | 0.85 | 0.80 |
| 23–48 | 2 | 0.69 | 0.67 | 0.68 |
| 48+ | 3 | 0.72 | 0.64 | 0.68 |
| 0–9 | 1 | 0.57 | 0.60 | 0.58 |
| 10–26 | 2 | 0.46 | 0.34 | 0.39 |
| 26–50 | 3 | 0.65 | 0.64 | 0.64 |
| 50+ | 4 | 0.62 | 0.71 | 0.66 |
Feature importance of the classifiers 0–18, 19–70, 70+ and 0–22, 23–48, 48+ are shown in Fig. 7.
Fig. 7.

Comparison of classifier features (classes sorted by performance)
IDH1 and TP53 stay most important for classification among all classification schemes. There is a shift in importance of some other features and their association with individual age groups is changed. TERT, for instance, is highly important for the middle age group from traditional classes, its importance is shifted to the older adults from the updated classes. MUTYH has a smaller importance on the updated middle age class. So far, MUTYH mutations are infrequent and have been shown in pediatric patients to increase risk of malignant brain tumors [49].
The SHAP summary plot for the four classes 0–9, 10–26, 27–50, 50+ shows feature importance for the classification of the four suggested age groups from the clustering results. It is indicated, that IDH1 is most important for the age group of 27 to 50. TERT is most important for age group 50+.
Figures 8 and 9 show SHAP values for the top 20 features for each class separately. A positive SHAP value increases the prediction, a negative value decreases the prediction. Features are ranked in descending order. X-axes positions refer to low up to high impact on prediction. Dots are stacked on the y-axes and refer to the concentration or respective amount of observations for a shap value. The color shows whether a shap variable is high (in red) or low (in blue) for an observation.
Fig. 8.

Impact of the top 20 features for each of the classes 0–18, 19–70, 70+
Fig. 9.

Impact of the top 20 features for each of the classes 0–22, 23–48, 48+
IDH1 has a negative impact on class 0–18 and 0–22, a positive one on class 19–70 and on 23–48, and a negative on 48+ and 70+. BCORL1 has a positive impact on classes 0–18 and 0–22 and a negative on the classes 18–70, 23–48, 48+ and 70+. KMT2D has a positive impact on young and a negative one on older age classes, whereas a high value of KMT2A has a negative impact on young and a positive on older age classes. Many other features are ambiguous.
Comparison of HGG and LGG classifications
We further filtered data on LGG and HGG, respectively. Only a small subset of the data can be used for this comparison of subtypes. This is due to the fact that most studies contain general glioma data. Only a few studies explicitly contain either LGG-specific samples (lgg_tcga, lgg_tcga_pan_can_atlas, lgg_ucsf_2014, plgg_cbttc) or HGG-specific samples (gbm_tcga, gbm_tcga_pan_can_atlas, phgg_cbttc, phgg_herby, phgg_jones_meta_2017).
LGG specific data rows are 1047, HGG are 511. Figure 10 shows the distribution of data on LGG and HGG filtered samples. The prediction of the HGG classifier for the three age classes 0–18, 19–70 and 70+ has an accuracy of 67.96%, and the accuracy for LGG is 93.33%.
Fig. 10.

LGG and HGG specific sample data distribution per age
The prediction accuracy of the updated HGG Classifier is 77.67% and for LGG 73.33%. So, the updated version performs better for HGG, while the more traditional age classes perform better with LGG-filtered data. Figure 11 shows IDH1 and TERT to be most relevant in LGG for the younger and middle age class, while BCORL1 being more dominant in HGG. Feature importance of updated classes to classify LGG and HGG are shown in Fig. 12, which highlights IDH1 as important feature for classifying the HGG younger and middle age class, and BCORL1 is more dominant for classifying the LGG younger and middle age class.
Fig. 11.

Comparison of Classifier feature importance for age classes 0–18 (blue), 19–70 (orange), 70+ (green); classes sorted by performance
Fig. 12.

Comparison of updated classifier features for age classes 0–22 (blue), 23–48 (orange), 48+ (green), classes sorted by performance
Figure 13 shows estimates for classifier feature importance of classifying the 4 suggested age classes 0–9, 10–26, 27–50 on each HGG and LGG filtered data. When using different instead of the updated classes, IDH1 remains a dominant feature for age class 27–50 regarding LGG. TERT is the most important feature for classifying the youngest age group 0–9 regarding LGG. Regarding HGG, BCORL1 becomes more important for age class 50+. Comparing Feature importance for the four age classes in Figs. 12 as well as 13 shows that ATRX is less important for the youngest age group 0–9.
Fig. 13.

Comparison of updated classifier features for age classes 0–9 (green), 10–26 (red), 27–50 (orange), 50+ (blue); classes sorted by performance
Figures 11, 12 and 13 further illustrate comparable importance of ATRX for all classifiers. ATRX functions as tumor suppressor and is involved in p53 signaling [50]. It has been negatively associated with TERT mutations [51]. TERT is among top 4 mutated genes in LGG and less important in HGG classes. IDH1 is the most important gene mutation succeeding TERT within LGG classification using the traditional age classes, and remains important in updated classifiers. In case of HGGs, IDH1 holds only 7th place, and in updated age classes 5th and 4th. BCORL1 is involved in tumor progression and respective mutations occur in HGGs and LGGs [52]. Still, BCORL1 is relevant for classification of HGG only. KMT2 proteins occur both in HGG and LGG under top 10 features in all classifiers. Thereby, KMT2A appears in top 5 most important features in HGG, whereas KMT2D under top 8 in LGG.
Discussion
The main idea is to use classification as well as clustering to explore age-related differences in glioma diseases in order to find possible novel age group-specific biomarkers. We already highlighted top ten mutated genes within pediatric glioma samples from data amongst several pediatric resources, namely BRAF, TP53, KIAA1549, H3F3A, ATRX, IDH1, CDR2, PIK3CA, NF1, C17ORF47, in this order regarding mutation frequency [28]. The summary of all selected projects from pedcbioportal and cbioportal indicate age-specific mutation frequency for several genes.
Prognostic and therapeutic biomarkers for brain cancers differ between patients depending on their age. Genetic alterations in brain tumor samples show distinct gene mutation signatures related to age groups and may support the identification of novel biomarkers.
Glioma classification could be updated according to age-groups in relevance to diagnostics, therapy possibilities and clinical decision-making. We present unusual age groups for glioma classification based on gene mutation signatures. Therefrom several genes emerge as characteristics for specific age classes. The view on top ranked mutated genes in distinct age groups highlights differences in regard to diagnostics. Some genes relevant to one group could be irrelevant to another group but a previous unimportant gene could emerge as a major biomarker.
Representative age clusters disclose gene mutations as age-specific biomarkers. The clustering algorithm depicted several distinct groups but also some adjacent and marginally overlapping clusters. In case of three age clusters there is a young group up to 22 years and the middle group up to 48 years. Some sample points within the region of cluster borders may be falsely allocated. This problem would be of less importance if age was calculated in days or months instead of years.
Regarding classification performance there are several optimization possibilities. First, the higher the sample number within an age class, the higher the classifier’s accuracy. Including a higher number of data samples will improve the accuracy. Regarding data quality, even a great portal as pedcbioportal depends on data providers to allocate comparable study data. Therefore, improving the quality of clinical data, such as consistently providing more details on age at diagnosis, would further improve accuracy and specificity. Moreover, identifying cancer subtype-specific top mutated genes and using these instead of the 140 selected gene symbols, may also improve the classifier’s performance.
By comparing classifier performance, as can be seen in Fig. 6, the updated classifier for the middle group is worse rated, compared to the younger and the older age groups, which perform better. The quality of performance is demonstrated by the count in the diagonal from top left to bottom right. A higher count refers to better performance.
It can be observed, that in the first classifier version with age classes 0–18, 19–70, 70+, the middle group performs best. Nonetheless, if the goal is to detect members of one specific class rather than having a minimal better overall accuracy, one may have a closer look at the feature importance comparison, as shown in Fig. 7.
Some features are more important for specific classes. Exemplary, IDH1 is less important for the oldest age group. This can be explained insofar as IDH1 is known to be most common in LGG [53] and a substantial number of samples are from patients with LGG. By comparing both plots of classifier feature importance, shown in Fig. 7, one may observe certain changes in feature rankings.
Class-specific top mutated genes point out several genes in correlation to age. In case of young age groups, there are some genes implicated to other cancers whose role in glioma has to be elucidated, yet, like AHNAK2 and SUSD2 [54, 55]. SOX1 has been implicated with glioma, while SOX2 has been depicted as unfavorable prognostic marker [56, 57]. Older age groups include well-known biomarkers such as TERT, PTEN and NF1 which are not within the most frequent mutated genes within younger patients [58, 59].
The comparison of high and low grade gliomas further depicts several gene mutations distinct to glioma grades. Top 20 mutated gene lists from classification experiments on HGG or LGG data include either KMT2A in HGG, or KMT2D in LGG in all classification modes. Additionally, KMT2A was negatively implicated in young age classes and positively implicated in older age groups. KMT2D was inversely associated. Such observations can help elucidate the role of KMT2 proteins in tumor progression and as driver or passenger mutations in future aspect of clinical implication for the Lysine Methyltransferase 2 family [60]. Within the top 20 list of HGG age group classification several genes are highlighted that have not been associated with glioma classification, yet. Depending on their shap value they could become important for a defined age-group. Future studies will elucidate a possible clinically relevant role.
Possible misconceptions when quantifying feature relevance using Shapley values were described by [61]. Therefore, future work should further test SHAP explanations with different stakeholders [62, 63].
Amongst the top 20 mutated genes of pediatric-only patient data from pedcbioportal, there are e.g. LRP1 and HSPG2 that are not within the list of selected 140 query-genes. This query-list consists of the overall top 140 mutated genes from all the selected pedcbioportal data.
We attempted to compare various subgroups of glioma diseases, however, the lack of meta-information regarding cancer type specificity of samples did not allow for sub-classification of LGG. Thus, future studies and additional data resources are necessary for a more detailed analysis. Still, the comparison of the distinct subgroups of HGG and LGG highlights the differences within the heterogeneous disease group of gliomas. Likewise, classification by grades I-IV would require more detailed meta-information or sample designation.
For future studies, it can be useful taking other variables into account in combination with age, such as analyzing fusion genes, gene expression, post-translational modifications depending on data availability or additional clinical data including therapy details.
Conclusions
The idea of questioning known age groups in glioma classification offers new perspectives. Certain biomarkers are already associated with certain age groups. Changing age margins results in the movement of features to other age groups. These age-associated features resemble possible targets and biomarkers, that may lead to different diagnosis and treatment strategies. Nonetheless, it would be interesting to see better classifier difference when dealing with specific glioma subclasses. Therefore, future work based on the extension of this research requires additional glioma-grade-specific data to better compare specific glioma subtypes.
Supplementary Information
Additional file 1. List of top mutated 140 genes used for query.
Additional file 2. Raw Mutation data downloaded from pedcbioportal and cbioportal, filtered, processed, merged and again filtered, provided as semicolon separated file as used in the python scripts.
Acknowledgements
We thank the PedcBioPortal maintainers and its collaborators for providing data on cancer and all the other data providers to make open science possible at all. We dedicate our work in memoriam to our family members and friends we have lost. If we may contribute even tiny steps to help to save lives in the future our mission was worth our passion, enthusiasm and effort. Please visit our project homepage at: https://hci-kdd.org/project/tugrovis
Abbreviations
- ATRX
Alpha thalassemia/mental retardation syndrome X-linked chromatin remodeler
- BCORL1
BCL6 corepressor like 1
- BRAF
B-Raf proto-oncogene, serine/threonine kinase
- CDKN2A/B
Cyclin dependent kinase inhibitor 2A or 2A
- CTNNB1
Catenin beta 1
- GBM
Glioblastoma multiform
- H3F3A
H3 histone family member 3A
- HIST1H3B/C
Histone cluster 1 H3 family member B or C
- HGG
Higher grade glioma
- IDH1
Isocitrate dehydrogenase 1
- LGG
Lower grade glioma
- RELA
RELA proto-oncogene, NF-KB subunit
- SD
Standard deviation
- SHAP
Shapley additive explanations
- SHH
Sonic hedgehog signaling molecule
- TCGA
The Cancer Genome Archive
- TERT
Telomerase reverse transcriptase
- TP53
Tumor protein P53
- UI
User interface
- WNT
Wingless-type MMTV integration site family
- XAI
Explainable artificial intelligence
Authors' contributions
Idea, FJ and CJ and AH; data curation, FJ and CJ; implementing clustering , AR, KM, TM, implementing classifier, TS, RM, MJ; code review and refinement, FJ; data processing and analysis: FJ and CJ; supervision: CJ, FJ and AH; writing original draft, FJ and CJ; review and editing, FJ, CJ, AH. All authors read and approved the final manuscript.
Funding
This research received no external funding.
Availability of data and materials
The data used in the present study are publicly available and have been downloaded from the public data repositories pedcbioportal and cbioportal. Sourcecode and processed data are available onhttps://github.com/radiance/glioma-mutations-xai.
Ethics approval and consent to participate
Not applicable.
Consent for publication
Not applicable.
Competing interests
The authors declare that they have no competing interests.
Footnotes
Publisher's Note
Springer Nature remains neutral with regard to jurisdictional claims in published maps and institutional affiliations.
Claire Jean-Quartier and Fleur Jeanquartier contributed equally to this work
Contributor Information
Claire Jean-Quartier, Email: c.jeanquartier@hci-kdd.org.
Fleur Jeanquartier, Email: fleur.jeanquartier@tugraz.at.
Andreas Holzinger, Email: a.holzinger@hci-kdd.org.
Supplementary Information
The online version contains supplementary material available at 10.1186/s12911-021-01420-1.
References
- 1.Siegel RL, Miller KD, Jemal A. Cancer statistics, 2019. CA Cancer J Clin. 2019;69(1):7–34. doi: 10.3322/caac.21551. [DOI] [PubMed] [Google Scholar]
- 2.Ijaz H, Koptyra M, Gaonkar KS, Rokita JL, Baubet VP, Tauhid L, Zhu Y, Brown M, Lopez G, Zhang B, et al. Pediatric high grade glioma resources from the children’s brain tumor tissue consortium (CBTTC) and pediatric brain tumor atlas (PBTA). BioRxiv. 2019;656587. [DOI] [PMC free article] [PubMed]
- 3.Gupta A, Dwivedi T. A simplified overview of world health organization classification update of central nervous system tumors 2016. J. Neurosci. Rural Pract. 2017;8(4):629. doi: 10.4103/jnrp.jnrp_168_17. [DOI] [PMC free article] [PubMed] [Google Scholar]
- 4.Haggiagi A, Lassman AB. Newly diagnosed glioblastoma in the elderly: when is temozolomide alone enough? Oxford: Oxford University Press; 2020. [DOI] [PMC free article] [PubMed] [Google Scholar]
- 5.El-Ayadi M, Ansari M, Sturm D, Gielen GH, Warmuth-Metz M, Kramm CM, von Bueren AO. High-grade glioma in very young children: a rare and particular patient population. Oncotarget. 2017;8(38):64564. doi: 10.18632/oncotarget.18478. [DOI] [PMC free article] [PubMed] [Google Scholar]
- 6.Vigneswaran K, Neill S, Hadjipanayis CG. Beyond the world health organization grading of infiltrating gliomas: advances in the molecular genetics of glioma classification. Ann Transl Med. 2015;3(7):95. doi: 10.3978/j.issn.2305-5839.2015.03.57. [DOI] [PMC free article] [PubMed] [Google Scholar]
- 7.Nishikawa R. Pediatric and adult gliomas: how different are they? Oxford: Oxford University Press; 2010. [DOI] [PMC free article] [PubMed] [Google Scholar]
- 8.Zapotocky M, Ramaswamy V, Lassaletta A, Bouffet E. Adolescents and young adults with brain tumors in the context of molecular advances in neuro-oncology. Pediatric Blood Cancer. 2018;65(2):26861. doi: 10.1002/pbc.26861. [DOI] [PubMed] [Google Scholar]
- 9.Arcella A, Limanaqi F, Ferese R, Biagioni F, Oliva MA, Storto M, Fanelli M, Gambardella S, Fornai F. Dissecting molecular features of gliomas: genetic loci and validated biomarkers. Int J Mol Sci. 2020;21(2):685. doi: 10.3390/ijms21020685. [DOI] [PMC free article] [PubMed] [Google Scholar]
- 10.Zhang L, Liu Z, Li J, Huang T, Wang Y, Chang L, Zheng W, Ma Y, Chen F, Gong X, et al. Genomic analysis of primary and recurrent gliomas reveals clinical outcome related molecular features. Sci Rep. 2019;9(1):1–8. doi: 10.1038/s41598-018-37186-2. [DOI] [PMC free article] [PubMed] [Google Scholar]
- 11.Molinaro AM, Taylor JW, Wiencke JK, Wrensch MR. Genetic and molecular epidemiology of adult diffuse glioma. Nat Rev Neurol. 2019;15(7):405–417. doi: 10.1038/s41582-019-0220-2. [DOI] [PMC free article] [PubMed] [Google Scholar]
- 12.Boots-Sprenger SH, Sijben A, Rijntjes J, Tops BB, Idema AJ, Rivera AL, Bleeker FE, Gijtenbeek AM, Diefes K, Heathcock L, et al. Significance of complete 1p/19q co-deletion, IDH1 mutation and MGMT promoter methylation in gliomas: use with caution. Mod Pathol. 2013;26(7):922–929. doi: 10.1038/modpathol.2012.166. [DOI] [PubMed] [Google Scholar]
- 13.Villa C, Miquel C, Mosses D, Bernier M, Di Stefano AL. The 2016 world health organization classification of tumours of the central nervous system. Presse Méd. 2018;47(11–12):187–200. doi: 10.1016/j.lpm.2018.04.015. [DOI] [PubMed] [Google Scholar]
- 14.Nandakumar P, Mansouri A, Das S. The role of ATRX in glioma biology. Front Oncol. 2017;7:236. doi: 10.3389/fonc.2017.00236. [DOI] [PMC free article] [PubMed] [Google Scholar]
- 15.Rasheed BA, McLendon RE, Herndon JE, Friedman HS, Friedman AH, Bigner DD, Bigner SH. Alterations of the TP53 gene in human gliomas. Cancer Res. 1994;54(5):1324–1330. [PubMed] [Google Scholar]
- 16.Yang P, Cai J, Yan W, Zhang W, Wang Y, Chen B, Li G, Li S, Wu C, Yao K, et al. Classification based on mutations of TERT promoter and IDH characterizes subtypes in grade II/III gliomas. Neuro Oncol. 2016;18(8):1099–1108. doi: 10.1093/neuonc/now021. [DOI] [PMC free article] [PubMed] [Google Scholar]
- 17.Khuong-Quang D.-A, Buczkowicz P, Rakopoulos P, Liu X.-Y, Fontebasso A.M, Bouffet E, Bartels U, Albrecht S, Schwartzentruber J, Letourneau L, et al. K27m mutation in histone h3. 3 defines clinically and biologically distinct subgroups of pediatric diffuse intrinsic pontine gliomas. Acta Neuropathol. 2012;124(3):439–447. doi: 10.1007/s00401-012-0998-0. [DOI] [PMC free article] [PubMed] [Google Scholar]
- 18.Dougherty MJ, Santi M, Brose MS, Ma C, Resnick AC, Sievert AJ, Storm PB, Biegel JA. Activating mutations in BRAF characterize a spectrum of pediatric low-grade gliomas. Neuro Oncol. 2010;12(7):621–630. doi: 10.1093/neuonc/noq007. [DOI] [PMC free article] [PubMed] [Google Scholar]
- 19.Hawkins C, Walker E, Mohamed N, Zhang C, Jacob K, Shirinian M, Alon N, Kahn D, Fried I, Scheinemann K, et al. BRAF-KIAA1549 fusion predicts better clinical outcome in pediatric low-grade astrocytoma. Clin Cancer Res. 2011;17(14):4790–4798. doi: 10.1158/1078-0432.CCR-11-0034. [DOI] [PubMed] [Google Scholar]
- 20.Schmidt E, Ichimura K, Messerle K, Goike H, Collins V. Infrequent methylation of CDKN2A (MTS1/p16) and rare mutation of both CDKN2A and CDKN2B (MTS2/p15) in primary astrocytic tumours. Br J Cancer. 1997;75(1):2–8. doi: 10.1038/bjc.1997.2. [DOI] [PMC free article] [PubMed] [Google Scholar]
- 21.Parker M, Mohankumar KM, Punchihewa C, Weinlich R, Dalton JD, Li Y, Lee R, Tatevossian RG, Phoenix TN, Thiruvenkatam R, et al. C11orf95-RELA fusions drive oncogenic NF-κB signalling in ependymoma. Nature. 2014;506(7489):451–455. doi: 10.1038/nature13109. [DOI] [PMC free article] [PubMed] [Google Scholar]
- 22.Liu C, Tu Y, Sun X, Jiang J, Jin X, Bo X, Li Z, Bian A, Wang X, Liu D, et al. Wnt/beta-catenin pathway in human glioma: expression pattern and clinical/prognostic correlations. Clin Exp Med. 2011;11(2):105–112. doi: 10.1007/s10238-010-0110-9. [DOI] [PubMed] [Google Scholar]
- 23.Taylor MD, Liu L, Raffel C, Hui C-C, Mainprize TG, Zhang X, Agatep R, Chiappa S, Gao L, Lowrance A, et al. Mutations in SUFU predispose to medulloblastoma. Nat Genet. 2002;31(3):306–310. doi: 10.1038/ng916. [DOI] [PubMed] [Google Scholar]
- 24.Johnson DR, Guerin JB, Giannini C, Morris JM, Eckel LJ, Kaufmann TJ. 2016 updates to the who brain tumor classification system: what the radiologist needs to know. Radiographics. 2017;37(7):2164–2180. doi: 10.1148/rg.2017170037. [DOI] [PubMed] [Google Scholar]
- 25.Ceccarelli M, Barthel FP, Malta TM, Sabedot TS, Salama SR, Murray BA, Morozova O, Newton Y, Radenbaugh A, Pagnotta SM, et al. Molecular profiling reveals biologically discrete subsets and pathways of progression in diffuse glioma. Cell. 2016;164(3):550–563. doi: 10.1016/j.cell.2015.12.028. [DOI] [PMC free article] [PubMed] [Google Scholar]
- 26.Jiao Y, Killela PJ, Reitman ZJ, Rasheed BA, Heaphy CM, de Wilde RF, Rodriguez FJ, Rosemberg S, Oba-Shinjo SM, Marie SKN, et al. Frequent aTRX, CIC, FUBP1 and IDH1 mutations refine the classification of malignant gliomas. Oncotarget. 2012;3(7):709. doi: 10.18632/oncotarget.588. [DOI] [PMC free article] [PubMed] [Google Scholar]
- 27.Jean-Quartier C, Jeanquartier F, Holzinger A. Open data for differential network analysis in glioma. Int J Mol Sci. 2020;21(2):547. doi: 10.3390/ijms21020547. [DOI] [PMC free article] [PubMed] [Google Scholar]
- 28.Jeanquartier F, Jean-Quartier C, Holzinger A. Use case driven evaluation of open databases for pediatric cancer research. BioData Min. 2019;12(1):1–20. doi: 10.1186/s13040-018-0190-8. [DOI] [PMC free article] [PubMed] [Google Scholar]
- 29.Chen R, Smith-Cohn M, Cohen AL, Colman H. Glioma subclassifications and their clinical significance. Neurotherapeutics. 2017;14(2):284–297. doi: 10.1007/s13311-017-0519-x. [DOI] [PMC free article] [PubMed] [Google Scholar]
- 30.Ferguson SD, Xiu J, Weathers S-P, Zhou S, Kesari S, Weiss SE, Verhaak RG, Hohl RJ, Barger GR, Reddy SK, et al. Gbm-associated mutations and altered protein expression are more common in young patients. Oncotarget. 2016;7(43):69466. doi: 10.18632/oncotarget.11617. [DOI] [PMC free article] [PubMed] [Google Scholar]
- 31.Louis DN, Perry A, Reifenberger G, Von Deimling A, Figarella-Branger D, Cavenee WK, Ohgaki H, Wiestler OD, Kleihues P, Ellison DW. The 2016 world health organization classification of tumors of the central nervous system: a summary. Acta Neuropathol. 2016;131(6):803–820. doi: 10.1007/s00401-016-1545-1. [DOI] [PubMed] [Google Scholar]
- 32.Jones DT, Kocialkowski S, Liu L, Pearson DM, Bäcklund LM, Ichimura K, Collins VP. Tandem duplication producing a novel oncogenic BRAF fusion gene defines the majority of pilocytic astrocytomas. Cancer Res. 2008;68(21):8673–8677. doi: 10.1158/0008-5472.CAN-08-2097. [DOI] [PMC free article] [PubMed] [Google Scholar]
- 33.Paugh BS, Qu C, Jones C, Liu Z, Adamowicz-Brice M, Zhang J, Bax DA, Coyle B, Barrow J, Hargrave D, et al. Integrated molecular genetic profiling of pediatric high-grade gliomas reveals key differences with the adult disease. J Clin Oncol. 2010;28(18):3061. doi: 10.1200/JCO.2009.26.7252. [DOI] [PMC free article] [PubMed] [Google Scholar]
- 34.Pollack IF, Hamilton RL, Sobol RW, Nikiforova MN, Lyons-Weiler MA, LaFramboise WA, Burger PC, Brat DJ, Rosenblum MK, Holmes EJ, et al. Idh1 mutations are common in malignant gliomas arising in adolescents: a report from the children’s oncology group. Child’s Nerv Syst. 2011;27(1):87–94. doi: 10.1007/s00381-010-1264-1. [DOI] [PMC free article] [PubMed] [Google Scholar]
- 35.Jiang T, Mao Y, Ma W, Mao Q, You Y, Yang X, Jiang C, Kang C, Li X, Chen L, et al. CGCG clinical practice guidelines for the management of adult diffuse gliomas. Cancer Lett. 2016;375(2):263–273. doi: 10.1016/j.canlet.2016.01.024. [DOI] [PubMed] [Google Scholar]
- 36.Pérez-Larraya JG, Delattre J-Y. Management of elderly patients with gliomas. Oncologist. 2014;19(12):1258. doi: 10.1634/theoncologist.2014-0170. [DOI] [PMC free article] [PubMed] [Google Scholar]
- 37.Wick A, Kessler T, Elia AE, Winkler F, Batchelor TT, Platten M, Wick W. Glioblastoma in elderly patients: solid conclusions built on shifting sand? Neuro Oncol. 2018;20(2):174–183. doi: 10.1093/neuonc/nox133. [DOI] [PMC free article] [PubMed] [Google Scholar]
- 38.Jain KK. A critical overview of targeted therapies for glioblastoma. Front Oncol. 2018;8:419. doi: 10.3389/fonc.2018.00419. [DOI] [PMC free article] [PubMed] [Google Scholar]
- 39.Gupta SK, Kizilbash SH, Daniels DJ, Sarkaria JN. Targeted therapies for glioblastoma: a critical appraisal. Front Oncol. 2019;9:1216. doi: 10.3389/fonc.2019.01216. [DOI] [PMC free article] [PubMed] [Google Scholar]
- 40.Nakada M, Kita D, Watanabe T, Hayashi Y, Teng L, Pyko IV, Hamada J-I. Aberrant signaling pathways in glioma. Cancers. 2011;3(3):3242–3278. doi: 10.3390/cancers3033242. [DOI] [PMC free article] [PubMed] [Google Scholar]
- 41.Sturm D, Bender S, Jones DT, Lichter P, Grill J, Becher O, Hawkins C, Majewski J, Jones C, Costello JF, et al. Paediatric and adult glioblastoma: multiform (epi) genomic culprits emerge. Nat Rev Cancer. 2014;14(2):92–107. doi: 10.1038/nrc3655. [DOI] [PMC free article] [PubMed] [Google Scholar]
- 42.Gao J, Aksoy BA, Dogrusoz U, Dresdner G, Gross B, Sumer SO, Sun Y, Jacobsen A, Sinha R, Larsson E, et al. Integrative analysis of complex cancer genomics and clinical profiles using the cbioportal. Sci Signal. 2013;6(269):1–1. doi: 10.1126/scisignal.2004088. [DOI] [PMC free article] [PubMed] [Google Scholar]
- 43.Cerami E, Gao J, Dogrusoz U, Gross BE, Sumer SO, Aksoy BA, Jacobsen A, Byrne CJ, Heuer ML, Larsson E, et al. The cBio cancer genomics portal: an open platform for exploring multidimensional cancer genomics data. Cancer Discov. 2012;2:401–404. doi: 10.1158/2159-8290.CD-12-0095. [DOI] [PMC free article] [PubMed] [Google Scholar]
- 44.Lundberg SM, Lee S-I. A unified approach to interpreting model predictions. In: Guyon I, Luxburg UV, Bengio S, Wallach H, Fergus R, Vishwanathan S, Garnett R, editors. Advances in neural information processing systems 30. Red Hook: Curran Associates, Inc.; 2017. pp. 4765–4774. [Google Scholar]
- 45.Pedregosa F, Varoquaux G, Gramfort A, Michel V, Thirion B, Grisel O, Blondel M, Prettenhofer P, Weiss R, Dubourg V, et al. Scikit-learn: machine learning in Python. J Mach Learn Res. 2011;12:2825–2830. [Google Scholar]
- 46.McKinney W, Team P. pandas: powerful python data analysis toolkit. Pandas-Powerful Python Data Analysis Toolkit. 2015;1625.
- 47.Bleyer, A., O’leary, M., Barr, R., Ries, L., et al.: Cancer epidemiology in older adolescents and young adults 15 to 29 years of age, including seer incidence and survival: 1975–2000. In: Cancer epidemiology in older adolescents and young adults 15 to 29 years of age, including SEER incidence and survival: 1975–2000; 2006.
- 48.Arora RS, Alston RD, Eden TO, Estlin EJ, Moran A, Birch JM. Age-incidence patterns of primary CNS tumors in children, adolescents, and adults in England. Neuro Oncol. 2009;11(4):403–413. doi: 10.1215/15228517-2008-097. [DOI] [PMC free article] [PubMed] [Google Scholar]
- 49.Kline CN, Joseph NM, Grenert JP, van Ziffle J, Yeh I, Bastian BC, Mueller S, Solomon DA. Inactivating MUTYH germline mutations in pediatric patients with high-grade midline gliomas. Neuro Oncol. 2016;18(5):752–753. doi: 10.1093/neuonc/now013. [DOI] [PMC free article] [PubMed] [Google Scholar]
- 50.Oppel F, Tao T, Shi H, Ross KN, Zimmerman MW, He S, Tong G, Aster JC, Look AT. Loss of atrx cooperates with p53-deficiency to promote the development of sarcomas and other malignancies. PLoS Genet. 2019;15(4):1008039. doi: 10.1371/journal.pgen.1008039. [DOI] [PMC free article] [PubMed] [Google Scholar]
- 51.Liu J, Zhang X, Yan X, Sun M, Fan Y, Huang Y. Significance of TERT and ATRX mutations in glioma. Oncol Lett. 2019;17(1):95–102. doi: 10.3892/ol.2018.9634. [DOI] [PMC free article] [PubMed] [Google Scholar]
- 52.Astolfi A, Fiore M, Melchionda F, Indio V, Bertuccio SN, Pession A. BCOR involvement in cancer. Epigenomics. 2019;11(7):835–55. doi: 10.2217/epi-2018-0195. [DOI] [PMC free article] [PubMed] [Google Scholar]
- 53.Cohen A, Holmen S, Colman H. IDH1 and IDH2 mutations in gliomas. Curr Neurol Neurosci Rep. 2013;13(5):345. doi: 10.1007/s11910-013-0345-4. [DOI] [PMC free article] [PubMed] [Google Scholar]
- 54.Wang M, Li X, Zhang J, Yang Q, Chen W, Jin W, Huang Y-R, Yang R, Gao W-Q. AHNAK2 is a novel prognostic marker and oncogenic protein for clear cell renal cell carcinoma. Theranostics. 2017;7(5):1100. doi: 10.7150/thno.18198. [DOI] [PMC free article] [PubMed] [Google Scholar]
- 55.Cheng Y, Wang X, Wang P, Li T, Hu F, Liu Q, Yang F, Wang J, Xu T, Han W. SUSD2 is frequently downregulated and functions as a tumor suppressor in RCC and lung cancer. Tumor Biol. 2016;37(7):9919–9930. doi: 10.1007/s13277-015-4734-y. [DOI] [PubMed] [Google Scholar]
- 56.Berezovsky AD, Poisson LM, Cherba D, Webb CP, Transou AD, Lemke NW, Hong X, Hasselbach LA, Irtenkauf SM, Mikkelsen T, et al. Sox2 promotes malignancy in glioblastoma by regulating plasticity and astrocytic differentiation. Neoplasia. 2014;16(3):193–206. doi: 10.1016/j.neo.2014.03.006. [DOI] [PMC free article] [PubMed] [Google Scholar]
- 57.Garcia I, Aldaregia J, Vicentic JM, Aldaz P, Moreno-Cugnon L, Torres-Bayona S, Carrasco-Garcia E, Garros-Regulez L, Egaña L, Rubio A, et al. Oncogenic activity of sox1 in glioblastoma. Sci Rep. 2017;7:46575. doi: 10.1038/srep46575. [DOI] [PMC free article] [PubMed] [Google Scholar]
- 58.Han F, Hu R, Yang H, Liu J, Sui J, Xiang X, Wang F, Chu L, Song S. PTEN gene mutations correlate to poor prognosis in glioma patients: a meta-analysis. Onco Targets Therapy. 2016;9:3485. doi: 10.2147/OTT.S99942. [DOI] [PMC free article] [PubMed] [Google Scholar]
- 59.Costa ADA, Gutmann DH. Brain tumors in neurofibromatosis type 1. Neuro Oncol Adv. 2020;2(Supplement–1):85–97. doi: 10.1093/noajnl/vdz040. [DOI] [PMC free article] [PubMed] [Google Scholar]
- 60.Rao RC, Dou Y. Hijacked in cancer: the KMT2 (MLL) family of methyltransferases. Nat Rev Cancer. 2015;15(6):334–346. doi: 10.1038/nrc3929. [DOI] [PMC free article] [PubMed] [Google Scholar]
- 61.Janzing D, Minorics L, Bloebaum P. Feature relevance quantification in explainable AI: A causal problem. In: Chiappa S, Calandra R, editors. Proceedings of machine learning research, vol 108. PMLR, Online; 2020. p. 2907−16. http://proceedings.mlr.press/v108/janzing20a.html
- 62.Holzinger A, Langs G, Denk H, Zatloukal K, Müller H. Causability and explainability of artificial intelligence in medicine. WIREs Data Min Knowl Discov. 2019;9(4):1312. doi: 10.1002/widm.1312. [DOI] [PMC free article] [PubMed] [Google Scholar]
- 63.Holzinger A, Carrington AM, Müller H. Measuring the quality of explanations: the system causability scale (SCS) Künstliche Intell. 2020;34(2):193–198. doi: 10.1007/s13218-020-00636-z. [DOI] [PMC free article] [PubMed] [Google Scholar]
Associated Data
This section collects any data citations, data availability statements, or supplementary materials included in this article.
Supplementary Materials
Additional file 1. List of top mutated 140 genes used for query.
Additional file 2. Raw Mutation data downloaded from pedcbioportal and cbioportal, filtered, processed, merged and again filtered, provided as semicolon separated file as used in the python scripts.
Data Availability Statement
The data used in the present study are publicly available and have been downloaded from the public data repositories pedcbioportal and cbioportal. Sourcecode and processed data are available onhttps://github.com/radiance/glioma-mutations-xai.