. 2021 Feb 3;13(2):211. doi: 10.3390/pharmaceutics13020211

Table 5.

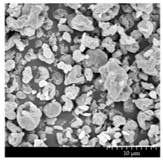
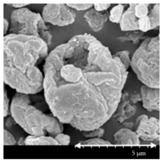
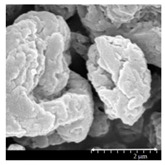
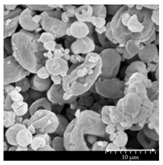
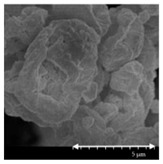
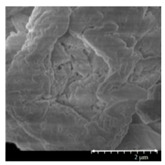
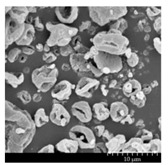
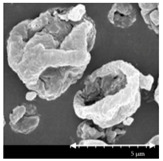
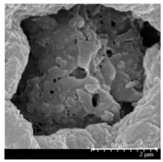
Diameter of the API in the products determined by Image-J analyses and the scanning electron microscopy (SEM) images of the spray-dried samples.

Samples D * (nm) SEM Pictures
nanoMX1_LEU0 134.30 ± 23.07 graphic file with name pharmaceutics-13-00211-i001.jpg graphic file with name pharmaceutics-13-00211-i002.jpg graphic file with name pharmaceutics-13-00211-i003.jpg
nanoMX1_LEU0.5 126.57 ± 27.26 graphic file with name pharmaceutics-13-00211-i004.jpg graphic file with name pharmaceutics-13-00211-i005.jpg graphic file with name pharmaceutics-13-00211-i006.jpg
nanoMX1_LEU1 138.27 ± 42.57 graphic file with name pharmaceutics-13-00211-i007.jpg graphic file with name pharmaceutics-13-00211-i008.jpg graphic file with name pharmaceutics-13-00211-i009.jpg

* Data are means ± SD (n = 100 independent measurements).