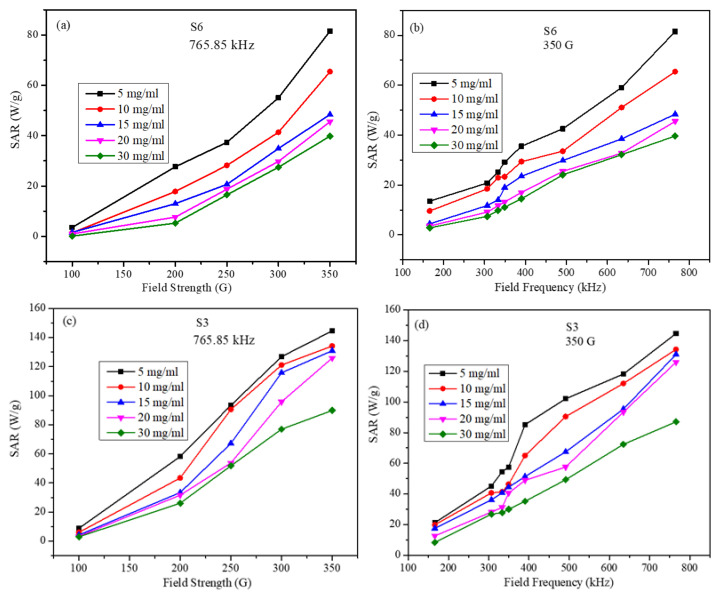
Figure 6.
SAR values (a) for S6 sample as a function of the field strength at a fixed frequency for several particle concentrations, (b) for S6 sample as a function of the field frequency at fixed strength for several particle concentrations, (c) for S3 sample as a function of the field strength at a fixed frequency for several particle concentrations, and (d) for S3 sample as a function of the field frequency at fixed strength for several particle concentrations (lines in figures are just to guide the eye).

