

Abstract
Arsenic methyltransferase (AS3MT) is the key enzyme in the pathway for the methylation of inorganic arsenic (iAs), a potent human carcinogen and diabetogen. AS3MT converts iAs to mono- and dimethylated arsenic species (MAs, DMAs) that are excreted mainly in urine. Polymorphisms in AS3MT is a key genetic factor affecting iAs metabolism and toxicity. The present study examined the role of As3mt polymorphisms in the susceptibility to the diabetogenic effects of iAs exposure using two Collaborative Cross mouse strains, CC021/Unc and CC027/GeniUnc, carrying different As3mt haplotypes. Male mice from the two strains were exposed to iAs in drinking water (0, 0.1 or 50 ppm) for 11 weeks. Blood glucose and plasma insulin levels were measured after 6-hour fasting and 15 min after i.p. injection of glucose. Body composition was determined using magnetic resonance imaging. To asses iAs metabolism, the concentrations of iAs, MAs and DMAs were measured in urine. The results show that CC021 mice, both iAs-exposed and controls, had higher body fat percentage, lower fasting blood glucose, higher fasting plasma insulin, and were more insulin resistant than their CC027 counterparts. iAs exposure had a minor effect on diabetes indicators and only in CC027 mice. Blood glucose levels 15 min after glucose injection were significantly higher in CC027 mice exposed to 0.1 ppm iAs than in control mice. No significant differences were found in the concentrations or proportions of arsenic species in urine of CC021 and CC027 mice at the same exposure level. These results suggest that the differences in As3mt haplotypes did not affect the profiles of iAs or its metabolites in mouse urine. The major differences in diabetes indicators were associated with the genetic backgrounds of CC021 and CC027 mice. The effects of iAs exposure, while minor, were genotype- and dose-dependent.
Keywords: arsenic exposure, Collaborative Cross, As3mt polymorphisms, diabetes
1. Introduction
Inorganic arsenic (iAs) is a chemical form of arsenic (As) commonly found in drinking water as well as food sources (ATSDR, 2007; Cubadda et al., 2017) Toxicologists have studied iAs primarily for its carcinogenic effects (IARC 2004); however, chronic exposure to iAs has been linked to a variety of other diseases, including diabetes (Maull et al. 2012). The association between iAs exposure and diabetes was first established in cross-sectional studies carried out in human populations exposed to high levels of iAs in drinking water (Navas-Acien et al., 2006; Tseng et al., 2002). More recent evidence has linked diabetes also to moderate and low iAs exposures, and results of longitudinal studies have suggested that this association is causal (Grau-Perez et al., 2017; Kuo et al., 2015, 2017; Yang et al., 2019). The causality has been further supported by results of experimental, mechanistic studies using in vitro models, and to some extent also studies in laboratory mice (Tseng, 2004; Maull et al. 2012). Both population and laboratory studies have also shown that the metabolism of iAs is an important factor that affects the diabetogenic effects of iAs exposure, and possibly some of the mechanisms underlying these effects (Maull et al. 201; Kuo et al., 2017).
The metabolism of iAs in humans and in other mammalian species involves enzymatic methylation yielding monomethyl-As (MAs), dimethyl-As (DMAs) and in some species also trimethyl-As (TMAs) metabolites (Thomas et al., 2007). The methylation of iAs is catalyzed by arsenic (+3 oxidation state) methyltransferase (AS3MT) using S-adenosylmethionine as a methyl group donor (Lin et al., 2002). The AS3MT-catalyzed methylation is a key step in iAs detoxification. Reduced capacity to methylate iAs results in accumulation of iAs in tissues Drobná et al., 2009; Hughes et al., 2010) and in greater susceptibility to iAs toxicity in laboratory mice (Douillet et al., 2017; Yokohira et al., 2010, 2011). Epidemiological studies have linked the variation in urinary profiles of iAs and its methylated metabolites, which are interpreted as indicators of the efficiency of iAs methylation, to risk of diseases in population chronically exposed to iAs (Ahsan et al., 2007; Kuo et al., 2017; Pierce et al., 2013; Vahter, 2000). Specifically, high proportions of total urinary As represented by MAs, (%MAs), which are viewed as an indicator of inefficient iAs methylation, have been linked to an increase risk of cancer and cardiovascular disease. In contrast, low %MAs or high %DMAs in urine appear to be risk factors for diabetes. Notably, polymorphisms in the gene encoding AS3MT has been shown to be a major factor influencing the urinary profiles of As metabolites as well as the disease risk (Antonelli et al., 2014; Chernoff et al., 2020; Li et al., 2017; Lin et al., 2018; Pierce et al., 2012; Vahter, 2000; Xu et al, 2016).
Until recently, studying the role of AS3MT polymorphisms in iAs metabolism and toxicity in laboratory settings was a challenging task because of the lack of suitable animal models, specifically, the limited genetic diversity among existing mouse strains. Establishment of the Collaborative Cross (CC) mouse population has changed this paradigm. The CC population consists of multiple inbred mouse strains that have been derived from eight founder strains and that represent ideal laboratory models to study the role of genetic diversity in etiology of biological traits (Aylor et al. 2011). We recently used 12 of the CC strains to examine the relationship between As3mt haplotypes inherited from the founder strains and metabolism of iAs, including disposition of iAs and its methylated metabolites in urine and liver (Stýblo et al., 2019). We found that the differences in As3mt haplotypes alone do not explain the variation in the pattern of iAs metabolism between the strains. However, As3mt expression in liver significantly correlated with the proportions of iAs and DMAs in this organ, suggesting that CC strains with different levels of As3mt expression may differ in their susceptibility to adverse effects of iAs exposure. The goal of the present study was to test this hypothesis using two strains from the genetically diverse CC mouse population and focusing on the diabetogenic effects of iAs exposure.
2. Material and Methods
2.1. Rationale for choice of CC strains and sex of mice
CC strains CC021/Unc and CC027/GeniUnc (further referred to as CC021 and CC027) were used in this study. These strains carry different As3mt haplotypes, specifically NOD/ShiLtJ in CC021 and WSB/EiJ in CC027 strain, which contain different As3mt polymorphisms, including one missense SNP (rs13463720) (Keane et al. 2011; Srivastava et al. 2017) (Suppl. Table 1). Our recently published study found differences in proportions of iAs, MAs and DMAs in livers of male CC021 and CC027 mice exposed to 0.1 and 50 ppm iAs (Stýblo et al., 2019). Results of this study also suggested that As3mt expression in livers of CC021 and CC027 mice exposed to iAs may also differ. Additional statistical analysis of the gene expression data from the published study confirmed that As3mt expression level was significantly higher in the livers of male CC027 mice as compared to livers of male CC021 mice (Suppl. Fig. 1). The study by Stýblo et al. (2019) characterized As3mt expression and iAs metabolism only in male mice, not in female mice. Thus, only male mice were used in the present study. Additional justification for focusing on male mice is provided by our other published studies, which found male mice to be more susceptible to the diabetogenic effects of iAs exposure than their female counterparts (Douillet et al. 2017, Huang et al. 2018a).
2.2. Mice and exposure to iAs
All procedures involving mice were approved by the University of North Carolina Institutional Animal Care and Use Committee. Four-week old male CC021 mice (N=49) and CC027 (N=47) mice were obtained from the UNC Systems Genetics Core Facility in June 2018. All mice were allowed to acclimate for 2 weeks under controlled conditions with 12-h light/dark cycle at 22 ± 1°C and 50 ± 10% relative humidity. During this time, mice drank As-free deionized water (DIW) and were fed a semi-purified low-fat AIN-93G diet. In our previous studies, the concentrations of iAs in this type of diet ranged from 11 to 50 ppb (Douillet et al. 2017; Huang et al. 2018b; Murko et al. 2018). The acclimatization allows for clearance of As to which the mice are exposed when fed a regular grain-based diet, which typically contains significantly higher levels of As, including iAs (Murko et al. 2018). After acclimatization, mice from each strain were randomly assigned to three treatment groups (N=15–17 per group). Mice in two groups drank ad libitum DIW containing iAs (sodium arsenite, >99% pure, Sigma Aldrich, St.Louis, MO) at final concentration of 0.1 or 50 ppm (i.e., 0.1 or 50 μg As/L) for 11 weeks. Control mice in the 3rd group continued drinking DIW. Drinking water in all three groups was changed weekly. Water and food consumption were measured every week. Body weights were monitored bi-weekly
2.3. Assessment of mouse phenotypes
The following assessments were performed in all groups at the end of the exposure period: Body composition, including the percentages of body mass represented by fat (%fat) and by lean mass (%lean mass), were determined using Echo MRI Three-in-one Composition Analyzer and Labmaster (Echo Medical Systems, Houston, TX, USA). Blood glucose and plasma insulin levels were measured after 6-hour fasting and 15 min after i.p. injection of glucose (2 g/kg b.w.; Sigma-Aldrich). Fasting blood glucose (FBG) and 15-min blood glucose (15’BG) were measured by One Touch® Ultra® glucometer (LifeScan, Inc., Milpitas, CA). Fasting plasma insulin (FPI) and 15-min plasma insulin (15’PI) were measured using ELISA kits from Crystal Chem (Elk Grove Village, IL). Differences between 15’BG and FBG (ΔBG) and between 15’PI and FPI (ΔPI) were used to evaluate the efficiency of glucose utilization and insulin response after i.p. glucose injection, respectively. Homeostasis assessment-insulin resistance (HOMA-IR) index, an indicator of insulin resistance, was calculated as follows: HOMA-IR = FBG (nmol/L)*FPI (μU/mL) / 22.5. The following equitation was used to calculate HOMA of β-cell function: HOMA-B = 360*FPI (μU/mL) / [FBG (mg/dL) – 63].
2.4. Speciation analysis of As in urine
The analysis of As species was carried out in spot urine samples (50–100 μl) collected at the end of the exposure period. Concentrations of iAs, MAs, and DMAs were measured by hydride generation-atomic absorption spectrometry coupled with a cryotrap using previously described procedures (Currier et al. 2011; Hernández-Zavala et al. 2008). The instrumental limits of detections (LODs) for iAs, MAs, and DMAs using this method are 14, 8, and 20 pg As, respectively (Hernández-Zavala et al. 2008), which translate to 0.28, 0.16, and 0.40 ppb for the sample size and dilution used in this study. The value of LOD/2 was imputed for measured values below LOD, specifically for MAs in ~90% of the urine samples and for iAs in 8% of the samples. DMAs concentrations were above LOD in all urine samples. The concentration of total As (tAs) was calculated as sum of the concentrations of iAs, MAs, and DMAs. The proportions of As species in the analyzed urined were expressed as percentage of tAs represented by iAs (%iAs), MAs (%MAs) or DMAs (%DMAs). Trimethyl arsine oxide, which has been detected in urine of mice in some of the published studies was not detected in any of the urine samples analyzed in this study.
2.5. Statistical analysis
An ANOVA with Tukey-Kramer multiple comparison post-test was used to evaluate differences between the two CC strains and the three treatment groups in phenotypic measures and in the concentrations and proportions of As species in urine. Data on As3mt expression in the livers of CC021 and CC027 mice from our published study (Stýblo et al., 2019) were evaluated using a t-test. Differences characterized by p<0.05 were considered statistically significant.
3. Results
3.1. Body weight and food and water consumption
At week 11, the unexposed control CC021 mice were significantly heavier than their CC027 counterparts; however, there were no statistically significant differences in body weights between CC021 and CC027 mice exposed to either 0.1 or 50 ppm iAs (Fig. 1A). The body weights of CC021 and CC027 mice exposed to 50 ppm iAs were significantly lower than those of their respective controls. Both control and iAs-exposed mice gained weight over the 11-week period, but the control CC021 mice gained more weight than CC027 controls (Fig. 1B). Exposure to 50 ppm iAs was associated with significantly reduced weight gain in the CC021 mice. No statistically significant effects of iAs exposure on weight gain were observed in the CC027 mice. Consistent with these findings was the amount of food consumed by mice in different genotype and treatment groups. The control CC021 mice consumed more food than CC027 controls, although this difference was not statistically significant (Suppl. Fig. 2A). CC021 mice exposed to 50 ppm consumed significantly less food than CC021 controls. The exposure to 50 ppm iAs had a significant effect on water consumption regardless of genotype; the mice exposed to 50 ppm iAs drank approximately two times less water than the control mice or the mice exposed to 0.1 ppm iAs (Suppl. Fig. 2B). There were no statistically significant differences in water consumption between CC021 and CC027 mice in the same exposure group.
Figure 1:
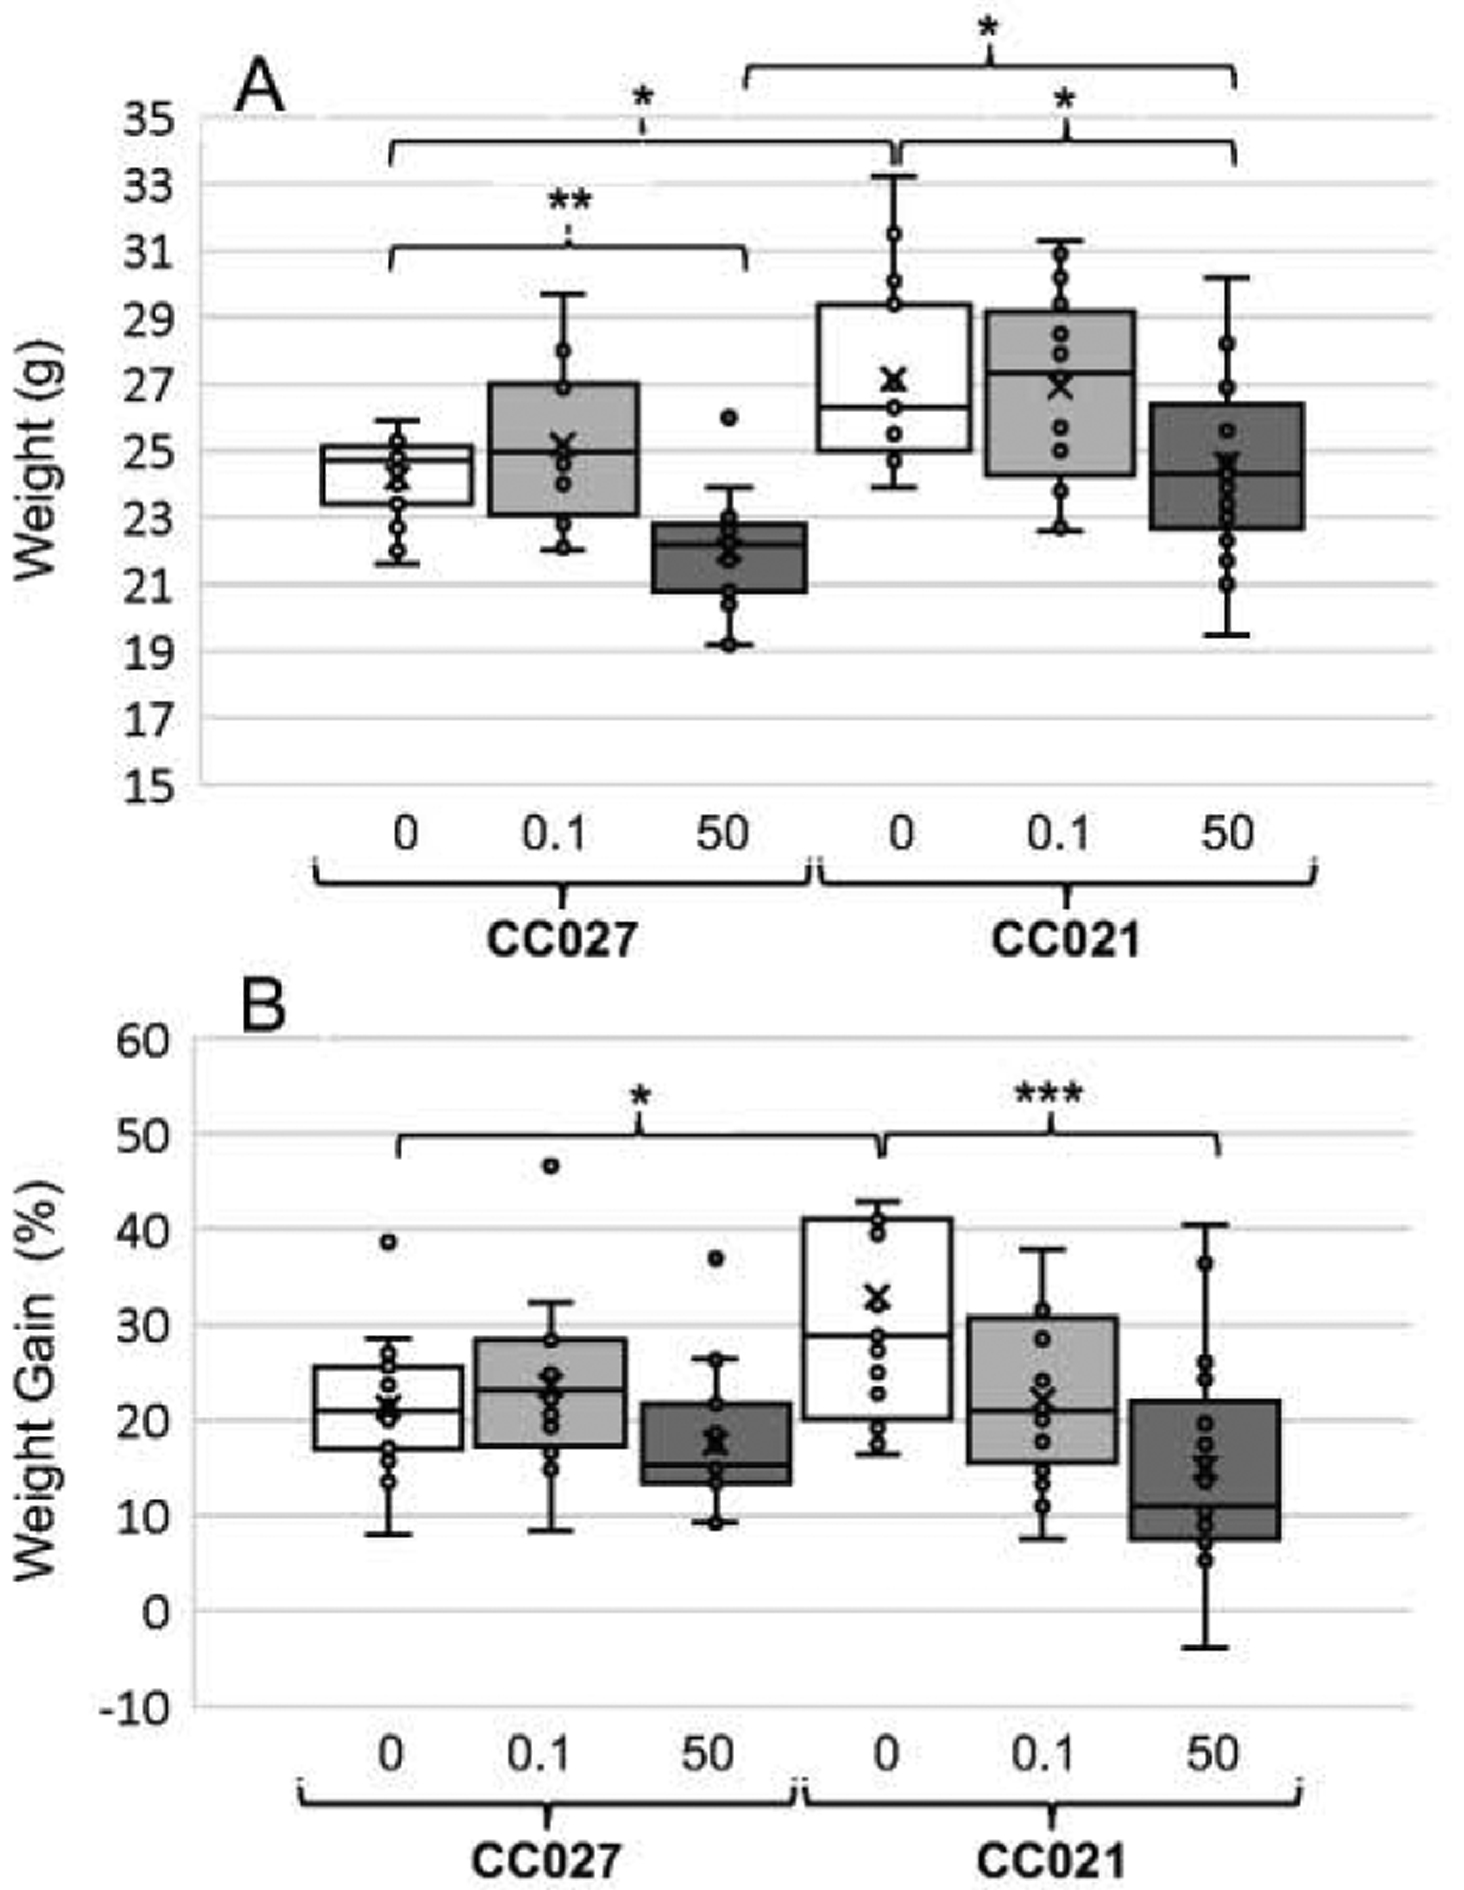
Body weights (A) and relative weight gains (B) of CC027 and CC021 mice exposed to iAs in drinking water (0, 0.1, or 50 ppm) for 11 weeks. Mean (x), median (―), 25th and 75th percentiles (box), maximum and minimum (whiskers), and individual values including outliers are shown for N=15–17 per treatment group are shown. Statistically significant differences between the mouse strains and treatment groups are marked as follows: *p<0.05, **p<0.01, and ***p<0.001.
3.2. Body composition
Body composition (%fat and % lean mass) of iAs-exposed and control mice was assessed by MRI at week 11. CC027 mice in all treatment groups were very lean, with an average fat mass ranging from 3.3% to 6.2% of the body mass (Fig. 2A). In contrast, the fat mass of CC021 mice accounted for 10.2% to 11%, and the differences between the two genotypes were statistically significant within each treatment group. %Lean mass tended to be lower in CC021 as compared to CC027 mice in all treatment group, but these differences did not reach statistical significance (Fig. 2B).
Figure 2:

Body composition of CC027 and CC021 mice exposed to iAs in drinking water (0, 0.1, or 50 ppm) for 11 weeks: %fat mass (A) and %lean mass (B). Mean (x), median (―), 25th and 75th percentiles (box), maximum and minimum (whiskers), and individual values including outliers are shown for N=15–17 per treatment group are shown. Statistically significant differences between the mouse strains and treatment groups are marked as follows: *p<0.05 and **p<0.01.
3.3. Blood glucose levels
CC027 mice had higher FBG than CC021 mice within each treatment group (Fig. 3A). Similar differences between the genotypes were also found in blood glucose levels 15 min after i.p. glucose injection (15’BG), but these differences were statistically significant only among controls and among mice exposed to 0.1 ppm iAs (Fig. 3B). Similarly, ΔBG (i.e., 15’BG-FBG) was greater in CC027 than in CC021 mice, although this difference was statistically significant only in mice exposed to 0.1 ppm iAs (Fig. 3C). The exposure to iAs had little effect on blood glucose measures and only among CC027 mice where 15’BG was significantly higher in mice exposed to 0.1 ppm iAs as compared to control mice (Fig. 3B).
Figure 3:

Fasting blood glucose (FBG) (A), blood glucose 15 min after i.p. glucose injection (15’BG) (B), and the difference between 15’BG and FBG (ΔBG) (C) in CC027 and CC021 mice exposed to iAs in drinking water (0, 0.1, or 50 ppm) for 11 weeks. Mean (x), median (―), 25th and 75th percentiles (box), maximum and minimum (whiskers), and individual values including outliers are shown for N=15–17 per treatment group are shown. Statistically significant differences between the mouse strains and treatment groups are marked as follows: *p<0.05, **p<0.01, and ***p<0.001.
3.4. Plasma insulin levels
The differences between the genotypes in plasma insulin mirrored those found in blood glucose levels. FPI and 15’PI levels were significantly higher in CC021 mice compared to CC027 mice, regardless of iAs exposure (Fig. 4A,B). However, there were no statistically significant differences between genotypes in ΔPI (Fig. 4C). No statistically significant effects of iAs exposure on any of the insulin measures were found.
Figure 4:
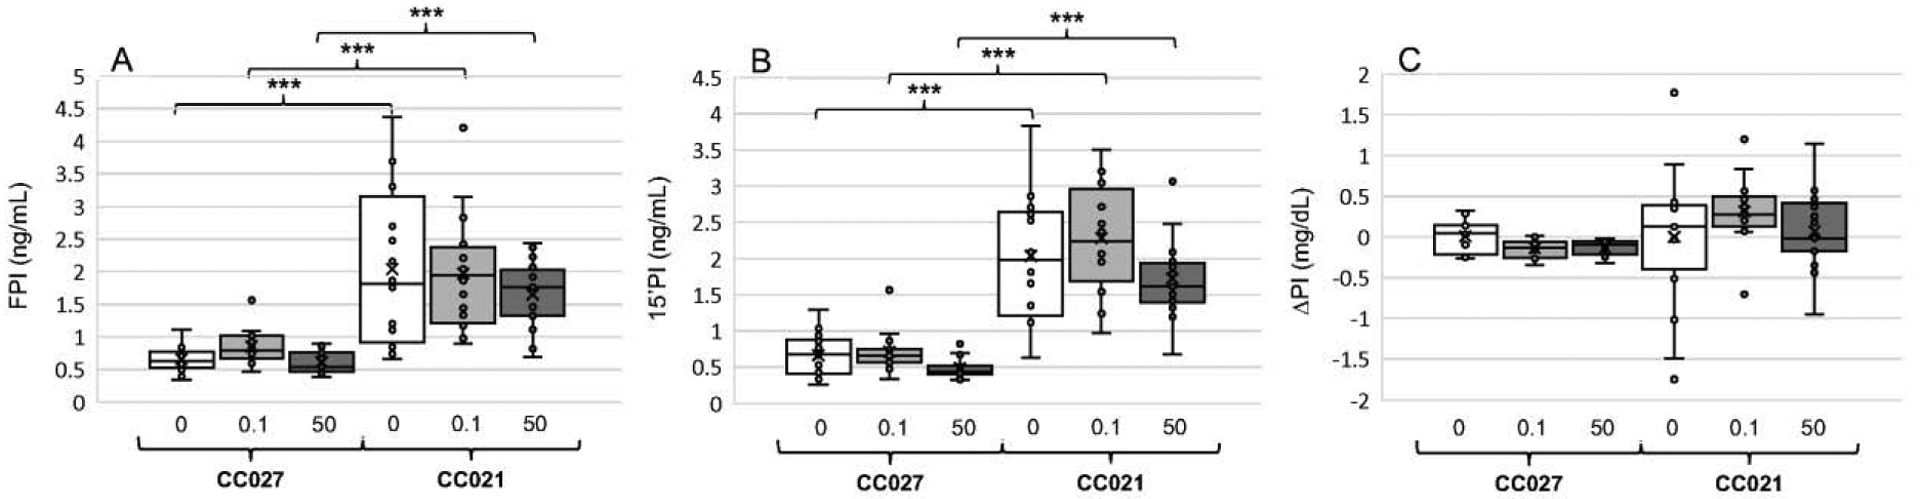
Fasting plasma insulin (FPI) (A), plasma insulin 15 min after i.p. glucose injection (15’PI) (B), and the difference between 15’PIG and FPI (ΔPI) (C) in CC027 and CC021 mice exposed to iAs in drinking water (0, 0.1, or 50 ppm) for 11 weeks. Mean (x), median (―), 25th and 75th percentiles (box), maximum and minimum (whiskers), and individual values including outliers are shown for N=15–17 per treatment group are shown. ***Statistically significant differences between the mouse strains and treatment groups (p<0.001).
3.5. Insulin resistance and ß-cell function
HOMA-IR, an indicator of insulin resistance, and HOMA-B, an indicator of ß-cell function, were calculated using FBG and FPI values. In spite of major variations in HOMA-IR and HOMA-B found in CC021 mice, particularly among controls, both values were significantly higher in mice of this genotype as compared to CC027 mice, regardless of treatment (Fig. 5A,B). There were no statistically significant differences in HOMA-IR or HOMA-B due to iAs exposure among mice of either strain.
Figure 5:
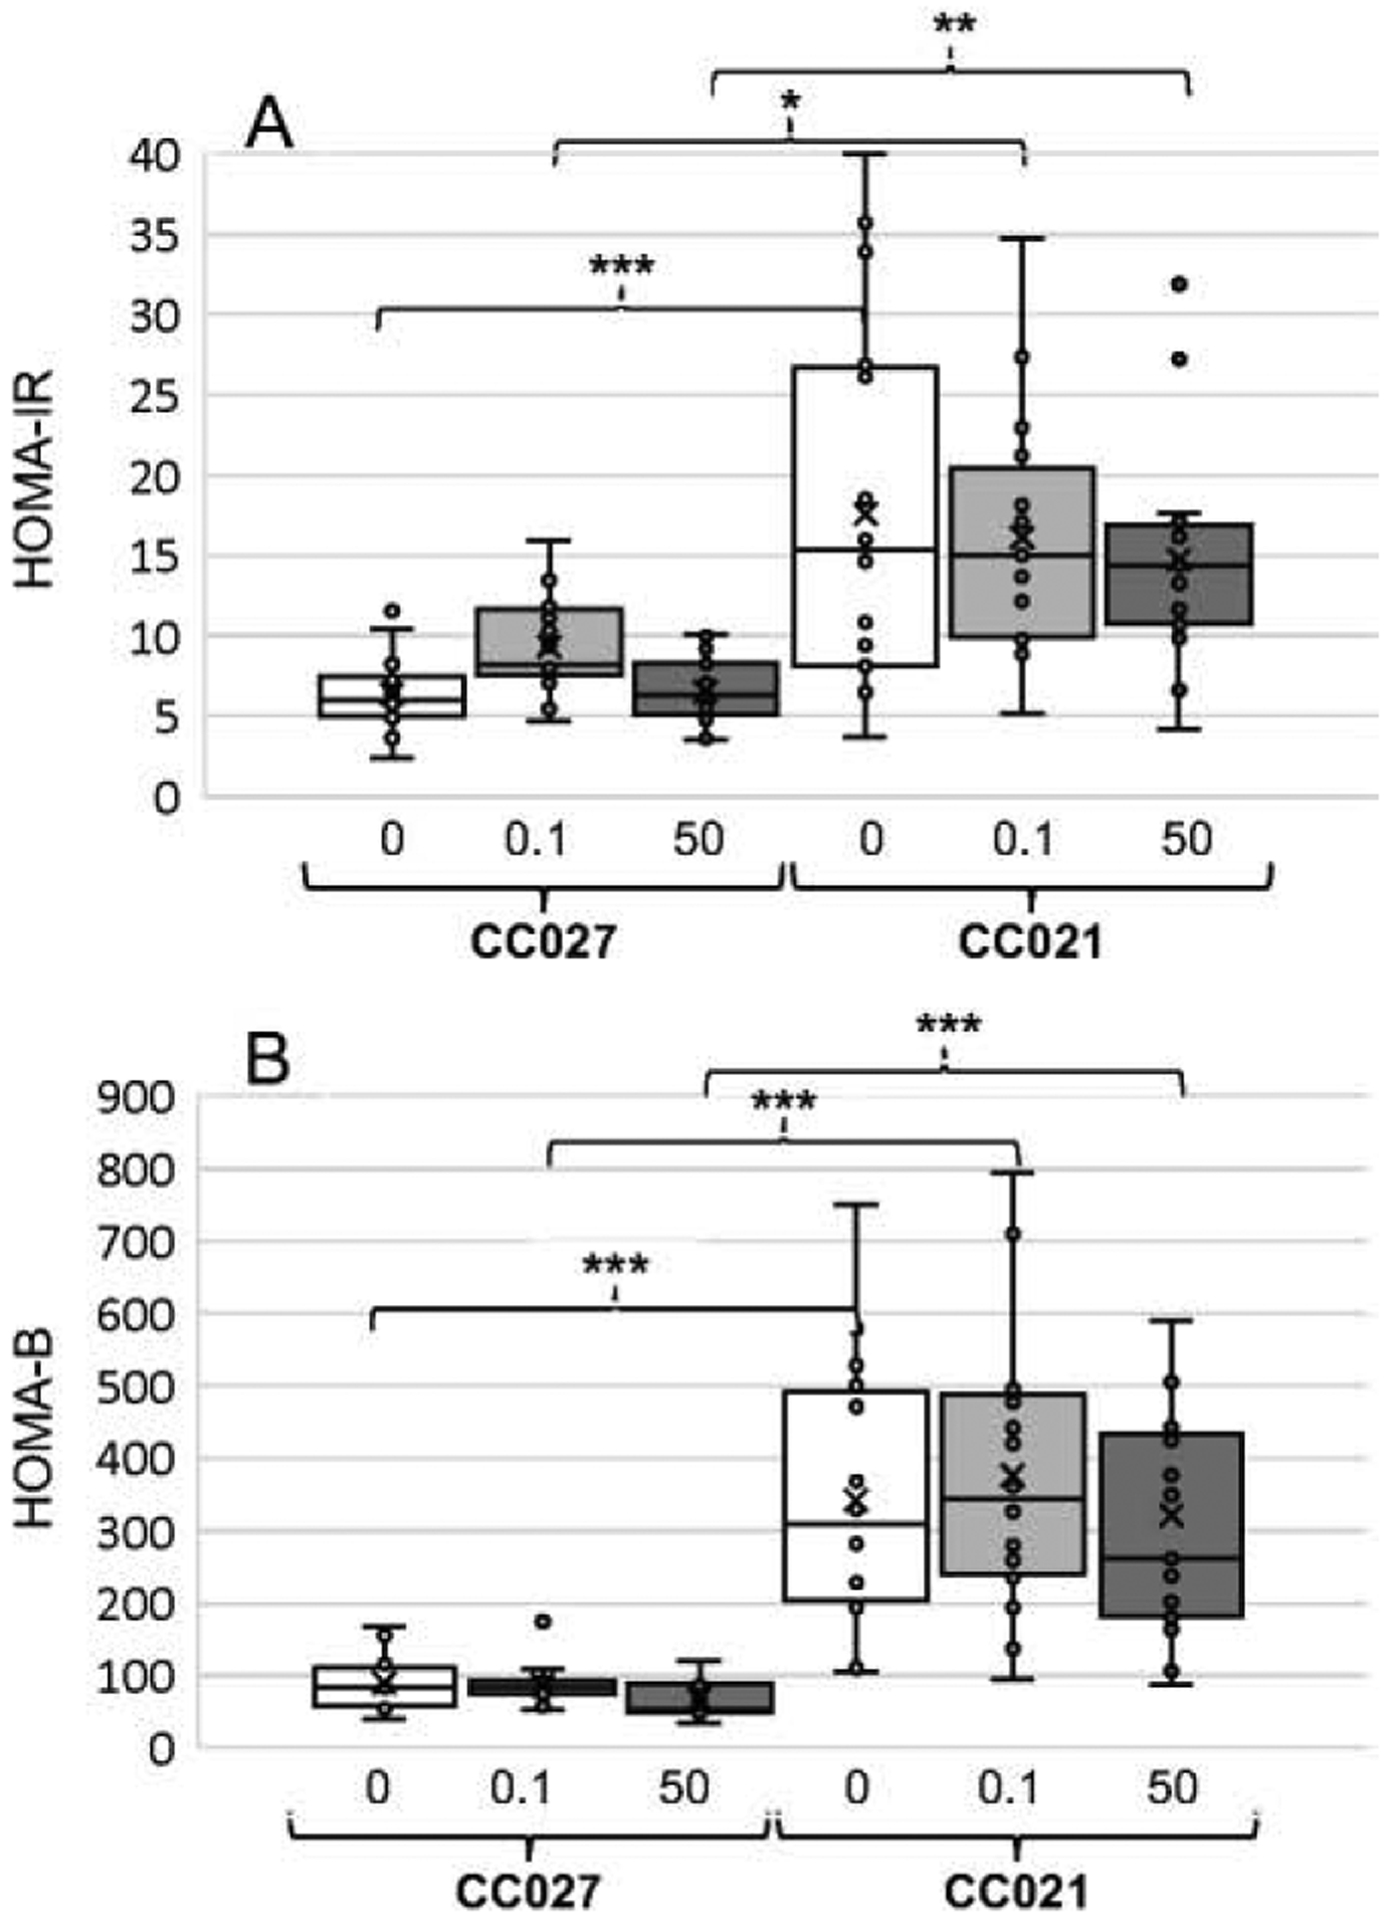
Indicators of insulin resistance (HOMA-IR) (A) and ß-cell function (HOMA-B) (B) calculated for CC027 and CC021 mice exposed to iAs in drinking water (0, 0.1, or 50 ppm) for 11 weeks. Mean (x), median (―), 25th and 75th percentiles (box), maximum and minimum (whiskers), and individual values including outliers are shown for N=15–17 per treatment group are shown. Statistically significant differences between the mouse strains and treatment groups are marked as follows: *p<0.05, **p<0.01, and ***p<0.001.
3.6. Arsenic species in urine
Analysis of spot urine samples collected at the end of week 11 showed that tAs levels, which represent sum of iAs, MAs and DMAs, differed between the exposure groups and were positively associated with the concentration of iAs in drinking water of mice in both CC021 and CC027 strains (Fig. 6). No statistically significant differences in tAs level between CC021 and CC027 mice exposed to the same level of iAs in drinking water were found. The proportions of urinary iAs and MAs (%iAs and %MAs) decreased and %DMAs increased with increasing iAs concentration in drinking water for both strains, and the differences between the exposure levels were statistically significant (Fig. 7). However, no significant differences in %iAs, %MAs or %DMAs were found between CC021 and CC027 mice within each exposure group. Major variations in the proportions of As species were observed in urine of control mice, but not in urine of iAs exposed mice from both strains.
Figure 6:

Total arsenic (tAs) levels in urine of CC027 and CC021 mice exposed to iAs in drinking water (0, 0.1, or 50 ppm) for 11 weeks. Mean (x), median (―), 25th and 75th percentiles (box), maximum and minimum (whiskers), and individual values including outliers are shown for N=15–17 per treatment group are shown. ***Statistically significant differences between the mouse strains and treatment groups (p<0.001).
Figure 7:

Proportions of arsenic species in urine of CC027 and CC021 mice exposed to iAs in drinking water (0, 0.1, or 50 ppm) for 11 weeks: The percentage of total arsenic represented by iAs (A), MAs (B) and DMAs (C). Mean (x), median (―), 25th and 75th percentiles (box), maximum and minimum (whiskers), and individual values including outliers are shown for N=15–17 per treatment group are shown. Statistically significant differences between the mouse strains and treatment groups are marked as follows: *p<0.05, **p<0.01, and ***p<0.001.
4. Discussion
The epidemiological studies linking AS3MT polymorphisms to the inter-individual differences in efficiency of iAs metabolism have relied almost entirely on the proportions of iAs, MAs and DMAs in urine. Still, these data provide little evidence that the urinary profiles of these metabolites are direct reflections of whole-body metabolism of iAs or the rate of iAs detoxification. Availability of an appropriate animal model would make it possible to study the associations between As3mt polymorphism and efficiency of iAs metabolism, as well as the adverse effects of iAs exposure at tissue and cellular levels.
In 1999, Hughes and associates published a study, in which they showed that metabolism of a single dose of iAs differed among mice from two inbred mouse strains (C3H/ HeNCrlBR and C57BL/6N/6NCrlBR) and the F1 hybrid strain (B6C3F1) produced by crossing the two inbred strains (Hughes et al., 1999). This study was the first to provide evidence that the genetic background of mice influences iAs metabolism. However, at that time, the pattern of iAs metabolism could not be linked to specific As3mt genotypes in these mouse strains because As3mt, as the iAs methylating enzyme (originally known as Cyt19), was only discovered later in 2002 (Lin et al., 2002).
Our team was probably among the first in the field of As toxicology to take advantage of the genetically diverse CC mouse population, which is housed at UNC Chapel Hill. Our first study using CC mice showed that effects of prenatal exposure to iAs on diabetes indicators in offspring differ between mice from CC004 and CC032 strains (Fry et al., 2019), but the role of iAs metabolism as a factor underlying this difference was not examined. Recently, we showed that As3mt expression and iAs metabolism differ among male mice from 12 CC strains carrying seven different As3mt haplotypes inherited from the founder strains (Stýblo et al., 2019). In that study, mice were exposed to 0.1 or 50 ppm iAs in drinking water for 4 weeks and concentrations and proportions of iAs, MAs and DMAs were measured in urine and livers. However, the adverse effects associated with this exposure were not examined due to relatively short exposure time.
The present study is the first attempt to link differences in iAs metabolism to differences in manifestation or severity of iAs toxicity using genetically diverse CC strains. Two of the 12 strains examined in the previous study, namely CC021 and CC027, were selected because these strains carry different As3mt haplotypes (NOD/ShiLtJ and WSB/EiJ, respectively) (Stýblo et al., 2019). In addition, when exposed to 0.1 or 50 ppm iAs, male mice from these strains differed in the expression level of As3mt and in the proportions of As species in the liver (Stýblo et al., 2019). Accordingly, it was hypothesized that these strains would demonstrate different sensitivity to the adverse effects of iAs exposure, specifically the diabetogenic effects.
The present study focused on the diabetogenic effects because iAs is a well-established human diabetogen (Maul et al., 2012) and because in published studies mice exposed to 3– 50 ppm levels of iAs in drinking water were shown do develop diabetic phenotypes (Dávila-Esqueda et al., 2011; Liu et al., 2014; Maul et al., 2012; Paul et al., 2007, 2008, 2011). In addition to 50 ppm iAs, we also included exposure to 0.1 ppm iAs. This exposure level would not represent a major challenge for mice that metabolize iAs more efficiently than humans (Vahter, 2019), but it could be effective in association with genotypes that increase risk of diabetes, e.g., with NOD genotype. NOD mice are known to spontaneously development hyperglycemia due to autoimmune insulitis and are used for studies of type 1 diabetes and obesity-independent diabetes (Delovitch and Singh, 1997). In the present study, mice were exposed to iAs for a prolonged period of time, i.e., 11 weeks. Exposures for 8 weeks or longer have been reported to produce diabetic phenotypes in mice (Dávila-Esqueda et al., 2011; Liu et al., 2014; Maul et al., 2012; Paul et al., 2007, 2008, 2011). While evaluating the mouse phenotypes, we focused on measures of blood glucose and plasma insulin that are commonly used in laboratory research of diabetes and in clinical practice. We also used as proxies HOMA-IR and HOMA-B indices that have been developed and validated for assessment of insulin resistance and ß-cell function in clinical studies (Wallace et al., 2004).
The findings from the present study do not support our working hypothesis that the differences in As3mt haplotypes between CC021 and CC027 mice would be associated with differences in iAs metabolism and in susceptibility to the diabetogenic effects of iAs exposure. CC021 mice displayed higher fasting plasma insulin and were more insulin resistant than their CC027 counterparts regardless of iAs exposure, possibly due to greater adiposity (%fat). Body fat, a known risk factor for type 2 diabetes, has been linked to insulin resistance in clinical and laboratory studies (Heydemann, 2016; Kahn and Flier, 2000). Interestingly, in spite of the greater fat depots, CC021 mice had lower FBG and appeared to be more glucose tolerant, suggesting that better ß-cell function (i.e., higher HOMA-B) associated with higher plasma insulin levels was able to compensate for insulin resistance. No significant differences were found between the two strains in tAs levels or the proportions of As species in urine. High proportions of DMAs in urine of both strains exposed to either 0.1 or 50 ppm iAs (82.3–99.7%) are consistent with findings of our previous CC mouse study (Stýblo et al., 2019), indicating the high efficiency of converting iAs to DMAs by mice even at high exposure levels. In comparison, As species in human urine are typically represented by 10–30%iAs, 10–20%MAs and 60–80%DMAs (Vahter, 1999). Unlike in studies using other mouse strains, iAs exposure had a minor effect on phenotype of CC021 and CC027 mice, and only on one of the diabetes indicators, 15’BG. This effect was strain-specific. Higher levels of 15’BG in CC027 mice exposed to 0.1 ppm iAs as compared to controls suggest possible impairment of glucose tolerance in this strain under the given exposure conditions. No effects of 50 ppm exposure were observed indicating a non-monotonic dose response in these mouse strains.
In summary, the differences in As3mt haplotypes did not affect the metabolic profiles of iAs and its metabolites in urine of CC021 and CC027 male mice exposed to either 0.1 or 50 ppm iAs. iAs exposure for 11 weeks had little effect on blood glucose and plasma insulin measures. The major differences in diabetes indicators that were found between the two strains were independent of iAs exposure and were likely associated with differences in their genetic backgrounds. These findings, together with results of our published studies and studies carried out by other laboratories, suggest that mice from the existing mouse strains, including the CC strains, may not represent optimal models to study gene-environment interaction in the context of iAs exposure and metabolism, or iAs-associated diseases. We have recently established a fundamentally new mouse strain in which the mouse gene encoding As3mt was replaced with the human gene (Koller et al., 2020). Notably, iAs metabolism in this mouse strain differs from that in the existing mouse strains and resembles iAs metabolism in humans. The AS3MT gene in these mice can be modified to introduce polymorphisms that are known to affect iAs metabolism and risk of iAs-associated diseases in human population. Using this approach, additional humanized strains can be established which would carry the AS3MT risk SNPs or haplotypes, and in which the role of AS3MT polymorphisms in disease risk could be studied at the tissue and cellular levels.
Supplementary Material
5. Acknowledgements
This study was supported by a Pilot Grant from the UNC Center for Environmental Health and Susceptibility, which is funded through the NIEHS grant P30ES010126. Additional support was provided by the NIH grants R01ES028721 to M.S. and R.F., and R01ES029925 to R.F., F.P.M.V., and M.S., as well as by the UNC Superfund Program grant P42ES031007, NIH grant DK 056350 to the UNC NORC, and by the Institute for Environmental Health Solutions, Gillings School of Global Public Health, UNC Chapel Hill.
Footnotes
Publisher's Disclaimer: This is a PDF file of an unedited manuscript that has been accepted for publication. As a service to our customers we are providing this early version of the manuscript. The manuscript will undergo copyediting, typesetting, and review of the resulting proof before it is published in its final form. Please note that during the production process errors may be discovered which could affect the content, and all legal disclaimers that apply to the journal pertain.
Declaration of interests
The authors declare that they have no known competing financial interests or personal relationships that could have appeared to influence the work reported in this paper.
References
- Ahsan H, Chen Y, Kibriya MG, Slavkovich V, Parvez F, Jasmine F, Gamble MV, Graziano JH, 2007. Arsenic metabolism, genetic susceptibility, and risk of premalignant skin lesions in Bangladesh. Cancer Epidemiol. Biomarkers Prev 16, 1270–1278. doi: 10.1158/1055-9965.EPI-06-0676. [DOI] [PubMed] [Google Scholar]
- Antonelli R, Shao K, Thomas DJ, Sams R 2nd, Cowden J, 2014. AS3MT, GSTO, and PNP polymorphisms: impact on arsenic methylation and implications for disease susceptibility. Environ. Res 132, 156–67. doi: 10.1016/j.envres.2014.03.012. [DOI] [PubMed] [Google Scholar]
- ATSDR. 2007. Agency for Toxic Substances and Disease Registry. Toxicological profile for arsenic. U.S. DHHS, Public Health Service, Atlanta, GA. [PubMed] [Google Scholar]
- Aylor DL, Valdar W, Foulds-Mathes W, Buus RJ, Verdugo RA, Baric RS, Ferris MT, Frelinger JA, Heise M, Frieman MB, Gralinski LE, Bell TA, Didion JD, Hua K, Nehrenberg DL, Powell CL, Steigerwalt J, Xie Y, Kelada SN, Collins FS, Yang IV, Schwartz DA, Branstetter LA, Chesler EJ, Miller DR, Spence J, Liu EY, McMillan L, Sarkar A, Wang J, Wang W, Zhang Q, Broman KW, Korstanje R, Durrant C, Mott R, Iraqi FA, Pomp D, Threadgill D, de Villena FP, Churchill GA, 2011. Genetic analysis of complex traits in the emerging Collaborative Cross. Genome Res. 21, 1213–1222. doi: 10.1101/gr.111310.110. [DOI] [PMC free article] [PubMed] [Google Scholar]
- Chernoff M, Tong L, Demanelis K, Vander Griend D, Ahsan H, Pierce BL., 2020. Genetic Determinants of reduced arsenic metabolism efficiency in the 10q24.32 region are associated with reduced AS3MT expression in multiple human tissue types. Toxicol. Sci 176, 382–395. doi: 10.1093/toxsci/kfaa075. [DOI] [PMC free article] [PubMed] [Google Scholar]
- Cubadda F, Jackson BP, Cottingham KL, Van Horne YO, Kurzius-Spencer M, 2017. Human exposure to dietary inorganic arsenic and other arsenic species: State of knowledge, gaps and uncertainties. Sci. Total Environ 579, 1228–1239. doi: 10.1016/j.scitotenv.2016.11.108. [DOI] [PMC free article] [PubMed] [Google Scholar]
- Dávila-Esqueda ME, Morales JM, Jiménez-Capdeville ME, De la Cruz E, Falcón-Escobedo R, Chi-Ahumada E, Martin-Pérez S., 2011. Low-level subchronic arsenic exposure from prenatal developmental stages to adult life results in an impaired glucose homeostasis. Exp. Clin. Endocrinol. Diabetes 119, 613–617. doi: 10.1055/s-0031-1287782. [DOI] [PubMed] [Google Scholar]
- Delovitch TL., Singh B. (1997). The nonobese diabetic mouse as a model of autoimmune diabetes: immune dysregulation gets the NOD. Immunity. 7, 727–738. doi: 10.1016/s1074-7613(00)80392-1. [DOI] [PubMed] [Google Scholar]
- Douillet C, Huang MC, Saunders RJ, Dover EN, Zhang C, Stýblo M, 2017. Knockout of arsenic (+3 oxidation state) methyltransferase is associated with adverse metabolic phenotype in mice: the role of sex and arsenic exposure. Arch. Tox 91, 617–2627. doi: 10.1007/s00204-016-1890-9. [DOI] [PMC free article] [PubMed] [Google Scholar]
- Drobná Z, Naranmandura H, Kubachka KM, Edwards BC, Herbin-Davis K, Styblo M, Le XC, Creed JT, Maeda N, Hughes MF, Thomas DJ, 2009. Disruption of the arsenic (+3 oxidation state) methyltransferase gene in the mouse alters the phenotype for methylation of arsenic and affects distribution and retention of orally administered arsenate. Chem. Res. Toxicol 22, 1713–1720. doi: 10.1021/tx900179r. [DOI] [PMC free article] [PubMed] [Google Scholar]
- Grau-Perez M, Kuo CC, Gribble MO, Balakrishnan P, Jones Spratlen M, Vaidya D, Francesconi KA, Goessler W, Guallar E, Silbergeld EK, Umans JG, Best LG, Lee ET, Howard BV, Cole SA, Navas-Acien A, 2017. Association of Low-Moderate Arsenic Exposure and Arsenic Metabolism with Incident Diabetes and Insulin Resistance in the Strong Heart Family Study. Environ. Health Perspect 125, 127004. doi: 10.1289/EHP2566. [DOI] [PMC free article] [PubMed] [Google Scholar]
- Currier JM, Svoboda M, de Moraes DP, Matousek T, Dĕdina J, Stýblo M, 2011. Direct analysis of methylated trivalent arsenicals in mouse liver by hydride generation-cryotrapping-atomic absorption spectrometry. Chem. Res. Toxicol 24, 478–480. doi: 10.1021/tx200060c. [DOI] [PMC free article] [PubMed] [Google Scholar]
- Fry RC, Addo KA, Bell TA, Douillet C, Martin E, Stýblo M, Pardo-Manuel de Villena F 2019. Effects of preconception and in utero inorganic arsenic exposure on the metabolic phenotype of genetically diverse Collaborative Cross mice. Chem. Res. Toxicol 32, 1487–1490. doi: 10.1021/acs.chemrestox.9b00107. [DOI] [PMC free article] [PubMed] [Google Scholar]
- Hernández-Zavala A, Matoušek T, Drobná Z, Paul DS, Walton F, Adair BM, Jiří D, Thomas DJ, Stýblo M, 2008. Speciation of arsenic in biological matrices by automated hydride generation-cryotrapping-atomic absorption spectrometry with multiple microflame quartz tube atomizer (multiatomizer). J. Anal. At Spectrom 23, 342–351. doi: 10.1039/b706144g. [DOI] [PMC free article] [PubMed] [Google Scholar]
- Heydemann A, 2016. An overview of murine high fat diet as a model for type 2 diabetes mellitus. J. Diabetes Res 2016: 2902351. doi: 10.1155/2016/2902351. [DOI] [PMC free article] [PubMed] [Google Scholar]
- Huang MC, Douillet C, Dover EN, Zhang C, Beck R, Tejan-Sie A, Krupenko SA, Stýblo M 2018a. Metabolic phenotype of wild-type and As3mt-knockout C57BL/6J mice exposed to inorganic arsenic: The role of dietary fat and folate intake. Environ. Health. Perspect 126, 127003. doi: 10.1289/EHP3951. [DOI] [PMC free article] [PubMed] [Google Scholar]
- Huang MC, Douillet C, Dover EN, Stýblo M, 2018b. Prenatal arsenic exposure and dietary folate and methylcobalamin supplementation alter the metabolic phenotype of C57BL/6J mice in a sex-specific manner. Arch. Tox 92, 1925–1937. doi: 10.1007/s00204-018-2206-z. [DOI] [PMC free article] [PubMed] [Google Scholar]
- Hughes MF, Kenyon EM, Edwards BC, Mitchell C,T, Thomas DJ, 1999. Strain-dependent disposition of inorganic arsenic in the mouse. 137, 95–108. doi: 10.1016/s0300-483x(99)00068-2. [DOI] [PubMed] [Google Scholar]
- Hughes MF, Edwards BC, Herbin-Davis KM, Saunders J, Styblo M, Thomas DJ, 2010. Arsenic (+3 oxidation state) methyltransferase genotype affects steady-state distribution and clearance of arsenic in arsenate-treated mice. Toxicol. Appl. Pharmacol 249, 217–223. doi: 10.1016/j.taap.2010.09.017. [DOI] [PubMed] [Google Scholar]
- IARC. 2004. International Agency for Research on Cancer. Arsenic in drinking water. IARC Press, Lyon, vol.84, pp. 269–477. [Google Scholar]
- Kahn BB and Flier JS, 2000. Obesity and insulin resistance. J. Clin. Invest 106, 473–481. doi: 10.1172/JCI10842. [DOI] [PMC free article] [PubMed] [Google Scholar]
- Keane TM, Goodstadt L, Danecek P, White MA, Wong K, Yalcin B, Heger A, Agam A, Slater G, Goodson M, Furlotte NA, Eskin E, Nellåker C,. Whitley H, Cleak J, Janowitz D, Hernandez-Pliego P, Edwards A, Belgard TG, Oliver PL, McIntyre RE, Bhomra A, Nicod J, Gan X, Yuan W, van der Weyden L, Steward CA, Bala S, Stalker J, Mott R, Durbin R, Jackson IJ, Czechanski A, Guerra-Assunção JA, Donahue LR, Reinholdt LG, Payseur BA, Ponting CP, Birney E, Flint J, Adams DJ, 2011. Mouse genomic variation and its effect on phenotypes and gene regulation. Nature. 477, 289–294. doi: 10.1038/nature10413. [DOI] [PMC free article] [PubMed] [Google Scholar]
- Koller BH, Snouwaert JN, Douillet C, Jania LA, El-Masri H, Thomas DJ, Stýblo M, 2020. Arsenic metabolism in mice carrying a BORCS7/AS3MT locus humanized by syntenic replacement. Environ. Health Perspect 128, 87003. doi: 10.1289/EHP6943. [DOI] [PMC free article] [PubMed] [Google Scholar]
- Kuo CC, Howard BV, Umans JG, Gribble MO, Best LG, Francesconi KA, Goessler W, Lee E, Guallar E, Navas-Acien A, 2015. Arsenic Exposure, Arsenic Metabolism, and Incident Diabetes in the Strong Heart Study. Diabetes Care. 38, 620–627. doi: 10.2337/dc14-1641. [DOI] [PMC free article] [PubMed] [Google Scholar]
- Kuo CC, Moon KA, Wang SL, Silbergeld E, Navas-Acien A, 2017. The Association of Arsenic Metabolism with Cancer, Cardiovascular Disease, and Diabetes: A Systematic Review of the Epidemiological Evidence. Environ. Health Perspect 125, 087001. doi: 10.1289/EHP577. [DOI] [PMC free article] [PubMed] [Google Scholar]
- Li J, Packianathan C, Rossman TG, Rosen BP, (2017) Nonsynonymous Polymorphisms in the Human AS3MT Arsenic Methylation Gene: Implications for Arsenic Toxicity. Chem. Res. Toxicol 30, 1481–1491. doi: 10.1021/acs.chemrestox.7b00113. [DOI] [PMC free article] [PubMed] [Google Scholar]
- Lin S, Shi Q, Nix FB, Styblo M, Beck MA, Herbin-Davis KM, Hall LL, Simeonsson JB, Thomas DJ, 2002. A novel S-adenosyl-L-methionine:arsenic(III) methyltransferase from rat liver cytosol. J. Biol. Chem 277, 10795–10803. doi: 10.1074/jbc.M110246200. [DOI] [PubMed] [Google Scholar]
- Lin YC, Chen WJ, Huang CY, Shiue HS, Su CT, Ao PL, Pu YS, Hsueh YM, 2018. Polymorphisms of Arsenic (+3 Oxidation State) Methyltransferase and Arsenic Methylation Capacity Affect the Risk of Bladder Cancer. Toxicol. Sci 164, 328–338. doi: 10.1093/toxsci/kfy087. [DOI] [PubMed] [Google Scholar]
- Liu S, Guo X, Wu B, Yu H, Zhang X, Li M, 2014. Arsenic induces diabetic effects through beta-cell dysfunction and increased gluconeogenesis in mice. Sci. Rep 4, 6894. doi: 10.1038/srep06894. [DOI] [PMC free article] [PubMed] [Google Scholar]
- Maull EA, Ahsan H, Edwards J, Longnecker MP, Navas-Acien A, Pi J, Silbergeld EK, Styblo M, Tseng CH, Thayer KA, Loomis D, 2012. Evaluation of the association between arsenic and diabetes: a national toxicology program workshop report. Environ. Health Perspect 120, 1658–1670. doi: 10.1289/ehp.1104579. [DOI] [PMC free article] [PubMed] [Google Scholar]
- Murko M, Elek B, Styblo M, Thomas DJ, Francesconi KA, 2018. Dose and Diet − Sources of arsenic intake in mouse in utero exposure scenarios. Chem. Res. Toxicol 31, 156–164. doi: 10.1021/acs.chemrestox.7b00309. [DOI] [PMC free article] [PubMed] [Google Scholar]
- Navas-Acien A, Silbergeld EK, Streeter RA, Clark JM, Burke TA, Guallar E 2006. Arsenic exposure and type 2 diabetes: a systematic review of the experimental and epidemiological evidence. Environ. Health Perspect 114, 641–648. doi: 10.1289/ehp.8551. [DOI] [PMC free article] [PubMed] [Google Scholar]
- Paul DS, Hernández-Zavala A, Walton FS, Adair BM, Dedina J, Matousek T, Stýblo M, 2007. Examination of the effects of arsenic on glucose homeostasis in cell culture and animal studies: development of a mouse model for arsenic-induced diabetes. Toxicol. Appl. Pharmacol 222, 305–314. doi: 10.1016/j.taap.2007.01.010. [DOI] [PMC free article] [PubMed] [Google Scholar]
- Paul DS, Devesa V, Hernandez-Zavala A, Adair BM, Walton FS, Drobna Z, Thomas DJ, Styblo M, 2008. Environmental arsenic as a disruptor of insulin signaling. Met. Ions Biol. Med 10:1–7. [PMC free article] [PubMed] [Google Scholar]
- Paul DS, Walton FS, Saunders RJ, Stýblo M, 2011. Characterization of the impaired glucose homeostasis produced in C57BL/6 mice by chronic exposure to arsenic and high-fat diet. Environ. Health Perspect 119, 1104–1109. doi: 10.1289/ehp.1003324. [DOI] [PMC free article] [PubMed] [Google Scholar]
- Pierce BL, Kibriya MG, Tong L, Jasmine F, Argos M, Roy S, Paul-Brutus R, Rahaman R, Rakibuz-Zaman M, Parvez F, Ahmed A, Quasem I, Hore SK, Alam S, Islam T, Slavkovich V, Gamble MV, Yunus M, Rahman M, Baron JA, Graziano JH, Ahsan H, 2012. Genome-wide association study identifies chromosome 10q24.32 variants associated with arsenic metabolism and toxicity phenotypes in Bangladesh. PLoS Genet. 8, e1002522. doi: 10.1371/journal.pgen.1002522. [DOI] [PMC free article] [PubMed] [Google Scholar]
- Pierce BL, Tong L, Argos M, Gao J, Farzana J, Roy S, Paul-Brutus R, Rahaman R, Rakibuz-Zaman M, Parvez F, Ahmed A, Quasem I, Hore SK, Alam S, Islam T, Harjes J, Sarwar G, Slavkovich V, Gamble MV, Chen Y, Yunus M, Rahman M, Baron JA, Graziano JH, Ahsan H, 2013. Arsenic metabolism efficiency has a causal role in arsenic toxicity: Mendelian randomization and gene-environment interaction. Int. J. Epidemiol 42, 1862–1871. doi: 10.1093/ije/dyt182. [DOI] [PMC free article] [PubMed] [Google Scholar]
- Srivastava A, Morgan AP, Najarian ML, Sarsani VK, Sigmon JS, Shorter JR, Kashfeen A, McMullan RC, Williams LH, Giusti-Rodríguez P, Ferris MT, Sullivan P, Hock P, Miller DR, Bell TA, McMillan L, Churchill GA, de Villena FP, 2017. Genome of the mouse Collaborative Cross. Genetics. 206, 537–556. doi: 10.1534/genetics.116.198838. [DOI] [PMC free article] [PubMed] [Google Scholar]
- Stýblo M, Douillet C, Bangma J, Eaves LA, de Villena FP, Fry R, 2019. Differential metabolism of inorganic arsenic in mice from genetically diverse Collaborative Cross strains. Arch. Toxicol 93, 2811–2822. doi: 10.1007/s00204-019-02559-7. [DOI] [PMC free article] [PubMed] [Google Scholar]
- Thomas DJ, Li J, Waters SB, Xing W, Adair BM, Drobna Z, Devesa V, Styblo M, 2007. Arsenic (+3 oxidation state) methyltransferase and the methylation of arsenicals. Exp. Biol. Med. (Maywood) 232, 3–13. [PMC free article] [PubMed] [Google Scholar]
- Tseng C-H, 2004. The potential biological mechanisms of arsenic-induced diabetes mellitus. Toxicol. Appl. Pharmacol 197, 67–83. doi: 10.1016/j.taap.2004.02.009. [DOI] [PubMed] [Google Scholar]
- Tseng C-H, Tseng C-P, Chiou H-Y, Hsueh Y-M, Chong C-K, Chen C-J, 2002. Epidemiologic evidence of diabetogenic effect of arsenic, Toxicol. Lett 133, 69–76. DOI: 10.1016/s0378-4274(02)00085-1. [DOI] [PubMed] [Google Scholar]
- Vahter M (1999) Methylation of inorganic arsenic in different mammalian species and population groups. Sci Prog. 82 (Pt 1):69–88. [DOI] [PMC free article] [PubMed] [Google Scholar]
- Vahter M 2000. Genetic polymorphism in the biotransformation of inorganic arsenic and its role in toxicity. Toxicol. Lett 112–113, 209–217. doi: 10.1016/s0378-4274(99)00271-4. [DOI] [PubMed] [Google Scholar]
- Wallace TM, Levy JC, Matthews DR, 2004. Use and abuse of HOMA modeling. Diabetes Care. 27, 1487–1495. doi: 10.2337/diacare.27.6.1487. [DOI] [PubMed] [Google Scholar]
- Xu X, Drobná Z, Voruganti VS, Barron K, González-Horta C, Sánchez-Ramírez B, Ballinas-Casarrubias L, Cerón RH, Morales DV, Terrazas FA, Ishida MC, Gutiérrez-Torres DS, Saunders RJ, Crandell J, Fry RC, Loomis D, García-Vargas GG, Del Razo LM, Stýblo M, Mendez MA, 2016. Association Between Variants in Arsenic (+3 Oxidation State) Methyltranserase (AS3MT) and Urinary Metabolites of Inorganic Arsenic: Role of Exposure Level. Toxicol. Sci 153, 112–123. doi: 10.1093/toxsci/kfw1 [DOI] [PMC free article] [PubMed] [Google Scholar]
- Yang K, Xun P, Carnethon M, Carson AP, Lu L, Zhu J, He K, (2019) Low to moderate toenail arsenic levels in young adulthood and incidence of diabetes later in life: findings from the CARDIA Trace Element study. Environ. Res 171, 321–327. doi: 10.1016/j.envres.2019.01.035. [DOI] [PMC free article] [PubMed] [Google Scholar]
- Yokohira M, Arnold LL, Pennington KL, Suzuki S, Kakiuchi-Kiyota S, Herbin-Davis K, Thomas DJ, Cohen SM, 2010. Severe systemic toxicity and urinary bladder cytotoxicity and regenerative hyperplasia induced by arsenite in arsenic (+3 oxidation state) methyltransferase knockout mice. A preliminary report. Toxicol. Appl. Pharmacol 246, 1–7. doi: 10.1016/j.taap.2010.04.013. [DOI] [PubMed] [Google Scholar]
- Yokohira M, Arnold LL, Pennington KL, Suzuki S, Kakiuchi-Kiyota S, Herbin-Davis K, Thomas DJ, Cohen SM, 2011. Effect of sodium arsenite dose administered in the drinking water on the urinary bladder epithelium of female arsenic (+3 oxidation state) methyltransferase knockout mice. Toxicol. Sci 121, 257–66. doi: 10.1093/toxsci/kfr051. [DOI] [PubMed] [Google Scholar]
Associated Data
This section collects any data citations, data availability statements, or supplementary materials included in this article.