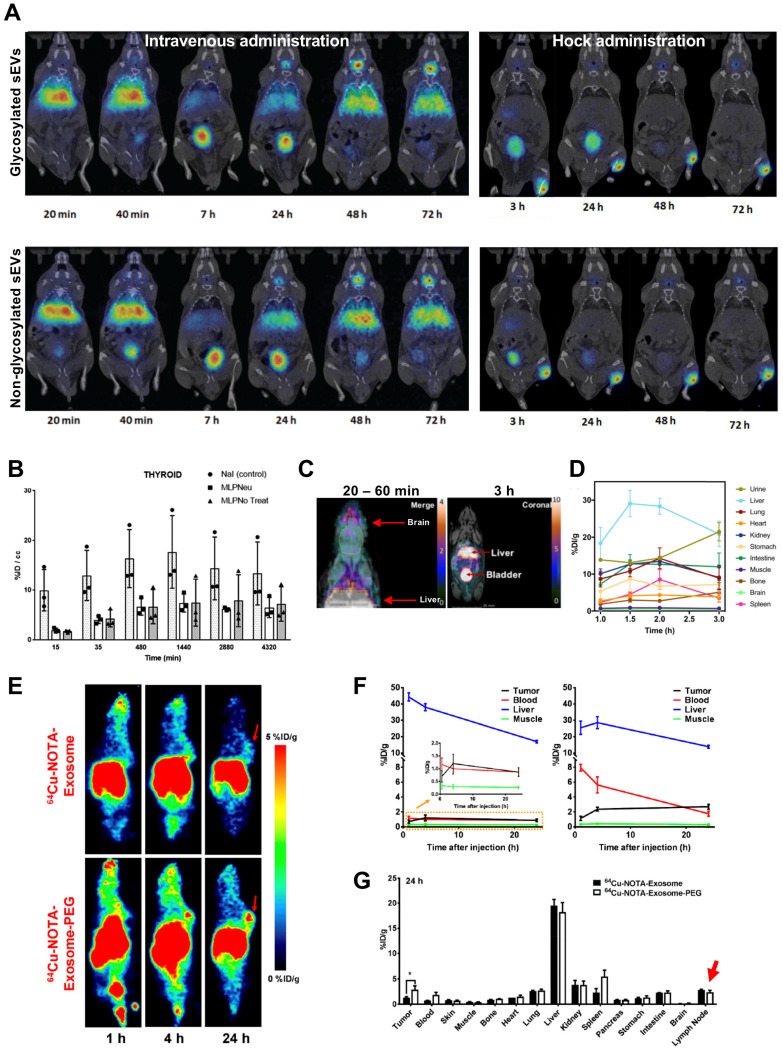
Figure 8.
(A) In vivo biodistribution of 124I-labelled MLP29 sEVs following iv. and hock administration. (B) Ex vivo biodistribution of 124I-labelled MLP29 sEVs in the thyroid over time for NaI (control), glycosylated sEVs (MLPNeu) and non-glycosylated sEVs (MLPNo Treat) following iv. administration, data given as mean ± standard deviation (SD) of n = 3. Figures adapted with permission from Royo et al. 89 (C) PET-MR images of iv. administered [64Cu]Cu-DTPA labelled sEVs 20 - 60 min and 3 h post injection. (D) Ex vivo biodistribution of [64Cu]Cu-DTPA labelled sEVs at 1, 1.5 and 2 h post injection; data represented as mean ± SEM of n = 3-4. Figures adapted with permission from Banerjee et al. 90 (E) In vivo PET images, and (F) time activity curves of iv. administered [64Cu]Cu-NOTA labelled 4T1 sEVs comparing the biodistribution of PEGylated and non-PEGylated sEVs in 4T1 tumour bearing female BALB/c mice over time. (G) Ex vivo biodistribution of 64Cu-4T1 sEVs, PEGylated or non-PEGylated, in 4T1 tumour bearing female BALB/c mice 24 h post injection. Red arrow highlights lymph node uptake. Data expressed as mean ± SD of n = 3. Figures taken with permission from Shi et al. 91.

