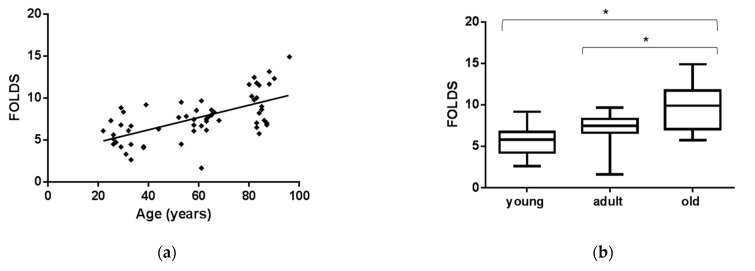
Figure 2.
MiR-126-3p levels in sEVs of CTRs are modulated by aging. Scatterplots showing relative miR-126-3p expression according to age in CTRs (a). Box and Whiskers indicate median, minimum and maximum levels of miR-126-3p in sEVs from plasma of healthy CTRs divided in age class (24–44 years, n = 20), adult (53–68 years, n = 20) and old (81–96 years, n = 20) (b). CTs (cycle thresholds) resulting from qRT-PCR analysis were normalized with mir-30a; levels were calculated with 2-ΔCT method and expressed as folds, with respect to lowest value registered. Comparison among multiple groups was analyzed by one-way analysis of variance, followed by Bonferroni’s post hoc test. * p < 0.01.

