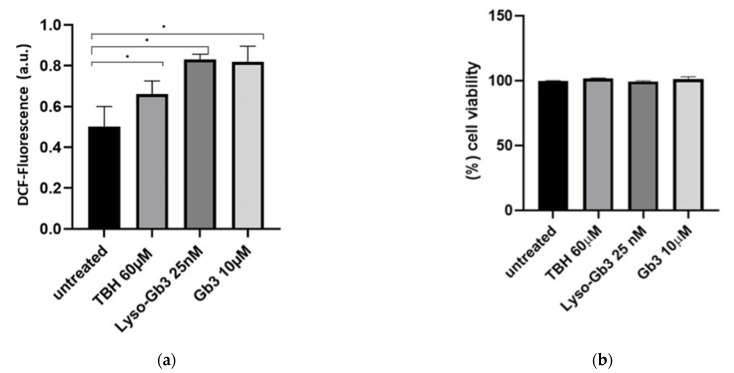
Figure 7.
Lyso-Gb3 and Gb3 effect on HUVECs. Intracellular ROS levels and cell viability were assayed in HUVECs treated with TBH 60 µM, Lyso-Gb3 25 nM, and Gb3 10 µM. Intracellular ROS were measured as fluorescence intensity, using a DCFH-DA probe. The results, in arbitrary units (au), are presented as mean ± SD of three different experiments analyzed in triplicate (a). Cell viability was evaluated with MTS assay. The results presented as mean % of viable cells ± SD of three different experiments analyzed in triplicate (b). Comparison among multiple groups was analyzed by one-way analysis of variance, followed by Bonferroni’s post hoc test. * p < 0.01.

