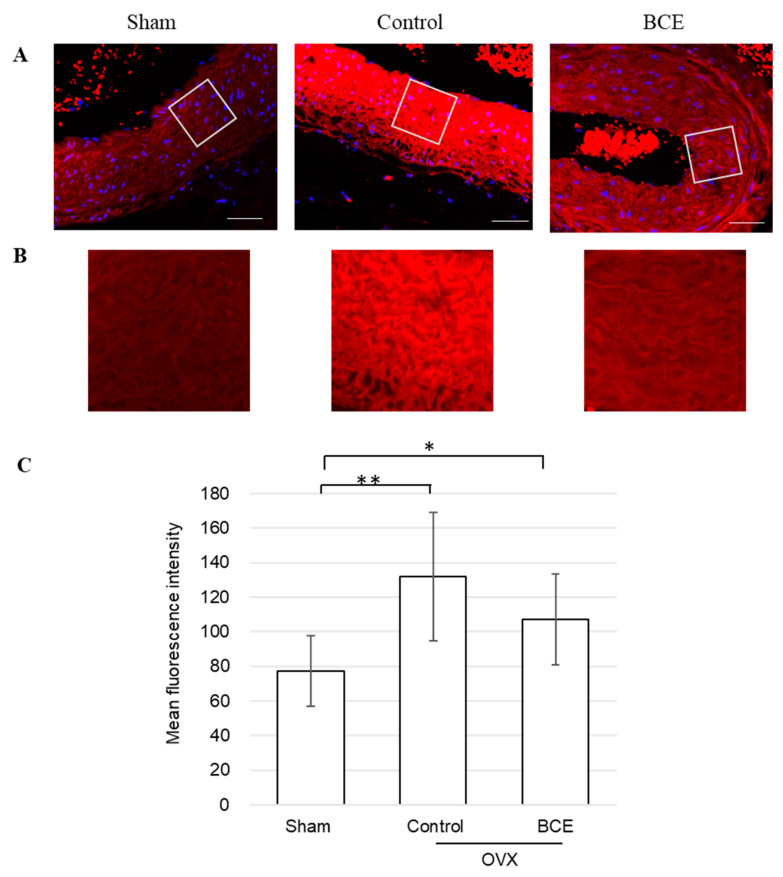
Figure 3.
Representative images of immunofluorescence-stained tissues, evaluated for α-SMA protein expression. (A) Smooth muscle cells stained with TRITC (red) and counter-stained with DAPI (blue) to visualize the nuclei (400× magnification; scale bar = 50 µm). (B) Fluorescence intensity of the images enlarged for clarity. (C) Quantification of α-SMA protein fluorescence. Data are shown as means ± SEM; n = 11 (Sham), n = 12 (Control) and n = 11 (BCE). * p < 0.05, ** p < 0.01. OVX, ovariectomized; BCE, blackcurrant (Ribes nigrum L.) extract; SMA, smooth muscle actin; SEM, standard error of the mean.

