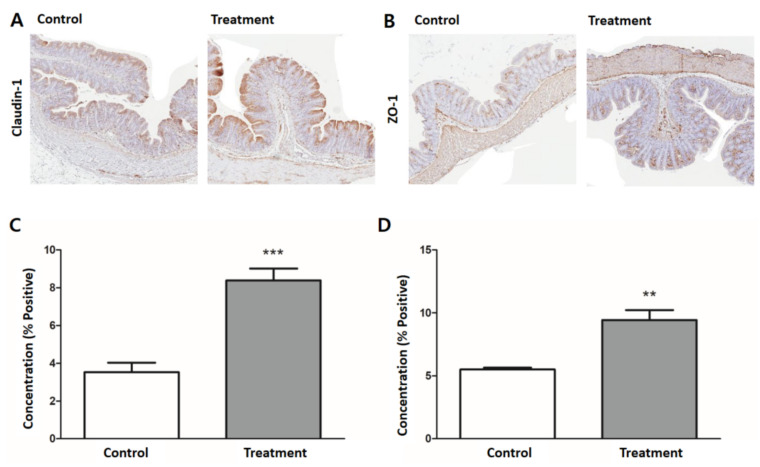
Figure 6.
Expression of colonic tight junction proteins. Representative H&E-stained images of colon tissue for (A) claudin-1 and (B) ZO-1 by immunohistochemistry (200× magnification). Quantification of (C) claudin-1 and (D) ZO-1 expression were significantly higher in the treatment group (gray bar) than the control group (white bar). Results are expressed as mean ± SEM (n = 7/group). ** p < 0.01, *** p < 0.001.

