Figure 3.
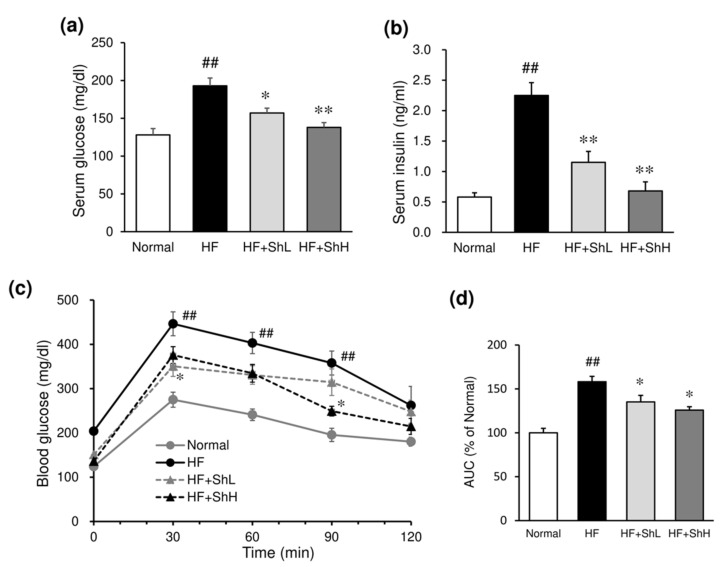
Effects of S. horneri on serum glucose and insulin levels and on the insulin resistance in C57BL/6J mice fed a high-fat diet. Serum levels of glucose (a) and insulin (b) were determined 13 weeks after high-fat diet ingestion. Insulin resistance (c) was evaluated in glucose tolerance test on the 12th week after high-fat diet ingestion, and the area under the curve (AUC) was calculated (d). Normal, normal diet; HF, high-fat diet; HF + ShL: high-fat diet mixed with 2% S horneri; HF + ShH: high-fat diet mixed with 6% S horneri. Each value represents the mean ± SEM (n = 6−8). Significant difference: * p < 0.05, ** p < 0.01 vs. HF group, ## p < 0.01 vs. Normal group.

