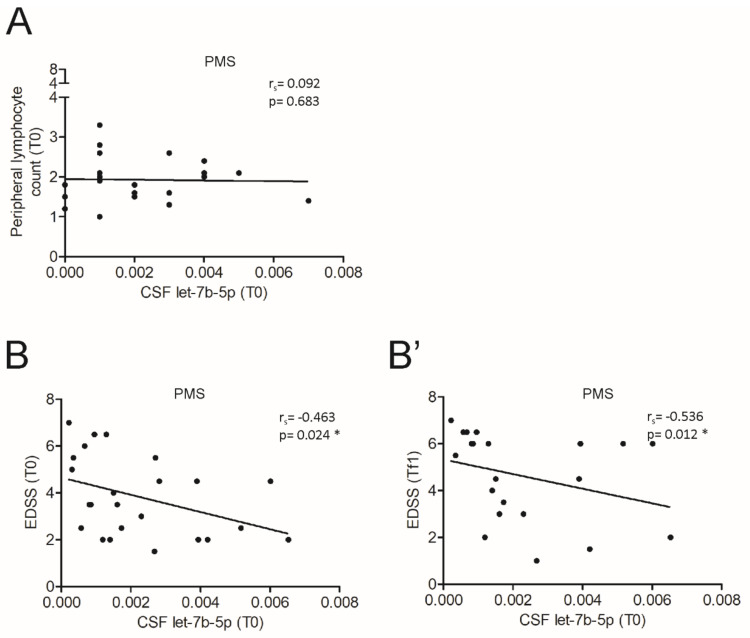
Figure 6.
The CSF level of let-7b-5p correlates with disease severity in MS progressive phase. (A) Correlation plot between let-7b-5p levels and the count of peripheral T cells of PMS patients (n = 22, A) at T0. (B,B’) Correlation plot between let-7b-5p levels and EDSS of PMS patients at T0 (n = 24, B) and after a follow-up period ((Tf1), n = 21, B’). A negative correlation was observed at both T0 (Spearman’s correlation, Spearman’s r = −0.463, * p < 0.05) and Tf1 (Spearman’s correlation, Spearman’s r = −0.536, * p < 0.05).

