Abstract
Mitochondrial morphology plays a critical role in regulating mitochondrial and cellular function. It is well established that oxidative stress and mitochondrial injury are central to acetaminophen (APAP) hepatotoxicity. However, the role of mitochondrial dynamics, namely the remodeling of mitochondrial morphology through fusion and fission, has largely gone unexplored. To investigate this, we used primary mouse hepatocytes treated with APAP which allowed for real-time visualization of mitochondrial morphology using mitotracker green. We found that alterations in mitochondrial morphology were dose dependent, with a biphasic response in mitochondrial shape at higher APAP doses. Importantly, these two distinct mitochondrial morphologies corresponded with differences in mitochondrial respiratory function and polarization. The early change in mitochondrial morphology can be reversible and appears to be an adaptive response caused by alterations in membrane potential, which ultimately help preserve mitochondrial function. The later delayed change in mitochondrial morphology is irreversible and is driven by loss of mitochondrial membrane potential, decreased canonical fusion proteins, and alterations in mitochondrial lipid composition. Collectively, these later changes tilt the scales toward mitochondrial fission resulting in fragmented mitochondria with reduced functionality. This work provides evidence of adaptive early changes in mitochondrial morphology, which results in functional consequences that are dictated by the severity of APAP overdose.
Keywords: acetaminophen hepatotoxicity, mitochondria, morphology, membrane potential, mitochondrial dynamics
Acetaminophen (APAP) is a commonly used analgesic and antipyretic drug, which while safe at therapeutics doses, causes severe hepatotoxicity with an overdose and can potentially lead to acute liver failure. Correspondingly, APAP hepatotoxicity is the leading cause of drug-induced acute liver failure in the United States (Hodgman and Garrard, 2012; Yoon et al., 2016). At a therapeutic dose, APAP primarily undergoes Phase II metabolism where it is conjugated in the liver with glucuronic acid or sulfate and excreted in the urine. A small percentage will be oxidized by cytochrome P450 enzymes to the reactive metabolite N-acetyl-p-benzoquinone imine (NAPQI), which can be rapidly scavenged through conjugation with glutathione (GSH), rendering it inert (McGill and Jaeschke, 2013). However, with an overdose of APAP, an abundance of NAPQI is generated, which depletes intracellular GSH. The electrophilic NAPQI will then react with electron-rich elements such as sulfhydryl groups of cellular proteins (Jollow et al., 1973). This process readily occurs within mitochondria leading to the formation of reactive oxygen species triggering the activation of c-jun N-terminal kinase (JNK) (Nguyen et al., 2020; Jaeschke et al., 2012). The resulting JNK mitochondrial translocation and amplification of mitochondrial dysfunction results in the collapse of the mitochondrial membrane potential, opening of the mitochondrial permeability transition pore (MPTP), and release of cellular nucleases causing DNA fragmentation and cell death (McGill et al., 2012; Ramachandran and Jaeschke, 2019).
Mitochondrial function and quality is a primary determinant of cellular fate during APAP overdose. Further, mitochondria are highly dynamic organelles constantly undergoing remodeling processes of fission and fusion in response to their external and internal environment (Sprenger and Langer 2019). The importance of mitochondrial dynamics in APAP overdose was recognized when it was shown that the mitochondrial fission protein, DRP-1, translocated to the mitochondria after APAP exposure suggesting that mitochondrial dynamics may influence APAP-related cell signaling (Ramachandran et al., 2013). Changes in mitochondrial morphology can also influence the extent of APAP-induced centrilobular necrosis (Ni et al., 2013) by induction of adaptive processes such as mitophagy (Ni et al., 2012), or enhancing recovery through mitochondrial biogenesis (Du et al., 2017). Changes in mitochondrial morphology induced by APAP have predominantly been characterized at the peak of injury, when significant liver necrosis is ongoing (Ding et al., 2012; Ramachandran et al., 2013). However, a number of studies have demonstrated unique mitochondrial morphological changes as adaptive responses (Liu and Hajnoczky, 2011), which probably occur very early after initiation of APAP-induced injury. Based on the hypothesis that very early changes in mitochondrial morphology could be adaptive responses distinct from mitochondrial fission seen at the peak of injury, this study focused on early time points after APAP and investigated the temporal relationship between mitochondrial morphology, function, and polarization during the early injury phase of APAP exposure. We found that mitochondria undergo a biphasic alteration in mitochondrial morphology in response to APAP, with an early red blood cell (RBC)-like discoid appearance corresponding with a slight loss in membrane potential without change in respiratory function, followed by a fragmented morphology corresponding with significant loss in membrane potential and functional respiratory capacity. Although the early change is driven by the decrease in mitochondrial membrane potential, the later mitochondrial fragmentation involves alterations in canonical mitochondrial fission/fusion proteins. Our results suggest a model whereby the early change in mitochondrial morphology is an attempt to preserve individual mitochondrial function to facilitate rapid recovery and mitochondrial fission is only evident when the loss of mitochondrial membrane potential is persistent.
MATERIALS AND METHODS
Animals
Male C57BL/6J mice (Jackson Laboratories, Bar Harbor, Maine) 8–12 weeks of age were acquired and kept under a 12:12-h light/dark cycle and given ad libitum access to food and water. All experimental protocols followed the criteria of the National Research Council for the case and use of laboratory animals and were approved by the Institutional Animal Care and Use Committee of the University of Kansas Medical Center.
Primary mouse hepatocyte isolation
Mice were fasted but given 5% sucrose solution overnight before sacrifice. Primary hepatocytes were isolated as described (Bajt et al., 2004) with a few modifications. Briefly, mice were anesthetized by i.p. injection with ketamine/xylazine solution (ketamine: 200 mg/kg, xylazine: 10 mg/kg) and murine hepatocytes isolated by retrograde, nonrecirculating perfusion of livers with 100 ml of perfusion buffer (1× HBSS with Ca++/Mg++, 100 U/ml penicillin, 100 µg/ml streptomycin, 10 mM HEPES, 0.025 mg/ml collagenase). The average number of cells isolated per mouse liver was 35–45 × 106 hepatocytes. Cell viability and cell number were determined by trypan blue exclusion by counting cells on a hemocytometer using an inverted microscope. All experiments used cells with a viability of 90% or greater. Cells were plated in William’s Medium E (GIBCO) containing 10% fetal bovine serum (GIBCO), 100 U/ml penicillin/streptomycin (1%) and cultured at 37°C with 5% CO2. After an initial 5-h attachment period, cultures were washed with phosphate-buffered saline (PBS) and cell culture medium was changed to Williams Medium E, 10% FBS, 1% penicillin/streptomycin. The following day the cultures were washed with PBS and then plain culture medium (controls) or media containing various concentrations of APAP (1, 2, 5 or 10 mM) were added. For experiments involving the DMSO-soluble JNK inhibitor SP600125 (Millipore Sigma, St. Louis, Missouri), APAP (10 mM) was administered to primary mouse hepatocytes (PMHs) and then 2.5 h later SP600125 was added (final concentration: 50 µM). For experiments involving the water-soluble JNK inhibitor, CC401 (Tocris, Bristol, UK) (final concentration: 5 µM), APAP (10 mM), and CC401 were co-administered.
Live cell imaging for mitochondrial morphology
MitoTracker Green (MTG) (ThermoFisher Scientific, Catalog number: M7514) is a green-fluorescent cationic probe that will aggregate in the mitochondria regardless of mitochondrial membrane potential. PMHs were seeded at a density of 1.8 × 10⁵ in cover glass bottom dishes (FluoroDish, World Precision Instruments). MTG was added to Williams Medium E (10% FBS, 1% penicillin/streptomycin) to a final concentration of 250 nM. After a 30-min incubation, initial images were captured using a Zeiss inverted microscope with an AxioCam MRm camera. Cell media was then replaced with media + APAP at various concentrations as mentioned. Subsequent images were captured at definite intervals to characterize the changes in mitochondrial morphology over time. For some experiments, cells were treated with the Drp1 inhibitor Mdivi, which was dissolved in DMSO and added 2.5 h after the addition of APAP to a final concentration of 50 µM. For experiments involving FCCP, initial images were collected and then the cell media was changed to cell culture media containing FCCP (final concentration: 5 µM). Images were processed and assembled using FIJI. The length of the mitochondria (mitochondrial branch length) was determined using Mitochondria Analyzer, a plug-in available through FIJI. The optimal thresholding conditions were first determined for each image before subsequent analysis and measurement.
Mitochondrial respiratory measurements
Oxygen consumption rate (OCR) was measured in real-time using a XF24 Extracellular Flux Analyzer (Seahorse Bioscience, Billerica, Massachusetts) according to the manufacturer’s protocol. Mouse primary hepatocytes were seeded in collagen-coated XF24-V7 plates using Williams Medium E containing 5% FBS, 1% Glutamax, 1% penicillin/streptomycin (30,000 cells for mouse primary hepatocytes per well in 100 μl). After 5 h, cells were washed with PBS and then 300 μl Williams E media was added and the cells were further incubated overnight at 37°C, 5% CO2. The XF24sensor cartridge was hydrated with 1 ml calibration buffer per well overnight at 37°C. The following morning, the cells were washed with PBS and Williams Medium E containing a final concentration of 10 mM APAP was added to the cells. Media containing APAP was removed at the corresponding time points and then the cells were washed twice with prewarmed XF assay medium containing 25 mM glucose and 1 mM sodium pyruvate and then incubated in XF assay medium at 37°C without CO2 for 1 h. The sensor cartridge was loaded with oligomycin (8 μM, port A), carbonyl cyanide 4-(trifluoromethoxy) phenylhydrazone (FCCP, 2.7 μM, port B), and rotenone plus antimycin A (10 μM each, port C) to measure the cellular respiration (concentrations listed represent the final concentration). The sensor cartridge was inserted into the Seahorse XF24 analyzer allowing for calibration, and then was replaced with the experimental cell culture plate. The assay was continued using the Mito Stress Test assay protocol as described by Nicholls et al. (2010). OCR was detected under basal conditions followed by the sequential addition of oligomycin, FCCP followed by rotenone, and antimycin A. This allowed for the measurement of independent bioenergetic parameters: basal respiration, proton leak, maximal respiration capacity, spare reserve respiration capacity, and nonmitochondrial respiration.
Mitochondrial membrane potential measurement
Mitochondrial membrane potential was analyzed with the cationic fluorescent dye JC-1 (Cell Technology, Product Code: JC100). JC-1 exists in a monomeric form in the cytosol where it has absorption/emission maxima of 510/527 nm. However, when it aggregates within mitochondria, there is a fluorescence emission shift to absorption/emission maxima of 585/590. Cells were seeded at a density of 3 × 10⁵ in Williams Medium E containing 10% FBS, 1% penicillin/streptomycin in 12-well plates (Corning Costar). Cells were washed once with PBS and resuspended in JC-1 reagent containing assay buffer (Cell Technology) for 15 min 37°C with 5% CO2. After 15 min, JC-1 reagent was removed, and cells were washed twice with 1× assay buffer (Cell Technology) and analyzed using a Gemini EM Spectrofluorometer running SOFTmax Pro 4.3 LS software. Mitochondrial polarization was determined by the red/green intensity ratio. For some experiments, tetramethylrhodamine methyl ester (TMRM), which is a mitochondrial probe with excitation/emission maxima of 548/574 nm that is responsive to changes in mitochondrial membrane potential was also used. TMRM was loaded onto PMHs at a final, nonquenching concentration of 30 nM for 30 min. After initial imaging, the cell culture media was changed to media containing FCCP (final concentration: 5 µM). Images were then captured at 1 h post addition of FCCP. The corrected total fluorescence (CTF) was calculated using FIJI by measuring the integrated density and normalizing it by the mean fluorescence of the background signal.
Western blotting
After treatments, lysis buffer containing 25 mM HEPES, 5 mM EDTA, 0.1% CHAPS, and 1 mg/ml of pepstatin, leupeptin, and aprotinin was added to hepatocytes for 5 min on ice. Cells were removed from wells with a cell scraper and sonicated followed by total protein measurement with the BCA assay (Pierce Scientific, Waltham, Massachusetts). One hundred micrograms of protein was loaded and gel electrophoresis was carried out on cell lysates which were then transferred to a nitrocellulose blot. Blots were blocked in 5% milk diluted in Tris-buffered saline with Tween-20 (TBST) for 1 h, followed by three 5-min washes in TBST. Blots were incubated in primary antibody overnight at 4°C followed by next day incubation with a secondary antibody for 1–2 h. Densitometry was performed to quantitatively assess differences using Image J software. Densitometry was performed serially on blots and normalized to beta-actin as indicated in the text. Primary antibodies (1:1000 dilution) used were Drp1 (catalog no. 611112, BD Biosciences), β-actin (catalog no. 3700, Cell Signaling, Mouse), β-actin (catalog no. 4970, Cell Signaling, Rabbit), Mfn2 (catalog no. 9482, Cell Signaling), Mfn1 (catalog no. 14739, Cell Signaling), JNK (catalog no. 9252, Cell Signaling), p-JNK (catalog no. 4668, Cell Signaling). Secondary antibodies used for detection either employed a fluorescent or chemiluminescent system, these antibodies were IRDye 680 RD Donkey anti-Mouse (Li-COR, 1:10,000), IRDye 800CW Goat anti-Rabbit (Li-COR, 1:10 000) or horseradish peroxidase-coupled anti-mouse or anti-rabbit IgG (Amersham Biosciences Inc., Piscataway, New Jersey).
Phosphatidic acid measurements
Phosphatidic acid (PA) was measured in mitochondria isolated from PMHs following 10 mM APAP exposure at the timepoints indicated in the text. Mitochondria were isolated as described previously (Bajt et al., 2008). PA was measured using the Total Phosphatidic Acid Assay Kit (catalog no. MET-5019, Cell Bio-labs, San Diego, California) according to the manufacturer’s instructions. Briefly, the assay uses a coupled enzymatic reaction where a PA specific lipase hydrolyzes phosphatidic acid to glycerol-3-phosphate, which is further oxidized resulting in the production of hydrogen peroxide. The released hydrogen peroxide reacts with the fluorometric probe and was detected at excitation of 530 nm and emission of 595 nm using the Gemini EM Spectrofluorometer running SOFTmax Pro 4.3 LS software.
Statistics
All results were expressed as mean ± SEM. Comparison between two groups was performed with a Student’s t test. Comparisons between multiple groups were performed using one-way ANOVA followed by post hoc analysis (Tukey-Kramer). The alpha-level was set at 0.05 (p < .05).
RESULTS
APAP Overdose Causes an Early Global Shift in Mitochondrial Morphology in Isolated Mouse Hepatocytes
Initial experiments evaluating mitochondrial morphology utilized isolated primary mouse hepatocytes (PMHs) exposed to a cytotoxic concentration of 10 mM APAP. We used MTG (250 nM) staining to visualize hepatocyte mitochondria. Mitochondria exhibit a diverse array of morphology in untreated hepatocytes (Figs. 1A and 1E–H), with typically rod-like and elongated morphology. However, following APAP treatment there is a global shift over time, from this elongated phenotype to a rounded, biconcave appearance (spheroid) (Figure 1B) by 4 h after APAP. This morphology is more pronounced by 9 h, where the mitochondria have further decreased in size, adopting a “fragmented” or punctate appearance (Figure 1C). Further, at 9 h there is evidence of a perinuclear clearing of mitochondria around the nucleus. By 24 h, there is extended perinuclear clearing and greater fragmentation of the mitochondria (Figure 1D), with the controls remaining unchanged during this time (Figs. 1E–H). Quantitation of these changes over time clearly indicates a time-dependent decrease in mitochondrial length (Figure 2A). These APAP-induced changes in mitochondrial morphology are dose dependent, with cells treated with 5 mM APAP showing spheroid appearance in some mitochondria (Supplementary Figure S1F) by 4 h when compared with controls (Supplementary Figs. S1A–C) and it was only by 9 h that global change in mitochondrial morphology was evident (Supplementary Figure S1I), similar to that seen at 4 h in the 10 mM APAP group (Figure 1B). The lowest APAP concentrations of 1 and 2 mM showed no change in mitochondrial morphology at either 4 or 9 h, though by 24 h all concentrations produced fragmented mitochondria (Supplementary Figs. S1D, E, G, H and J, K, L). This suggests a delayed change in mitochondrial morphology with lower APAP concentrations.
Figure 1.
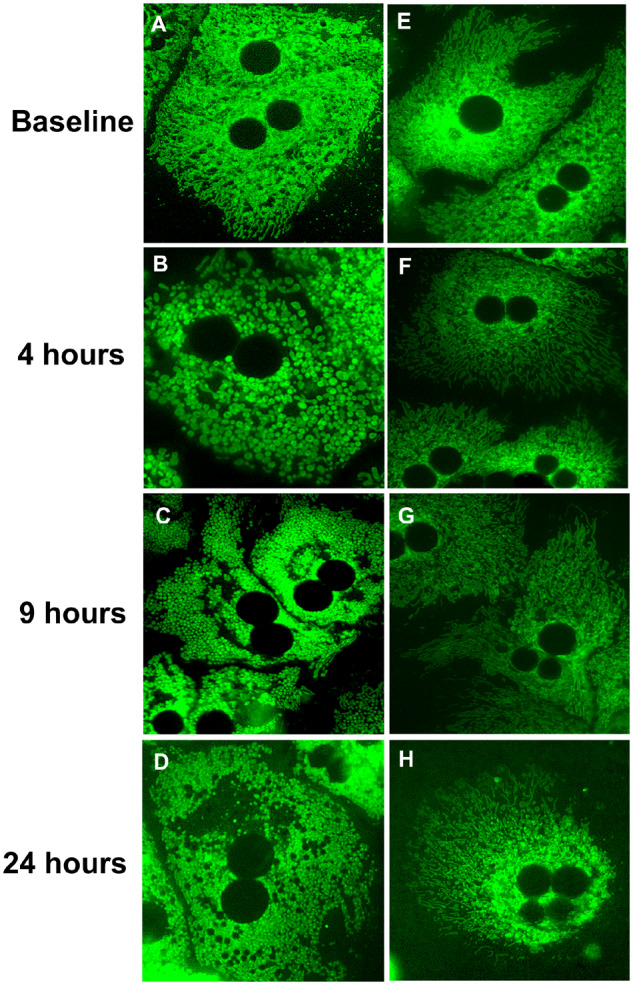
The 10 mM APAP treatment causes a global shift in the mitochondrial morphology from an elongated phenotype to a punctate appearance. (A–D) Time course of primary mouse hepatocytes (PMHs) stained with the cationic probe, mitotracker green (MTG) following 10 mM APAP. (E–H) Time-matched controls (no APAP).
Figure 2.
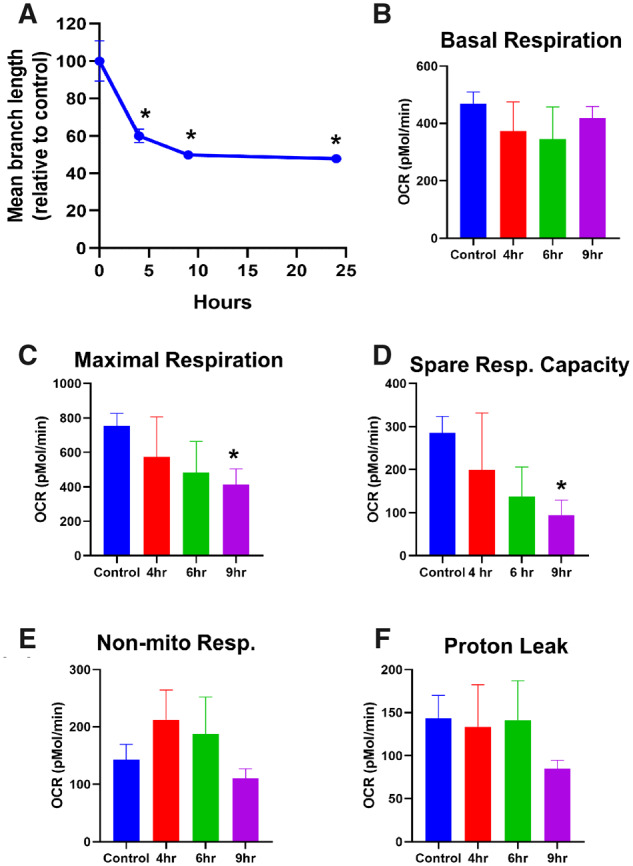
Temporal course of change in morphology and mitochondrial respiratory parameters after APAP treatment. PMHs were treated with 10 mM APAP, followed by quantitation of mitochondrial length (A) and measurement of mitochondrial respiratory parameters such as basal respiration (B), maximal respiration (C) spare respiratory capacity (D), nonmitochondrial respiration (E), and proton leak (F) on the XF Seahorse. Error bars represent mean ± SEM for 4 separate analyses. *p < .05 compared with control.
Only Delayed Change in Mitochondrial Morphology After APAP Is Accompanied by Compromised Respiratory Status
To determine the functional consequence of these changes to mitochondrial morphology, we next assessed mitochondrial respiratory function in PMHs after 10 mM APAP. No significant change was evident in basal respiration throughout the time course up to 9 h (Figure 2B), and although maximal respiratory rates decreased slightly at the earlier time point, a significant decrease was only observed by 9 h (Figure 2C), correlating with the appearance of fragmented mitochondria (Figure 1C). Spare respiratory capacity, which is essentially a measure of how close the cell is operating to its bioenergetic limit, also decreased gradually, with significant loss by 9 h after APAP (Figure 2D). Examination of nonmitochondrial respiration in cells, such as the activity of cytochrome P450s, showed a slight elevation at 4 h with subsequent decline (Figure 2E), which aligns with the metabolism of APAP. Interestingly, proton leak largely remained unchanged until 9 h where it decreased, although it did not reach statistical significance (Figure 2F). This suggests that mitochondrial coupling and some respiratory function are maintained over the course of the early morphological alterations up to 6 h after APAP and functional changes are only evident by the 9 h time point when fragmented mitochondria are visible.
Early Change in Mitochondrial Morphology Is Induced by Loss of Mitochondrial Membrane Potential
The maintenance of mitochondrial respiratory control over these early time points suggests that the change in morphology is likely an adaptive response, rather than caused due to catastrophic mitochondrial dysfunction. The next series of experiments thus investigated mechanisms behind this early APAP-induced change in mitochondrial morphology by evaluating temporal alterations in mitochondrial membrane potential after exposure to 10 mM APAP. APAP exposure resulted in a drop in mitochondrial membrane potential within 4 h, but only showed statistically significant decrease by 9 h after treatment (Figure 3A). The initial loss in mitochondrial membrane polarization corresponded with the appearance of the mitochondrial spheroid (Figure 1B) and the later, statistically significant decrease in mitochondrial polarity coincided with appearance of punctate mitochondria (Figure 1C). Because similar changes have been shown to be independent of the canonical pathways of mitochondrial fission (Miyazono et al., 2018) the role of the critical mitochondrial fission protein, Drp1 in the process was next interrogated. Treatment of hepatocytes with the putative Drp1 inhibitor Mdivi in combination with 10 mM APAP failed to attenuate the loss in mitochondrial membrane potential (Figure 3A) and did not prevent the change in mitochondrial morphology (Figs. 3B, 3D, and 3F). Importantly, addition of Mdivi alone to PMH blocked endogenous mitochondrial fission, resulting in gradual increase in elongated mitochondria (Figure 3B) confirming that Mdivi treatment conditions were inhibiting Drp1 to prevent classical mitochondrial fission. This data suggests that the APAP-induced early change in mitochondrial morphology was independent of Drp1 and likely induced by the loss of membrane potential. To confirm this, experiments were repeated with the uncoupler FCCP, which dissipates the mitochondrial membrane potential. FCCP treatment resulted in mitochondrial fragmentation (Figure 4A), and addition of Mdivi had no effect on this change in morphology (Figs. 4A and 4B), which occurred independent of any change in the expression level of Mitofusin-2 (Mfn2) or Drp1 (Figs. 4D and 4E). Measurement of mitochondrial membrane potential with TMRM verified that FCCP dissipated membrane potential (Figure 4C), confirming that the early mitochondrial spheroid formation induced by APAP is due to the initial loss of mitochondrial membrane potential, independent of canonical pathways of mitochondrial fission. This relationship between membrane potential and change in mitochondrial morphology was further confirmed by treating PMHs with 5 mM APAP, which showed delayed mitochondrial spheroid formation (Supplementary Figure S1J). Treatment with 5 mM APAP resulted in a reduction in the rate of decline in membrane potential compared with 10 mM APAP (Figure 3A vs. Supplementary Figure S2A), which aligns with the delayed changes in mitochondrial morphology at the 5 mM dose, and Mdivi treatment did not provide significant protection against this change (Supplementary Figs. S2B and S2C).
Figure 3.
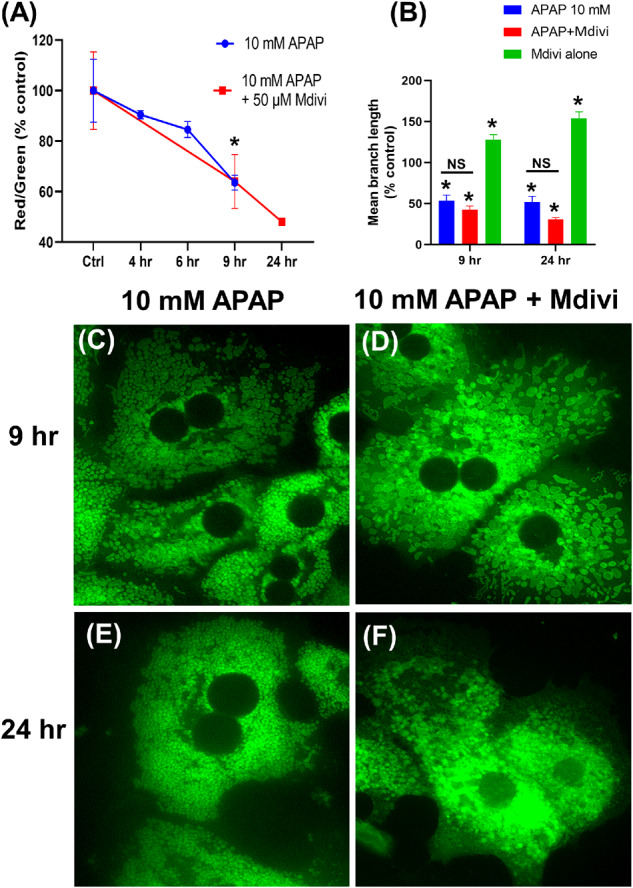
Temporal change in mitochondrial membrane potential and morphology after treatment of PMHs with 10 mM APAP with or without the Drp1 inhibitor Mdivi. Mitochondrial membrane potential measured by JC-1 fluorescence (A) and quantitation of mitochondrial length with the various treatments (B). Error bars represent mean ± SEM for n = 3 mice. *p < .05 10 mM APAP compared with control. (C–F) Representative images showing mitochondrial morphology after staining cells with MTG.
Figure 4.
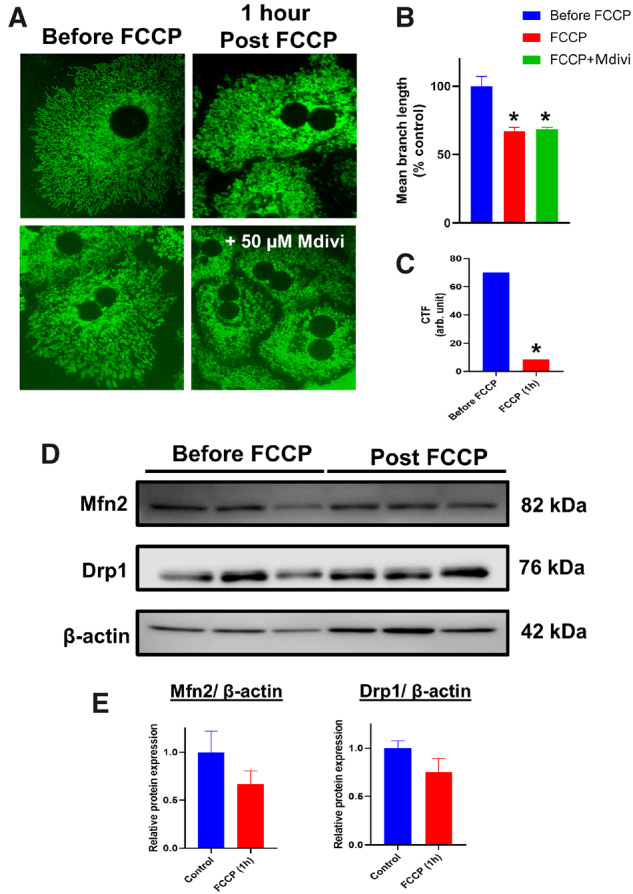
Mitochondrial uncoupling induces mitochondrial fragmentation independently of canonical fission/fusion protein expression. Representative images of PMHs stained with MTG treated with FCCP with or without Mdivi (A) and quantitation of mitochondrial length under these conditions (B). Mitochondrial membrane potential measured by TMRM staining after FCCP (C) and representative Western blots examining Mfn2 and Drp1 levels after FCCP treatment (D) and their densitometric quantitation (E). Error bars represent mean ± SEM for n = 3 mice. *p < .05 compared with control.
APAP-Induced Early Alterations in Mitochondrial Morphology Are Reversible in a Concentration-Dependent Manner
Earlier evidence from cardiomyocytes have indicated that formation of mitochondrial spheroids could be an adaptive response (Liu and Hajnoczky, 2011), and experiments were repeated with the lower 5 mM dose to investigate if the APAP-induced change in mitochondrial morphology was reversible. Interestingly, washing out APAP 6 h after exposure, when mitochondrial spheroids were evident, resulted in recovery of filamentous mitochondrial morphology within 3 h after washout (Figs. 5A and 5B). In addition, removal of APAP after 6 h also slowed the loss of mitochondrial membrane potential by 24 h (Figure 5C), indicating that these changes were reversible at the lower dose. This recovery indicates that spheroid formation is an adaptive response distinct from the mitochondrial fission evident at the later time points after APAP. This is concentration dependent however, because washout after exposure to 10 mM APAP did not result in reversal of morphology (data not shown).
Figure 5.
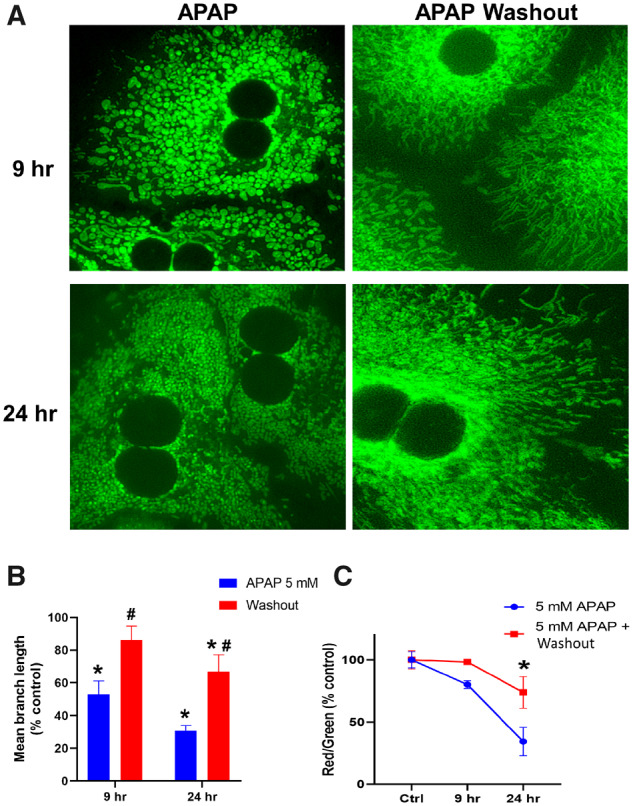
Early changes in mitochondrial morphology induced by treatment with 5 mM APAP are reversible. Representative images of mitochondrial morphology (A), quantitation of mitochondrial length (B), and mitochondrial membrane potential (C) in hepatocytes treated with 5 mM APAP, followed by APAP washout at 6 h. Error bars represent mean ± SEM for n = 3 mice. *p < .05 compared with control, #p < .05 compared with APAP without washout.
Delayed Alterations in Mitochondrial Morphology After APAP Are Mediated by Changes in Mitofusin-2, Probably Induced by Mitochondrial JNK Translocation
The data so far indicated that the early change in mitochondria toward a spheroid phenotype resulted from alterations in membrane potential, which in a delayed fashion progressed to a distinct, fragmented morphology. Altered fusion dynamics have been implicated in cardiomyocyte mitochondrial spheroid formation (Liu and Hajnoczky, 2011) and hence canonical mitochondrial fusion proteins were next investigated. No change in Mfn1 expression levels was evident at 4 h following 10 mM APAP (Figs. 6A and 6B), when mitochondrial spheroids were evident, though by 9 h, a substantial decrease in both Mfn1 and Mfn2 expression was seen (Figs. 6A and 6B). Although Drp1 levels remained unchanged, substantial change was evident in mitochondrial phosphatidic acid (mito-PA) levels, which can negatively regulate Drp1-mediated fission (Adachi et al., 2016; Kashatus, 2016). There was a significant decrease in mito-PA by 9 h following 10 mM APAP (Figure 6C), which corresponds with the appearance of punctate mitochondria (Figure 1C). Thus, the decrease in mitochondrial fusion proteins such as mitofusins coupled with decrease in a negative regulator such as mito-PA could result in the delayed punctate morphology seen after APAP. But what could be driving the decrease in Mfn2 after APAP? JNK translocation to mitochondria is an essential feature of APAP hepatotoxicity (Hanawa et al., 2008) and phosphorylation by JNK can target Mfn2 for proteasomal degradation (Leboucher et al., 2012). Examination of JNK activation after hepatocyte exposure to 10 mM APAP demonstrates JNK phosphorylation in the cytosol by 2 h and translocation to mitochondria by 3 h after APAP (Figure 7A), putting it in the necessary position to phosphorylate Mfn2 and target it for degradation. This was confirmed by experiments using 2 different JNK inhibitors, which demonstrates a maintenance of Mfn2 levels in cells treated with APAP with JNK inhibition (Figs. 7B and 7C) indicating that delayed mitochondrial fission induced by APAP could be due to JNK-mediated loss of the mitochondrial fusion protein Mfn2, which prevents mitochondrial fusion and promotes enhanced mitochondrial fission.
Figure 6.
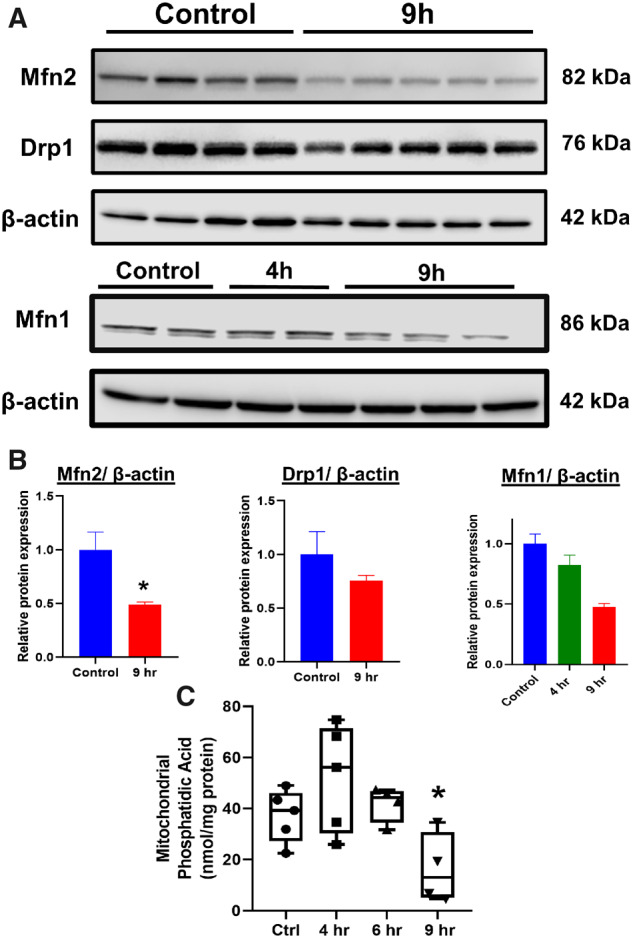
Alterations in canonical mitochondria dynamic proteins and mitochondrial phosphatidic acid levels in hepatocytes following treatment with 10 mM APAP. (A) Representative Western blots examining expression of mitofusins and Drp1 and (B) their densitometric quantitation in hepatocytes after APAP treatment. (C) Phosphatidic acid measured from mitochondria isolated from PMHs at various time points after APAP. Bars represent mean ± SEM. (n = 3–5) *p < .05.
Figure 7.
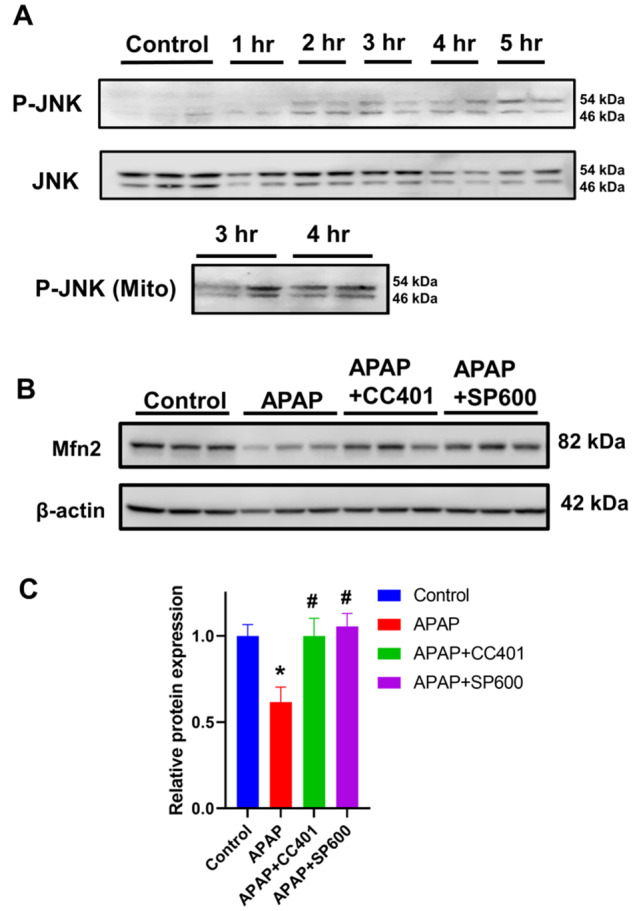
Influence of JNK on mitofusin protein levels after APAP overdose. Western blots evaluating the temporal course of cytosolic JNK activation and its mitochondrial translocation (A). Representative Western blots showing mitofusin 2 expression after APAP in presence or absence of JNK inhibitors CC401 and SP600 (B) and their densitometric quantitation (C).
DISCUSSION
Hepatocyte Mitochondria Undergo Distinct Morphological Alterations Early After an APAP Overdose
The purpose of this study was to integrate findings on mitochondrial function, polarization, and morphology with the time course of JNK activation and its mitochondrial translocation in APAP hepatotoxicity. The RBC-like indented spheroid mitochondrial morphology revealed by live cell imaging by 4 h after 10 mM APAP is evidently distinct from the fragmented mitochondria present at the later time points, 9 h and beyond. The appearance of these spheroid mitochondria is also concentration dependent, because exposure to the lower 5 mM concentration showed the morphology developing slower, which indicates that change in morphology was dictated by the extent of NAPQI formation. This concentration range from 1 to 10 mM APAP was designed to replicate hepatocyte exposure over the central-vein portal triad axis and is clinically relevant because concentrations of 5 or 10 mM APAP in culture have been shown to be cytotoxic to human HepaRG cells by similar mechanisms as in the mouse (McGill et al., 2011) and this was also replicated in primary human hepatocytes (Xie et al., 2014). Mitochondrial injury induced by NAPQI-protein adduct formation is central to APAP hepatotoxicity and recovery of mitochondrial function is essential for liver regeneration. Earlier investigation of the role of mitochondria in liver recovery after APAP focused on delayed time points, where it was shown that mitochondrial biogenesis (Du et al., 2017) was a critical feature of liver recovery, leading to regeneration of hepatocytes 24–72 h following APAP exposure (Ramachandran and Jaeschke, 2019). However, at low, nontoxic doses of APAP, mitochondria were shown to depolarize within 6 h of exposure in vivo but undergo subsequent repolarization by 24 h (Hu et al., 2016). More recent work tracking hepatocytes in vivo over the 2–6 h time course after a moderately toxic dose (250 mg/kg) also revealed transient loss in mitochondrial polarization, which is recovered in discrete islands of hepatocytes (Dunn et al., 2020). It also has been shown that alterations in mitochondrial membrane potential can lead to structural changes in the mitochondria, which serve an adaptive response to oxidative stress (Liu and Hajnoczky, 2011).Therefore, it is likely that the early indented spheroid mitochondrial morphology seen could be a transient change, induced as part of an adaptive response, which dictates the ability of the mitochondria, and perhaps the cell, to recover from APAP-induced alterations.
Early APAP-Induced Change in Hepatocyte Mitochondrial Morphology Occurs Without Compromise of Respiratory Function and Is Caused by Change in Mitochondrial Membrane Potential
Mitochondrial dynamics and function have been shown to be closely interlinked, whereby mitochondrial morphology is directly related to respiratory function (Picard et al., 2013). Interestingly, this does not seem to be the case with the early spheroid mitochondrial morphology induced within 4 h after APAP. Analysis of the time course of mitochondrial respiratory function after APAP revealed no change in basal respiration or proton leak when mitochondria assumed the discoid morphology by 4 h post APAP. This suggests that this early alteration was not caused by mitochondrial functional deficits. However, when mitochondria began to be constricted with a fragmented morphology, a significant decrease in maximal respiration rates was evident. Mitochondrial morphology has been shown to be independent of bioenergetic efficiency in neurons (Trevisan et al., 2018) and in fact, loss of mitochondrial membrane potential per se triggers structural changes in mitochondria from tubular to globular doughnut shaped mitochondria in mouse embryonic fibroblasts (Miyazono et al., 2018), identical to what we observed early after APAP exposure. Similar morphology has also been shown as an adaptive mechanism after membrane potential loss in cardiomyocytes after hypoxia reoxygenation stress (Liu and Hajnoczky, 2011). Our examination of the change in mitochondrial membrane potential after APAP reiterated these findings with a mild drop in membrane potential at the 4-h time point (indented spheroid mitochondria) and a severe loss by the 9-h time point (constricted and fragmented mitochondria). These findings again reveal the mechanistic distinction between APAP-induced change in mitochondrial morphology, with the early spheroid appearance evident with subtle drops in mitochondrial membrane potential, and the later constricted morphology only appearing with severe loss of mitochondrial membrane potential. The direct demonstration of mitochondrial constriction when hepatocytes were treated with the mitochondrial uncoupler FCCP confirms the connection between mitochondrial membrane potential and this early formation of indented spheroid mitochondria after APAP.
Early Mitochondrial Spheroid Formation Induced by APAP Is a Reversible Process Independent of Canonical Mitochondrial Dynamics Proteins
Mitochondrial spheroids, albeit with a ring shape enclosing cytoplasmic contents (Ding et al., 2012) have been described in the livers of mice treated with APAP at later time points when significant necrosis is ongoing. These morphological changes are probably in response to the mitochondrial stress and are dependent on the canonical mitochondrial fusion proteins mitofusin 1 and 2 (Ding et al., 2012). In contrast, the unaltered levels of mitofusin 2 and Drp1 as well as a lack of effect of the Drp1 inhibitor Mdivi on membrane potential-induced change in morphology indicates that the early formation of indented spheroids is independent of canonical mitochondrial dynamic proteins. This is again similar to the effect noted in mouse embryonic fibroblasts (Miyazono et al., 2018), where changes in membrane potential induced mitochondrial spheroid formation independently of the fission protein Drp1. Thus, the mitochondrial spheroid resulting from perturbations in mitochondrial membrane potential could be an adaptive response, because it would be rapidly reversible when membrane potential is restored. This would be in contrast to canonical mitochondrial fission, which is an energy-dependent process, tailored toward removal of dysfunctional mitochondria (Sprenger and Langer, 2019) and would not be immediately reversible for individual mitochondria. This is relevant because recent evidence in vivo suggests that mitochondria in islands of hepatocytes transiently depolarize after a moderate overdose of APAP, regaining membrane potential over time to facilitate hepatocyte survival (Dunn et al., 2020). Therefore, in the in vivo context where hepatocytes are exposed to a gradient of NAPQI formation resulting in a zonated pattern of injury (Ni et al., 2013), the rate of decline in membrane potential and the subsequent reversible change in mitochondrial morphology would be distinct in cells closer to the portal triad exposed to the lower dose of NAPQI compared with cells closer to the central vein exposed to a higher dose. Presumably, it is the hepatocytes closer to the central vein with significant mitochondrial membrane potential loss, which would then induce mitochondrial fission in preparation for responses such as mitophagy. Such an adaptive response independent of canonical mitochondrial dynamics proteins would be critical to stressed cells at the border of the necrotic area which dictate the extent of centrilobular necrosis or liver recovery after an APAP overdose. Our wash-out experiments with the lower 5 mM APAP dose clearly indicate that the early indented spheroid mitochondrial morphology is an adaptive response, which can revert to control morphology. These washout experiments would also simulate in vivo situations where transient exposure to higher APAP concentrations could occur, such as portal triad cells, where GSH depletion after APAP has been suggested to be lower than that seen in central vein cells (Sezgin et al., 2018). This reversible phenomenon is similar to cardiomyocyte mitochondria which reestablished mitochondrial membrane potential after hypoxia-reoxygenation (Liu and Hajnoczky, 2011). In the clinical scenario, these adaptive responses could facilitate recovery in cells after transient exposure, providing time for interventions such as NAC to replenish GSH stores and prevent propagation of injury.
APAP-Induced Formation of Early Indented Mitochondrial Spheroids Is Mechanistically Distinct From the Delayed Mitochondrial Fragmentation
The distinct differences in mitochondrial morphology coupled with functional changes over time indicate a biphasic alteration in response to APAP. Although the early changes to the indented spheroid morphology are an adaptive response, later changes seem to involve canonical players in mitochondrial dynamics. The substantial decline in mitofusins at the later 9 h time point as well as changes in phosphatidic acid (PA) reiterate this. Mitochondrial lipids can influence dynamics (Sprenger and Langer, 2019) and mitochondrial PA is known to prevent Drp1 aggregation on mitochondria (Adachi et al., 2016; Kashatus, 2016). Elevation of PA at the 4 h time point and its significant decrease by 9 h suggests that changes in this important mitochondrial lipid facilitate the distinct morphological changes after APAP treatment. Although our studies focused on early changes in mitochondrial PA, hepatic PA levels in general were shown to be increased by 6 h after APAP (Lutkewitte et al., 2018) and probably modulate GSK3b to influence delayed effects like liver regeneration (Clemens et al., 2019), an effect also seen after hepatic ischemia/reperfusion injury (Liss et al., 2021).
Thus, although the switch toward the spheroid mitochondria appears to be an adaptive process and represents a point at which the loss in mitochondrial function is reversible, the transition toward the punctate mitochondria probably represents a “point of no return.” These punctate mitochondria are facilitated by the decrease in the PA composition of the mitochondrial membrane, which increases the efficiency of Drp1-mediated fission (Adachi et al., 2016), as well as by the loss in the canonical fusion proteins Mfn1 and Mfn2. Correlating these mitochondrial morphology changes to temporal changes in APAP-induced JNK activation indicate that the punctate mitochondrial morphology is driven through JNK-mediated phosphorylation of Mfn2, which probably targets it for proteasomal degradation (Leboucher et al., 2012). This finding provides mechanistic insight into the switch from a “recoverable” loss in mitochondrial membrane potential (prior to Mfn2 degradation) to a persistent irrecoverable loss of mitochondrial membrane potential (after initiation of canonical mitochondrial fission). Previous work has suggested that temporary activation and translocation of JNK to the mitochondria may explain the reversibility in mitochondrial depolarization, through JNK's modulation of the MPTP (Hu et al., 2016). Our work suggests that mitochondrial JNK could target the critical fusion protein, Mfn2 for degradation, thus driving the mitochondria toward canonical fission, thereby triggering an alternate stream of molecular events independent of those that govern early mitochondrial spheroid formation. Although it has been found that the mitochondrial spheroids are not involved in the mitophagy process (Ding et al., 2012), the delayed formation of punctate mitochondria may represent a state in the mitochondria injury process where clearance of the dysfunctional organelle via mitophagy is necessary and serves as an attempt to save the cell at the expense of individual mitochondria.
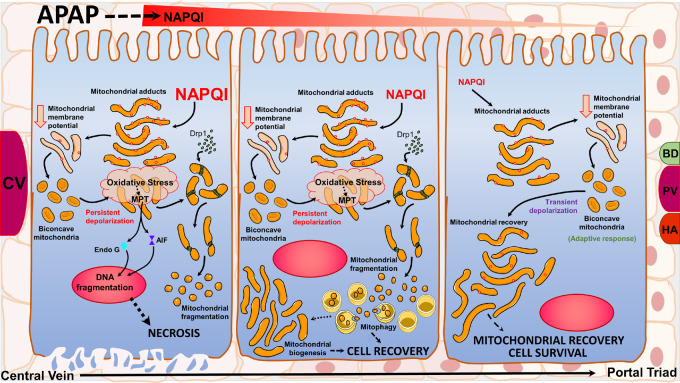
In conclusion, our work provides novel insight into early changes in mitochondrial morphology after APAP overdose and identifies two mechanistically distinct phases, which are very relevant to disease pathophysiology in vivo in light of the recent observations of transient mitochondrial membrane potential changes in hepatocytes around the central vein. Our findings support a biphasic model with an early phase where the cell attempts to preserve function of individual mitochondria, and a late phase where the cell attempts to preserve itself at the expense of individual mitochondria. During the early phase, hepatocyte mitochondria adopt a biconcave spheroid appearance in response to a slight decline in membrane potential, which serves as an adaptive response to preserve mitochondrial function. During this stage, interventions targeted at mitigating the amplification of mitochondrial injury may prevent any further progression of mitochondrial injury. Although the exact cellular mechanisms relevant in vivo remain to be elucidated, it may simply be a matter of reduced exposure to toxic NAPQI metabolite levels, as suggested by work using subtoxic doses of APAP (Hu et al., 2016). Persistent loss of mitochondrial membrane potential then induces a late phase, where mitochondria become fragmented and punctate through canonical mitochondrial fission mechanisms independent of mitochondrial spheroid formation, at which time perhaps mitophagy is employed to clear poorly functioning mitochondria in an attempt to preserve cellular function. These adaptive responses could be functioning in spatially distinct populations of centrilobular, midzonal, and periportal cells as summarized (Figure 8).
Figure 8.
Changes in mitochondrial morphology could be early adaptive responses after an APAP overdose: APAP induces centrilobular necrosis, where cells exposed to elevated concentrations of NAPQI form high levels of mitochondrial protein adducts leading to electron transport chain dysfunction and loss of membrane potential. This induces an adaptive response forming biconcave mitochondria, which under conditions of persistent membrane depolarization (in cells around the central vein) causes catastrophic mitochondrial functional failure with amplification of oxidant stress and induction of the mitochondrial permeability transition. The failure of this adaptive response, which presumably could have salvaged individual mitochondria then activates mitochondrial fission mediated by canonical proteins such as Drp1, which results in mitochondrial fragmentation. This could be an adaptive response in cells further away from the central vein exposed to lower levels of NAPQI, where mitochondrial fission allows mitophagy and mitochondrial biogenesis for cellular recovery at the cost of individual mitochondria. However, in cells closer to the portal vein exposed to much lower levels of NAPQI, where the decrease in mitochondrial membrane potential is transient, the adaptive biconcave mitochondrial morphology allows recovery of individual mitochondria and cell survival.
SUPPLEMENTARY DATA
Supplementary data are available at Toxicological Sciences online.
FUNDING
Pilot Grant (to A.R.) from the Mechanisms of Liver Injury and Diseases COBRE (NIH P30GM118247 to HJ).
DECLARATION OF CONFLICTING INTERESTS
The authors declared no potential conflicts of interest with respect to the research, authorship, and/or publication of this article.
Supplementary Material
REFERENCES
- Adachi Y., Itoh K., Yamada T., Cerveny K. L., Suzuki T. L., Macdonald P., Frohman M. A., Ramachandran R., Iijima M., Sesaki H. (2016). Coincident phosphatidic acid interaction restrains Drp1 in mitochondrial division. Mol. Cell 63, 1034–1043. [DOI] [PMC free article] [PubMed] [Google Scholar]
- Bajt M. L., Farhood A., Lemasters J. J., Jaeschke H. (2008). Mitochondrial bax translocation accelerates DNA fragmentation and cell necrosis in a murine model of acetaminophen hepatotoxicity. J. Pharmacol. Exp. Ther. 324, 8–14. [DOI] [PubMed] [Google Scholar]
- Bajt M. L., Knight T. R., Lemasters J. J., Jaeschke H. (2004). Acetaminophen-induced oxidant stress and cell injury in cultured mouse hepatocytes: Protection by N-acetyl cysteine. Toxicol. Sci. 80, 343–349. [DOI] [PubMed] [Google Scholar]
- Clemens M. M., Kennon-McGill S., Apte U., James L. P., Finck B. N., McGill M. R. (2019). The inhibitor of glycerol 3-phosphate acyltransferase FSG67 blunts liver regeneration after acetaminophen overdose by altering GSK3β and Wnt/β-catenin signaling. Food Chem. Toxicol. 125, 279–288. [DOI] [PMC free article] [PubMed] [Google Scholar]
- Ding W. X., Guo F., Ni H. M., Bockus A., Manley S., Stolz D. B., Eskelinen E. L., Jaeschke H., Yin X. M. (2012). Parkin and mitofusins reciprocally regulate mitophagy and mitochondrial spheroid formation. J. Biol. Chem. 287, 42379–42388. [DOI] [PMC free article] [PubMed] [Google Scholar]
- Du K., Ramachandran A., McGill M. R., Mansouri A., Asselah T., Farhood A., Woolbright B. L., Ding W. X., Jaeschke H. (2017). Induction of mitochondrial biogenesis protects against acetaminophen hepatotoxicity. Food Chem. Toxicol. 108, 339–350. [DOI] [PMC free article] [PubMed] [Google Scholar]
- Dunn K. W., Martinez M. M., Wang Z., Mang H. E., Clendenon S. G., Sluka J. P., Glazier J. A., Klaunig J. E. (2020). Mitochondrial depolarization and repolarization in the early stages of acetaminophen hepatotoxicity in mice. Toxicology 439, 152464. [DOI] [PMC free article] [PubMed] [Google Scholar]
- Hanawa N., Shinohara M., Saberi B., Gaarde W. A., Han D., Kaplowitz N. (2008). Role of JNK translocation to mitochondria leading to inhibition of mitochondria bioenergetics in acetaminophen-induced liver injury. J. Biol. Chem. 283, 13565–13577. [DOI] [PMC free article] [PubMed] [Google Scholar]
- Hodgman M. J., Garrard A. R. (2012). A review of acetaminophen poisoning. Crit. Care Clin. 28, 499–516. [DOI] [PubMed] [Google Scholar]
- Hu J., Ramshesh V. K., McGill M. R., Jaeschke H., Lemasters J. J. (2016). Low dose acetaminophen induces reversible mitochondrial dysfunction associated with transient c-Jun N-terminal kinase activation in mouse liver. Toxicol. Sci. 150, 204–215. [DOI] [PMC free article] [PubMed] [Google Scholar]
- Jaeschke H., McGill M. R., Ramachandran A. (2012). Oxidant stress, mitochondria, and cell death mechanisms in drug-induced liver injury: Lessons learned from acetaminophen hepatotoxicity. Drug Metab. Rev. 44, 88–106. [DOI] [PMC free article] [PubMed] [Google Scholar]
- Jollow D. J., Mitchell J. R., Potter W. Z., Davis D. C., Gillette J. R., Brodie B. B. (1973). Acetaminophen-induced hepatic necrosis. II. Role of covalent binding in vivo. J. Pharmacol. Exp. Ther. 187, 195–202. [PubMed] [Google Scholar]
- Kashatus D. F. (2016). Restraining the divider: A Drp1-phospholipid interaction inhibits Drp1 activity and shifts the balance from mitochondrial fission to fusion. Mol. Cell 63, 913–915. [DOI] [PubMed] [Google Scholar]
- Leboucher G. P., Tsai Y. C., Yang M., Shaw K. C., Zhou M., Veenstra T. D., Glickman M. H., Weissman A. M. (2012). Stress-induced phosphorylation and proteasomal degradation of mitofusin 2 facilitates mitochondrial fragmentation and apoptosis. Mol. Cell 47, 547–557. [DOI] [PMC free article] [PubMed] [Google Scholar]
- Liss K. H. H., Ek S. E., Lutkewitte A. J., Pietka T. A., He M., Skaria P., Tycksen E., Ferguson D., Blanc V., Graham M. J., et al. (2021). Monoacylglycerol acyltransferase 1 knockdown exacerbates hepatic ischemia/reperfusion injury in mice with hepatic steatosis. Liver Transpl. 27, 116–133. [DOI] [PMC free article] [PubMed] [Google Scholar]
- Liu X., Hajnoczky G. (2011). Altered fusion dynamics underlie unique morphological changes in mitochondria during hypoxia-reoxygenation stress. Cell Death Differ. 18, 1561–1572. [DOI] [PMC free article] [PubMed] [Google Scholar]
- Lutkewitte A. J., Schweitzer G. G., Kennon-McGill S., Clemens M. M., James L. P., Jaeschke H., Finck B. N., McGill M. R. (2018). Lipin deactivation after acetaminophen overdose causes phosphatidic acid accumulation in liver and plasma in mice and humans and enhances liver regeneration. Food Chem. Toxicol. 115, 273–283. [DOI] [PMC free article] [PubMed] [Google Scholar]
- McGill M. R., Jaeschke H. (2013). Metabolism and disposition of acetaminophen: Recent advances in relation to hepatotoxicity and diagnosis. Pharm. Res. 30, 2174–2187. [DOI] [PMC free article] [PubMed] [Google Scholar]
- McGill M. R., Sharpe M. R., Williams C. D., Taha M., Curry S. C., Jaeschke H. (2012). The mechanism underlying acetaminophen-induced hepatotoxicity in humans and mice involves mitochondrial damage and nuclear DNA fragmentation. J. Clin. Invest. 122, 1574–1583. [DOI] [PMC free article] [PubMed] [Google Scholar]
- McGill M. R., Yan H. M., Ramachandran A., Murray G. J., Rollins D. E., Jaeschke H. (2011). HepaRG cells: A human model to study mechanisms of acetaminophen hepatotoxicity. Hepatology 53, 974–982. [DOI] [PMC free article] [PubMed] [Google Scholar]
- Miyazono Y., Hirashima S., Ishihara N., Kusukawa J., Nakamura K. I., Ohta K. (2018). Uncoupled mitochondria quickly shorten along their long axis to form indented spheroids, instead of rings, in a fission-independent manner. Sci. Rep. 8, 350. [DOI] [PMC free article] [PubMed] [Google Scholar]
- Nguyen N. T., , Du K., , Akakpo J. Y., , Umbaugh D. S., , Jaeschke H., and , Ramachandran A. (2020). Mitochondrial protein adduct and superoxide generation are prerequisites for early activation of c-jun N-terminal kinase within the cytosol after an acetaminophen overdose in mice. Toxicol. Lett. 338, 21–31. [DOI] [PMC free article] [PubMed] [Google Scholar]
- Ni H. M., Bockus A., Boggess N., Jaeschke H., Ding W. X. (2012). Activation of autophagy protects against acetaminophen-induced hepatotoxicity. Hepatology 55, 222–232. [DOI] [PMC free article] [PubMed] [Google Scholar]
- Ni H. M., Williams J. A., Jaeschke H., Ding W. X. (2013). Zonated induction of autophagy and mitochondrial spheroids limits acetaminophen-induced necrosis in the liver. Redox Biol. 1, 427–432. [DOI] [PMC free article] [PubMed] [Google Scholar]
- Nicholls D. G., Darley-Usmar V. M., Wu M., Jensen P. B., Rogers G. W., Ferrick D. A. (2010). Bioenergetic profile experiment using C2C12 myoblast cells. J. Vis. Exp. 46, 2511. [DOI] [PMC free article] [PubMed] [Google Scholar]
- Picard M., Shirihai O. S., Gentil B. J., Burelle Y. (2013). Mitochondrial morphology transitions and functions: Implications for retrograde signaling? Am. J. Physiol. Regul. Integr. Comp. Physiol. 304, R393–406. [DOI] [PMC free article] [PubMed] [Google Scholar]
- Ramachandran A., Jaeschke H. (2019). Acetaminophen hepatotoxicity. Semin. Liver Dis. 39, 221–234. [DOI] [PMC free article] [PubMed] [Google Scholar]
- Ramachandran A., McGill M. R., Xie Y., Ni H. M., Ding W. X., Jaeschke H. (2013). Receptor interacting protein kinase 3 is a critical early mediator of acetaminophen-induced hepatocyte necrosis in mice. Hepatology 58, 2099–2108. [DOI] [PMC free article] [PubMed] [Google Scholar]
- Sezgin S., Hassan R., Zühlke S., Kuepfer L., Hengstler J. G., Spiteller M., Ghallab A. (2018). Spatio-temporal visualization of the distribution of acetaminophen as well as its metabolites and adducts in mouse livers by MALDI MSI. Arch. Toxicol. 92, 2963–2977. [DOI] [PubMed] [Google Scholar]
- Sprenger H. G., Langer T. (2019). The good and the bad of mitochondrial breakups. Trends Cell Biol. 29, 888–900. [DOI] [PubMed] [Google Scholar]
- Trevisan T., Pendin D., Montagna A., Bova S., Ghelli A. M., Daga A. (2018). Manipulation of mitochondria dynamics reveals separate roles for form and function in mitochondria distribution. Cell Rep. 23, 1742–1753. [DOI] [PubMed] [Google Scholar]
- Xie Y., McGill M. R., Dorko K., Kumer S. C., Schmitt T. M., Forster J., Jaeschke H. (2014). Mechanisms of acetaminophen-induced cell death in primary human hepatocytes. Toxicol. Appl. Pharmacol. 279, 266–274. [DOI] [PMC free article] [PubMed] [Google Scholar]
- Yoon E., Babar A., Choudhary M., Kutner M., Pyrsopoulos N. (2016). Acetaminophen-induced hepatotoxicity: A comprehensive update. J. Clin. Transl. Hepatol. 4, 131–142. [DOI] [PMC free article] [PubMed] [Google Scholar]
Associated Data
This section collects any data citations, data availability statements, or supplementary materials included in this article.


