

Summary
Renewing tissues have the remarkable ability to continually produce both proliferative progenitor and specialized differentiated cell types. How are complex milieus of microenvironmental signals interpreted to coordinate tissue cell type composition? Here, we investigate the responses of intestinal epithelium to individual and paired perturbations across eight epithelial signaling pathways. Using a high-throughput approach that combines enteroid monolayers and quantitative imaging, we identified conditions that enrich for specific cell types as well as interactions between pathways. Importantly, we found that modulating proliferation of transit-amplifying cells changes the ratio of differentiated secretory to absorptive cell types. These observations highlight an underappreciated role for transit-amplifying cells in tuning differentiated cell type composition.
eTOC Blurb
Sanman, Chen, Bieber et al. investigate the effects of combinatorial signaling perturbations on cell fate decision-making in the small intestinal epithelium. The authors discover perturbations that induce Lgr5+ stem or enteroendocrine cells and that modulating proliferation of transit-amplifying cells regulates the balance of secretory and absorptive cell-types.
Introduction
A central question in the study of complex tissues is how diverse signals are integrated to regulate cell type composition. Dissection of mechanisms underlying the mapping from signals to tissue composition is complicated by the heterogeneous makeup of interconnected cell types, which exert influences upon one another through lineage structure and cell-cell interactions. Further, most studies focus on the effects of individual signals on individual cell types, due to a lack of methods that enable systematic identification of signal integration mechanisms. What are the tissue-wide effects of common microenvironmental signals on cell type composition? How do multiple signals modify each other’s effects? Finally, are there intrinsic tissue properties that shape response to diverse signals?
Here, we address these questions in the context of the intestinal epithelium, an ideal model for continuously renewing tissue (Beumer and Clevers, 2016; Cheng and Leblond, 1974a; Tian et al., 2016). The intestinal epithelium is particularly remarkable in that it maintains a stereotypic tissue composition despite a rapid 3- to 5-day turnover. During renewal of the intestinal epithelium, Lgr5+ crypt-base stem cells differentiate into proliferating transit-amplifying (TA) progenitors, which in turn adopt absorptive (enterocyte) or secretory (Paneth, goblet, enteroendocrine (EE)) cell fates (Cheng and Leblond, 1974a). The confluence of proliferation and differentiation decision processes establishes tissue composition, which guides overall tissue function. Much progress has been made in identifying individual factors that guide intestinal epithelial renewal (Beumer and Clevers, 2020; Clevers, 2013; van der Flier and Clevers, 2009; Yin et al., 2014; Zhan et al., 2019). However, it is unclear how these factors—and combinations of them—are integrated by the tissue during maintenance and in response to perturbations.
To quantitatively measure intestinal epithelial cell type composition and study its changes in response to microenvironmental signals, we utilized an enteroid monolayer culture system that recapitulates key features of the intestinal epithelium (Sanman et al., 2020; Thorne et al., 2018). Enteroid monolayer cultures maintain characteristics of intestinal epithelial architecture, including spatial organization into crypt-like proliferative and differentiated compartments and apical-basolateral polarization. Differentiated cell types (e.g. enterocyte, goblet, EE, and Tuft cells) surround proliferative compartments, within which stem and Paneth cells are juxtaposed and surrounded by TA cells (Thorne et al., 2018). Importantly, these cultures also preserve core tissue processes ex vivo, generating all major intestinal epithelial cell types (Lgr5+ stem, TA, and differentiated secretory and absorptive cells) with a turn-over rate similar to the in vivo renewal rate. Due to their two-dimensional nature, enteroid monolayer cultures are amenable to high-throughput image-based assays in microwell format, which enables large numbers of tissue perturbations to be performed and analyzed. In this work, enteroid monolayers are used as a primary platform for hypothesis generation with key observations further evaluated in three-dimensional (3D) organoids and in vivo.
Here, we present a systems approach for investigating signal integration and lineage processes in the intestinal epithelium. We expand the capabilities of the enteroid monolayer platform to monitor and quantify major proliferating progenitor and differentiated intestinal epithelial cell types. We profiled changes in stem, TA, and secretory cell types in response to a diverse set of combinatorial treatment conditions. We identified conditions that enrich for stem and EE cells and elucidate an unexpected interaction between EGFR and IL-4 signaling. Finally, we propose a model of intestinal epithelial lineage control in which modulation of TA proliferation can alter the balance of secretory to absorptive cell lineages, which is supported through experiments in enteroid monolayers, 3D organoids, and in vivo, as well as mathematical modeling.
Results
A quantitative microscopy platform to study regulation of intestinal cell type composition
Here, we build on a previously described enteroid monolayer system for monitoring intestinal epithelium (Sanman et al., 2020; Thorne et al., 2018). We first expanded the computational pipeline to automatically quantify major intestinal cell types from images of enteroid monolayers. Specifically, we developed algorithms to detect cells expressing markers for stem (Lgr5+), proliferating (EdU+), Paneth (Lyz+), goblet (Muc2+), and enteroendocrine (EE; ChgA+) cells as well as identify cell nuclei (Hoechst) (Figure S1A–F, STAR Methods). When evaluated against expert manual counting, the algorithms exhibited high quantification accuracy across the cell types measured (Table S1).
We then assessed recapitulation of relevant in vivo intestinal epithelial properties. First, we selected a crypt seeding density (10–20% initial confluency) where there was relatively low inter-replicate variability and no relationship between initial seeding density and cell type composition after 48 hours of culture (Figure S1G). Next, we confirmed that jejunal enteroid monolayers exhibited cell type composition comparable to the composition of in vivo jejunal epithelium (Table S2). Finally, we observed that enteroid monolayers recapitulate progenitor proliferation and production of differentiated cell types. By labeling cycling cells with EdU upon initial plating, we observed that the initial population of ~25% proliferative (EdU+) cells produce the vast majority (79.2±2.2%) of enteroid monolayer cells by 48 hours of culture (Figure 1A, Tables S2–S3). Further, we observed EdU+ cells that colocalized with markers of Paneth (Lyz), goblet (Muc2), and EE (ChgA) cells (Figure 1B). Taken together, enteroid monolayers preserve important characteristics of the intestinal epithelium and provide a robust platform for capturing tissue-wide responses to perturbations and for generating hypotheses on control of intestinal epithelial cell type composition.
Figure 1. Enteroid monolayers provide a model for renewing intestinal epithelium.
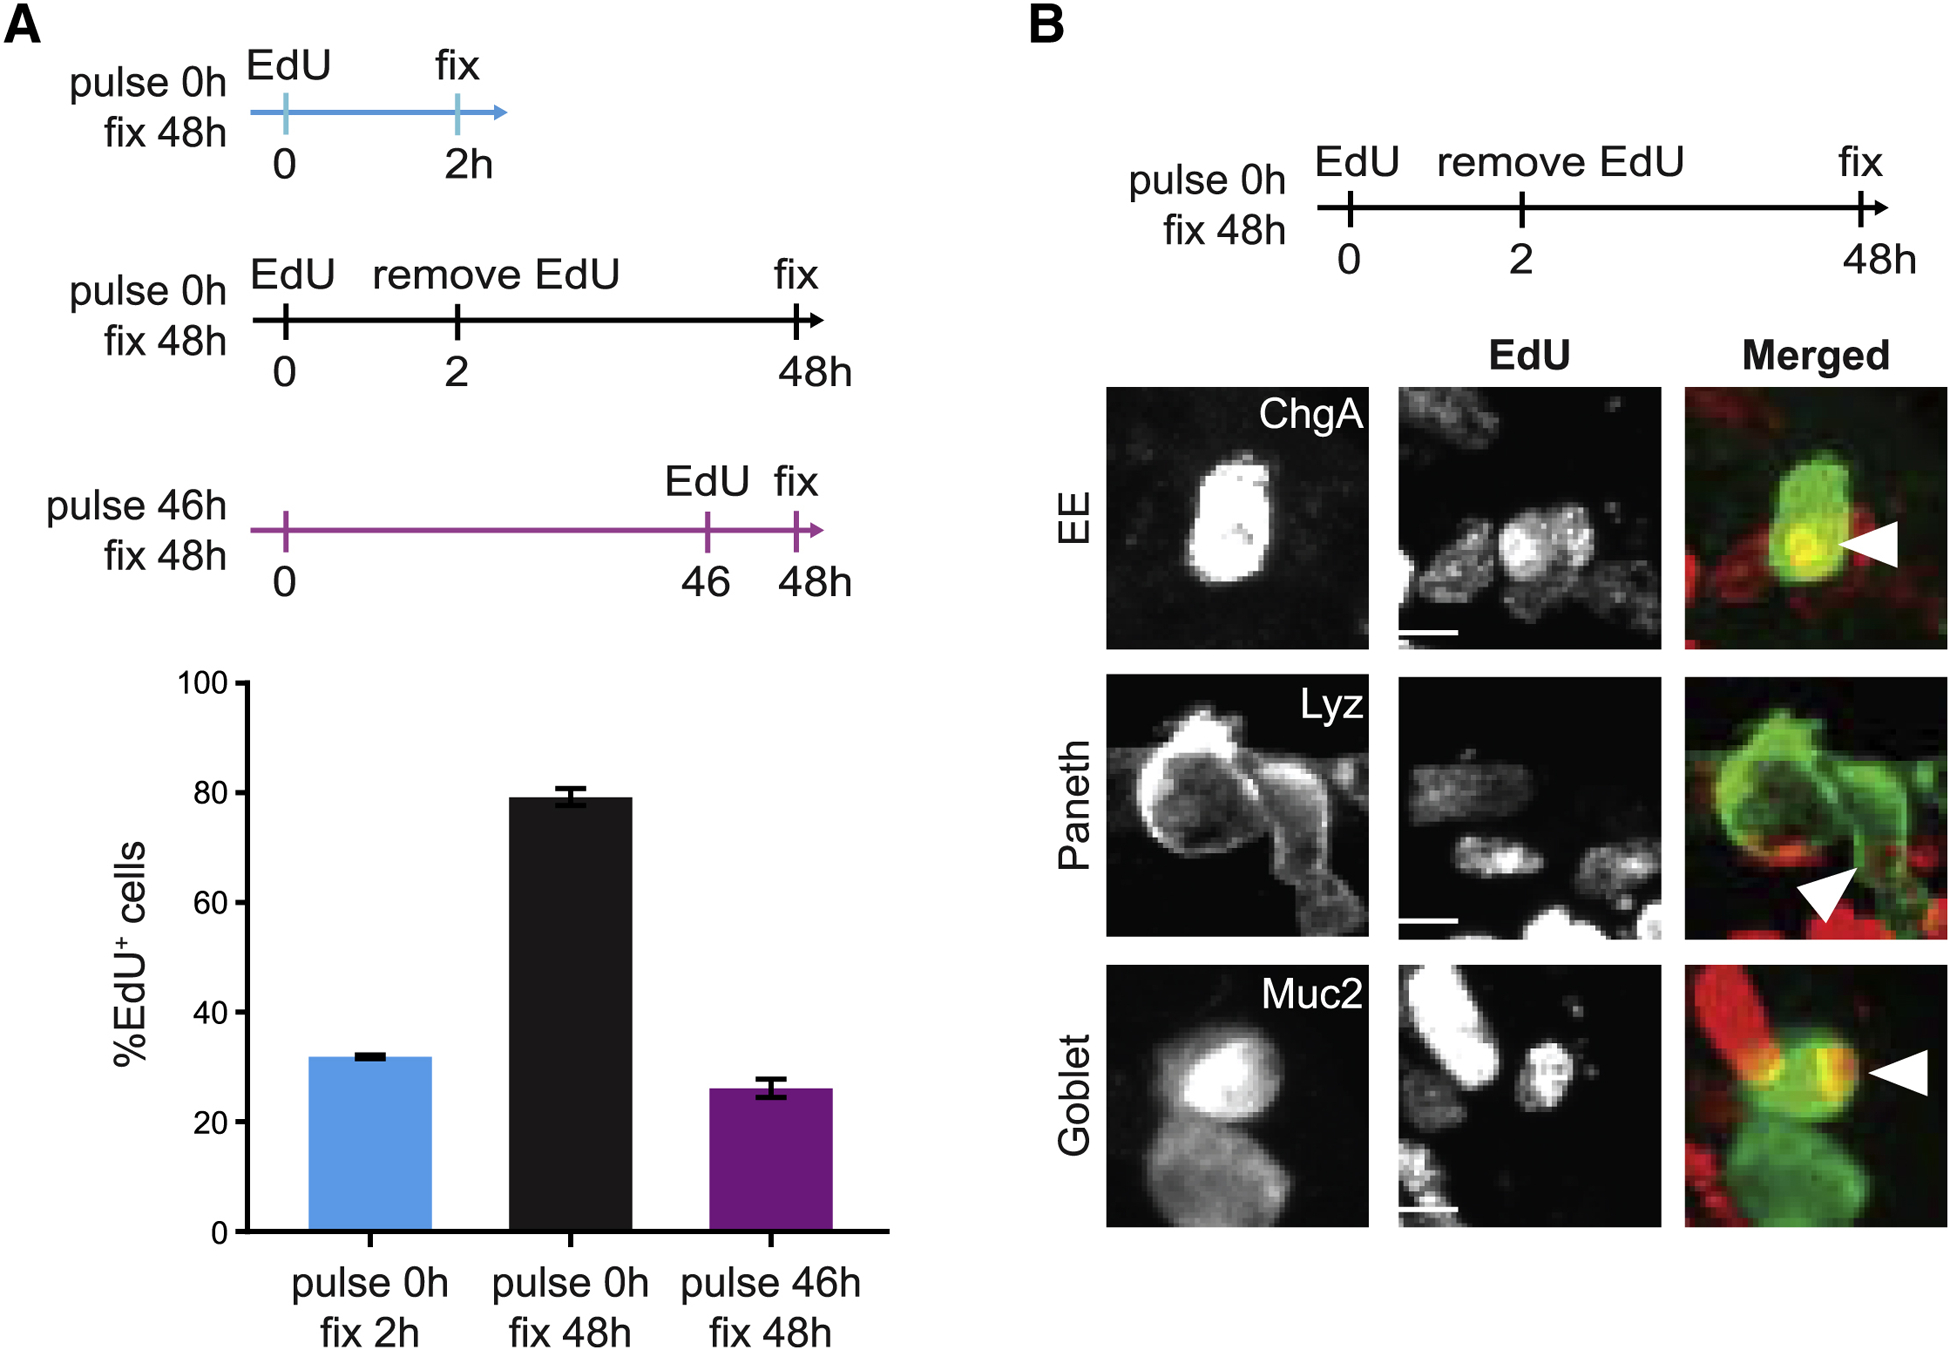
(A) Top: Schema for EdU pulse chase. Bottom: Quantification of %EdU+ cells in tissue at different time points. n=3 wells. Error bars mean +/− SEM.
(B) Top: Schema for EdU pulse chase. Bottom: Representative images show co-localization between EdU and secretory cell type markers (Lyz; Paneth, Muc2; goblet, and ChgA; EE). Arrowheads indicate cells that co-stain for EdU and the indicated cell type marker. Scale bars 5μm.
Systematic survey of cell type composition changes in response to single and pairwise signaling modulators
To map a wide range of tissue composition phenotypes, 13 epithelial-intrinsic and microenvironmental modulators that target eight core intestinal epithelial signaling pathways (Wnt, BMP, Notch, HDAC, JAK, p38 MAPK, TGF-β, EGFR (Basak et al., 2017a; van der Flier and Clevers, 2009; Houde et al., 2001; Richmond et al., 2018; Rodríguez-Colman et al., 2017; Yin et al., 2014; Lukonin et al., 2020)) and are known to have diverse effects on tissue cell type composition were selected (Table S4). In previous reports, combinations of perturbations have been shown to be more effective than single perturbations in enriching for particular cell types (Basak et al., 2017; van der Flier and Clevers, 2009; Houde et al., 2001; Richmond et al., 2018; Rodríguez-Colman et al., 2017; Yin et al., 2014). Thus, to survey a broad range of tissue states, modulators were applied to enteroid monolayers individually (13 conditions) and in all possible pairwise combinations (78 conditions). Perturbation concentrations were selected based on literature reports and dose-response experiments in enteroid monolayers (Table S4, Figure S2A) (Basak et al., 2017; von Moltke et al., 2015; Yin et al., 2014). A 48 hour final time point was selected for our studies, as we observed strong and expected responses to well-characterized perturbations (Figure S2B).
For our survey, we focused on changes to the proliferative progenitor and differentiated secretory subpopulations. We chose to report absolute numbers of the proliferative subpopulations (#stem, #TA) and fractions of secretory cell types within the measured secretory lineage (#Paneth/#secretory, #goblet/#secretory, #EE/#secretory) (Figure 2A, Figure S2C). The numbers of proliferating stem cells were estimated by counting EdU+ Lgr5+ cells, and the numbers of TA cells—defined as non-stem proliferating cells—were estimated by counting EdU+ Lgr5− cells (Figure 2A, Figure S2C). The number of secretory cells was estimated by the sum of Paneth (Lyz), goblet (Muc2), and EE (ChgA) cells, which is a reasonable approximation as they make up the majority of secretory cells (Figure 2A, Figure S2C) (Cheng and Leblond, 1974a; Haber et al., 2017). While there are many possible features to report, focusing on absolute numbers of proliferating progenitor cells and relative fractions within the secretory lineage allowed us to disentangle changes within different tissue compartments from overall changes in tissue mass.
Figure 2. Systematic characterization of perturbation effects on intestinal epithelial cell type composition reveals cell type-specific regulators.
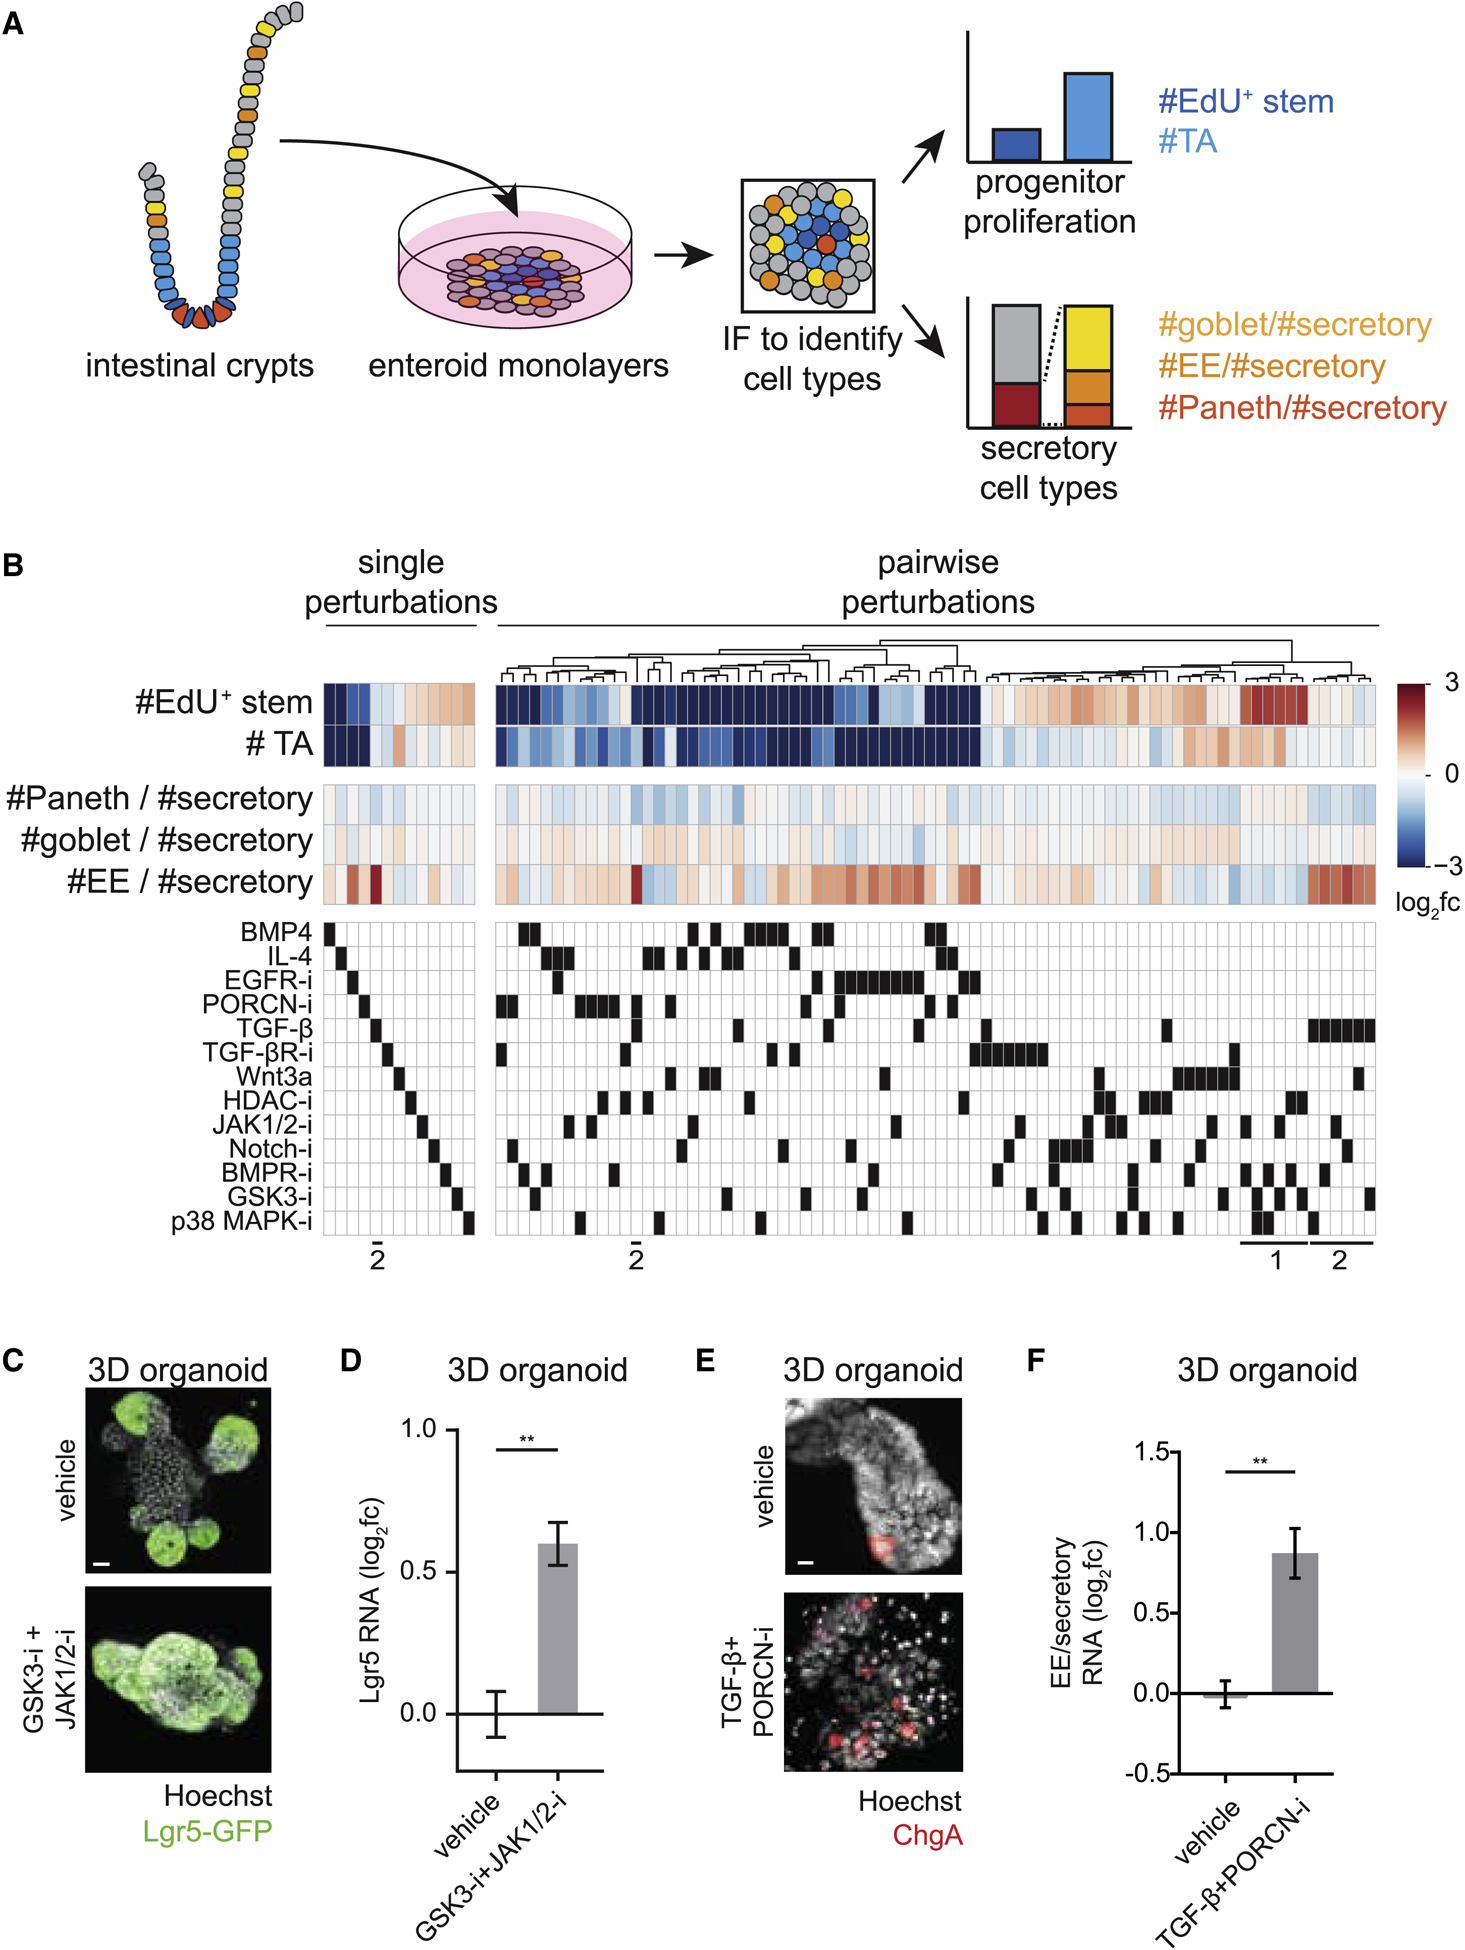
(A) Schema for characterization of perturbation effects on cell type composition within enteroid monolayers.
(B) Heatmaps of single (left) and pairwise (right) perturbation effects to enteroid monolayers. Top: Perturbation effects are represented as log2 fold-change (fc) relative to vehicle-treated wells. Bottom: Matrix of used perturbations. Single perturbations are sorted by #EdU+ stem cells; pairwise perturbations are clustered based on similarity of tissue-wide effects. Callouts (1) and (2) at bottom are referred to in text. n=28 (controls), 6–8 (single perturbations), or 2 (pairwise perturbations) wells.
(C-D) Co-treatment of 3D organoids with GSK3-i + JAK1/2-i enriches for Lgr5+ stem cells.
(C) Representative IF images of Lgr5-GFP-DTR 3D organoids show an increased proportion of cells expressing Lgr5 in GSK3-i + JAK1/2-i co-treatment (48 hours). Scale bar 15μm.
(D) Lgr5 RNA levels measured by qRT-PCR are increased in 3D organoids co-treated with GSK3-i + JAK1/2-i for 48 hours. n=3 wells. Error bars mean +/− SEM.
(E-F) Co-treatment of 3D organoids with TGF-β + PORCN-i enriches for enteroendocrine (EE) cells.
(E) Representative IF images of 3D organoids show increased EE (ChgA+) cell numbers with TGF-β + PORCN-i co-treatment (24 hours). Scale bar 5μm.
(F) qRT-PCR analysis of EE (ChgA) RNA relative to secretory (ChgA+Muc2+Lyz) RNA levels in 3D organoids treated with TGF-β + PORCN-i for 48 hours. n=3 wells. Error bars mean+/− SEM.
** indicates p-values < 0.01
In total, the survey of single and pairwise perturbations allowed us to measure the effects of diverse perturbations on intestinal epithelial cell type composition (546 measurements = 91 conditions × 6 cell type readouts), with a focus on progenitor and secretory cell regulation (Figure 2B, single summary heatmap; Figure S2D, alternative visualization and total cell numbers). These measurements allowed us to generate hypotheses about how microenvironmental signals interact with each other and regulate tissue cell type composition.
Identification of signaling perturbations that enrich for specific cell types
Our survey recapitulated known effects on intestinal epithelial cell type composition (GSK3-I + HDAC-i, Notch-i, IL-4, EGFR-i, PORCN-i). In these cases, changes in enteroid monolayer cell type readouts were in agreement with previous studies (Basak et al., 2017; Beumer and Clevers, 2016; van Es et al., 2005; von Moltke et al., 2015; Qi et al., 2017; Yin et al., 2014) (Figure S2E, Table S4) and further confirmed at the RNA level using quantitative reverse transcription PCR (qRT-PCR; Figure S2F). However, the vast majority of measurements obtained from our survey were previously uncharacterized, with a number of conditions strongly modulating different aspects of tissue composition (Table S5). We next highlight conditions that were previously unknown to enrich for stem or EE cells.
The number of Lgr5+ stem cells was increased by pairwise combinations of inhibitors of GSK3, p38MAPK, BMPR, HDAC, and JAK1/2 (Figure 2B, bottom callout 1, Figure S2G). Notably, these conditions caused similar, if not increased, enrichment for Lgr5+ stem cells compared to the current benchmark condition (GSK3-i + HDAC-i (Yin et al., 2014)). Lgr5+ stem cell enrichment from these conditions was also observed at the RNA level, as indicated by qRT-PCR analysis of Lgr5 RNA in enteroid monolayers (Figure S2H). We chose the pairwise combination of GSK3-i + JAK1/2-i to re-test in 3D organoids, as JAK1/2 had not been connected with stemness in the mammalian intestinal epithelium in the absence of inflammation (Richmond et al., 2018), and again observed enrichment of Lgr5+ stem cells (immunofluorescence and qRT-PCR; Figures 2C–D).
The number of EE cells—relative to other secretory cell types—was also observed to be increased in a number of conditions (Table S5). Notably, perturbations containing TGF-β generally enriched for EE cells (Figure 2B, bottom callout 2). The strongest inducer of EE cell fraction relative to secretory cells, TGF-β + PORCN-i co-treatment, was confirmed in 3D organoids (immunofluorescence and qRT-PCR; Figures 2E–F; note that TGF-β treatment causes 3D organoids to decrease in size and lose their 3D architecture (Hahn et al., 2017)). To investigate possible signaling mechanisms for TGF-β enrichment of EE cells, we examined both canonical (SMAD2/3) and non-canonical (PI3K, mTOR, JNK) TGF-β downstream signaling components (Feng and Derynck, 2005; Massagué, 1998; Zhang, 2009). Deletion of SMAD3, but not inhibition of non-canonical TGF-β signaling effectors, abrogated EE cell upregulation induced by TGF-β (Figures S2I–J). This enrichment was accompanied by an increase in SMAD2/3 target gene expression, as demonstrated by RNA-sequencing of 3D organoids (Figure S2K). Thus, the EE enrichment by TGF-β that we identified in our survey occurs through canonical SMAD2/3 signaling.
Identification of a mutually antagonistic signaling interaction
We next searched for perturbation interactions that regulate cell type composition (Methods, Figure S3A, B). We recapitulated known interactions, such as between perturbations that modulate the same signaling pathway (e.g. the synergistic effect of Wnt3a + GSK3-i, Figure S3C). We also identified unexpected interactions, particularly a mutual antagonism between IL-4 and EGFR-i in co-regulating TA cell numbers. Individually, IL-4 or EGFR-i reduced the number of TA cells by ~4 or ~6 log-fold relative to control, respectively, while co-treatment reduced the number of TA cells by only ~1.5 log-fold relative to control (Figure 3A). This effect was surprising, as IL-4 and EGFR-i are not known to interact. A similar result was also observed with the EGFR inhibitor gefitinib and the IL-4-related cytokine IL-13 on proliferating cells (Figure S3D–E), indicating the mutual antagonism is not due to off-target or perturbation-specific effects.
Figure 3. Interaction mapping reveals mutual antagonism between EGFR-i and IL-4 on TA cell numbers.
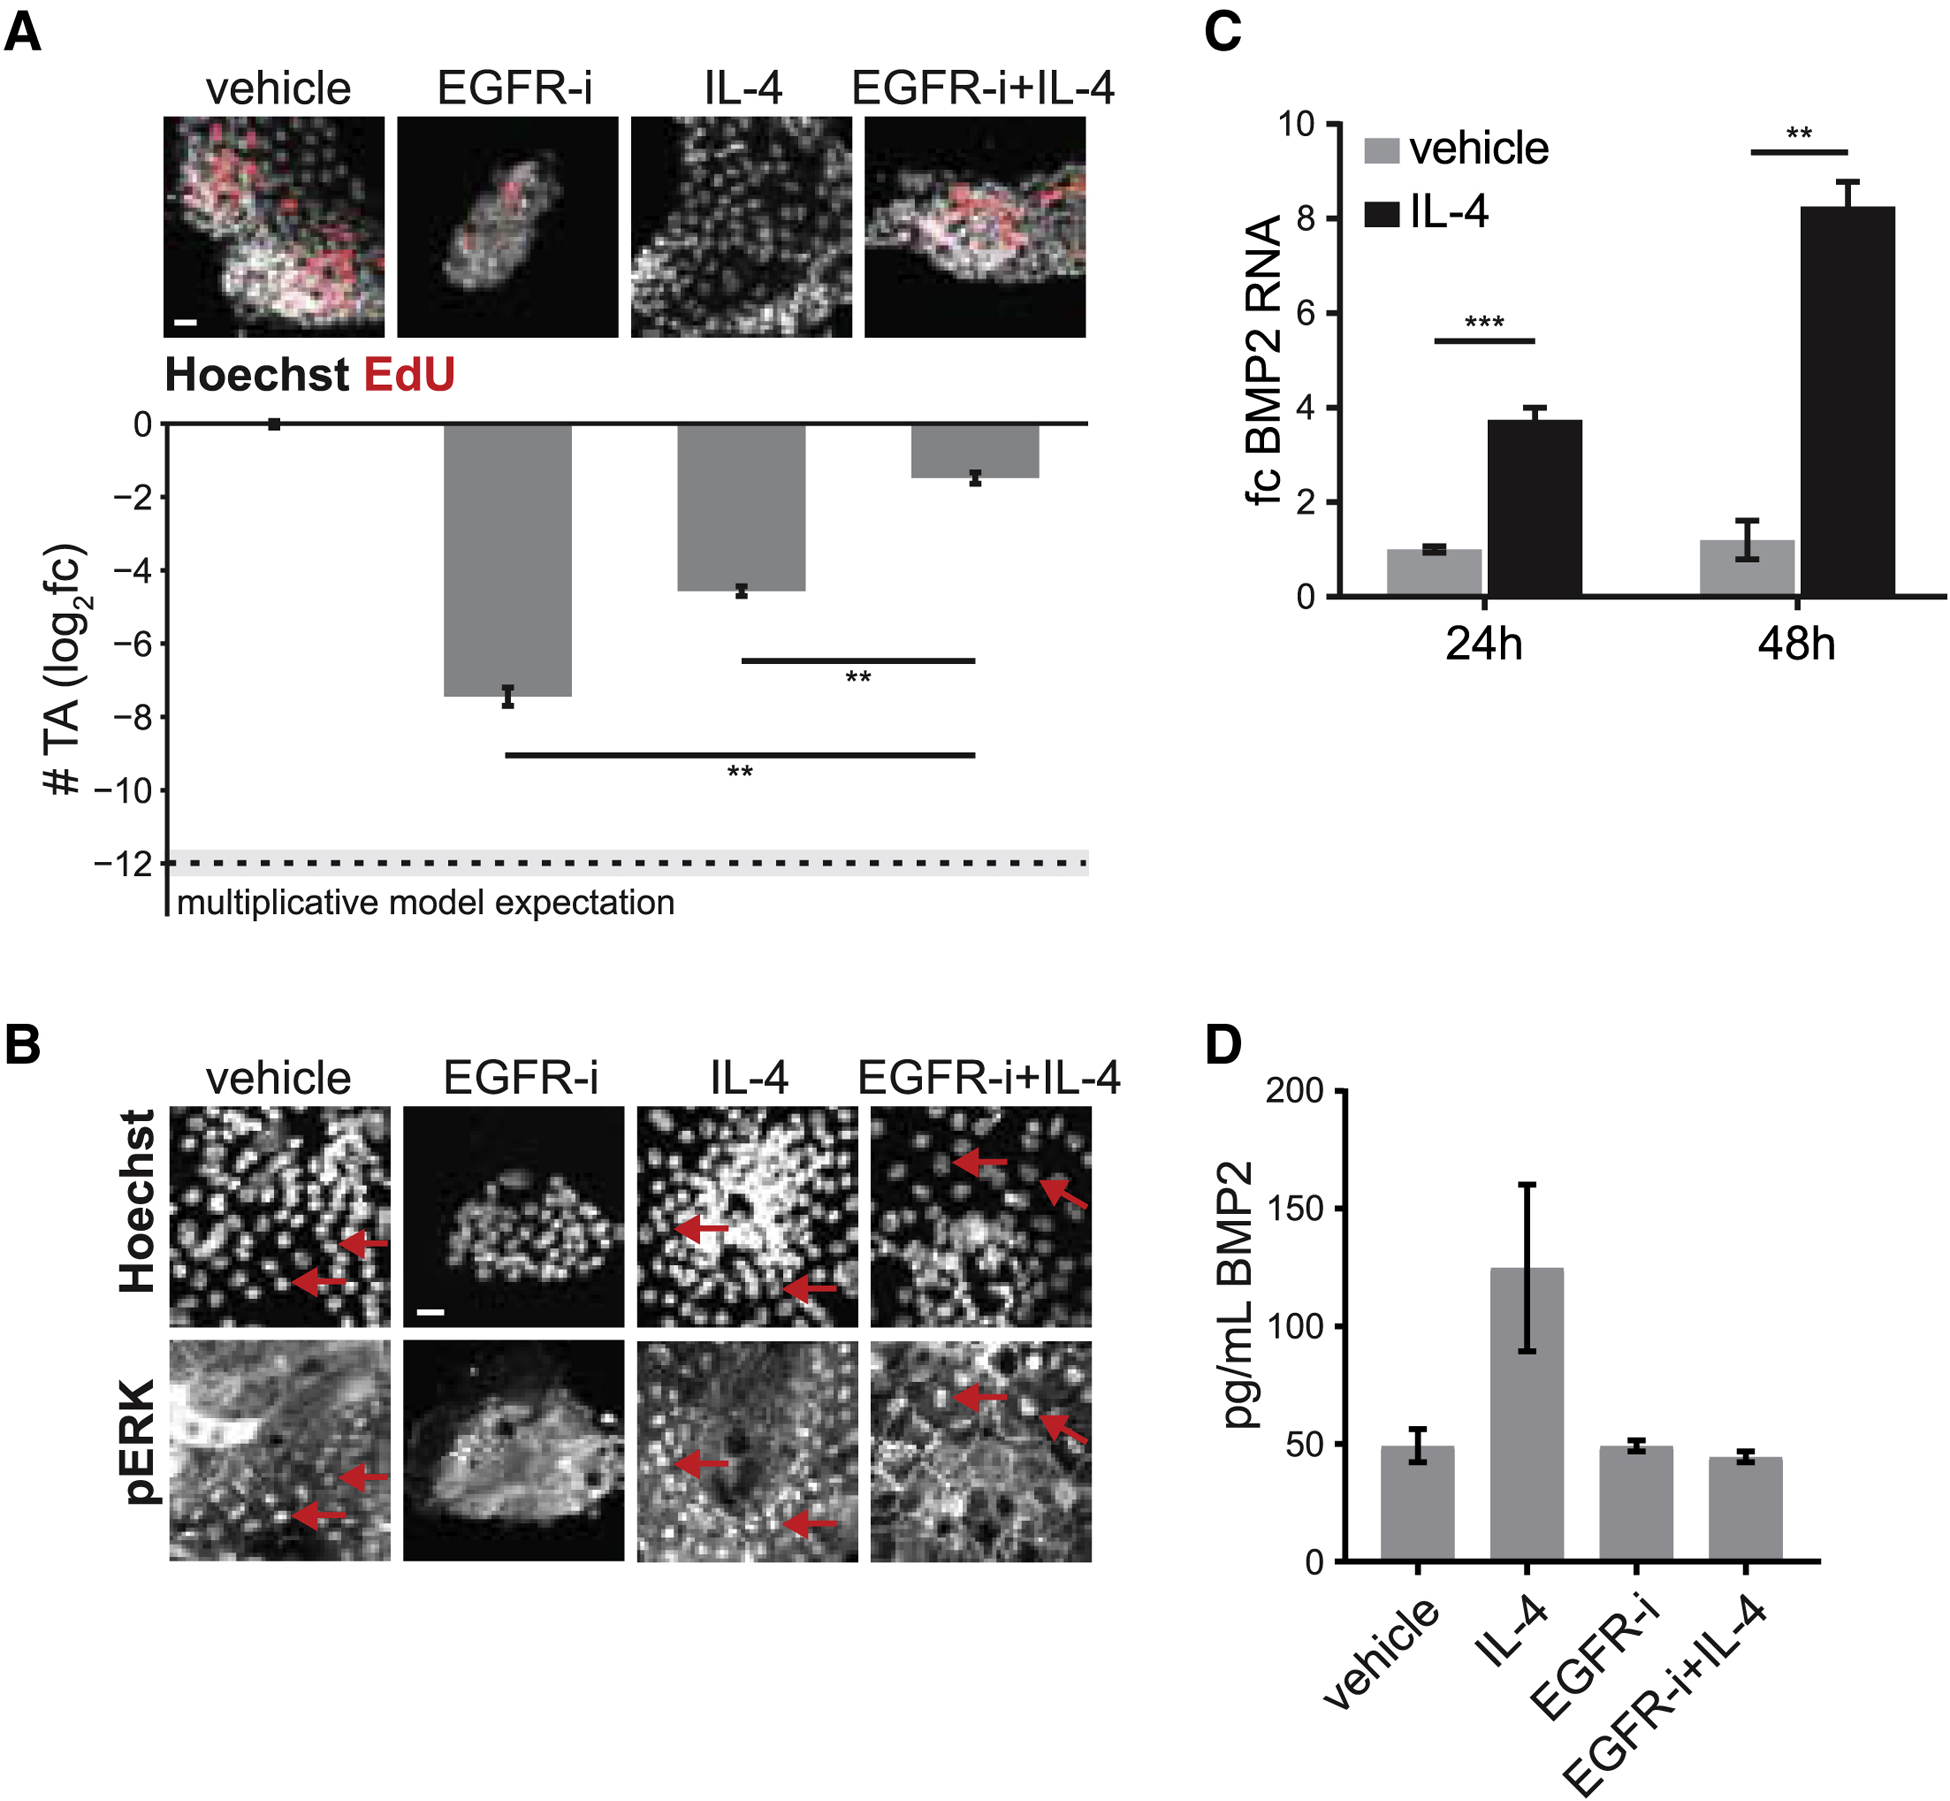
(A) Example images (top) and quantification of TA cell numbers (bottom) in enteroid monolayers treated as indicated for 48 hours. Co-treatment of IL-4 + EGFR-i strongly deviates from the multiplicative model of perturbation interaction (dashed line; effect size>5, p < 0.0001). Error bars mean +/− SEM. n=28 (vehicle), 6 (EGFR-i), 8 (IL-4), or 2 (IL-4 + EGFR-i) wells. Scale bar 10 μm.
(B) Example images of phospho-Erk staining in enteroid monolayers treated as indicated for 48 hours. Nuclear phospho-Erk is observed in all conditions except EGFR-i alone. Red arrows: example cells with nuclear phospho-Erk. Scale bar 7.5 μm.
(C) Enteroid monolayers were treated as indicated and BMP2 RNA levels were measured by qRT-PCR. Error bars mean +/− SEM. n=3 (vehicle 24h), 3 (IL-4 24h), 3 (vehicle 48h), or 2 (IL-4 48h) wells.
(D) Enteroid monolayers were treated as indicated for 48 hours and levels of BMP2 in the media were measured by ELISA (EGFR-i+IL-4 vs control: ns). n=2 wells. Error bars mean +/− SEM.
** indicates p-values < 0.01; *** indicates p-values < 0.001; ns: not significant
How does IL-4 signaling antagonize EGFR inhibition? Prior work suggested that EGFR inhibition decreases proliferation by reducing MEK-Erk activity (Basak et al., 2017). We found that IL-4 treatment can activate Erk even in the context of inhibiting EGFR (Figures 3B) or RAF (Figure S3F). However, IL-4 could neither activate Erk (Figure S3G) nor rescue TA cell numbers (Figure S3H) in the context of inhibiting MEK, whether EGFR was inhibited or not. Together, this indicated that IL-4 antagonizes EGFR inhibition by activating MEK-Erk signaling downstream of the EGFR-Ras-Raf cascade and upstream of MEK.
How does EGFR inhibition antagonize IL-4? Prior work suggested that BMP2 (the epithelial paralog of mesenchymal BMP4) production can reduce TA cell numbers (He et al., 2004; Thorne et al., 2018). We found that IL-4 treatment of enteroid monolayers significantly increases BMP2 production (Methods, Figure 3C). BMP receptor inhibition, while having no obvious effect on TA cell numbers on its own, rescued the IL-4 induced decrease in TA cell numbers in enteroid monolayers and 3D organoids (Figure S3I–J). Finally, co-treatment of EGFR-i + IL-4 showed no significant change in production of BMP2 compared to control conditions (Figure 3D). We note that EGFR-i and BMP did not interact through MEK-ERK signaling (Figure S3K). Together, this indicated that EGFR inhibition antagonizes BMP2 production induced by IL-4 and thereby rescues the decrease in TA cells.
Decreasing TA proliferation increases the ratio of secretory to absorptive cells
A fundamental question in renewing tissues is how proliferation regulates differentiated cell type composition. We searched across our diverse survey of perturbations for global trends between progenitor and secretory cell populations (Figure 4A, Figure S4A–B). Few correlations were observed, with one striking exception: TA cell numbers were anticorrelated with the fraction of differentiated (EdU−) cells that express secretory markers (Figure 4A). Further analysis showed that the EdU− population was largely composed of secretory and absorptive (FABP1+) cells (Methods, Figure S1F, S4C–D), indicating that altering TA cell numbers may modulate the balance between secretory and absorptive cells. Importantly, this anticorrelation was not driven by any specific perturbation (Figure 4B, Methods), suggesting that it reflects a tissue-intrinsic property.
Figure 4. Inhibiting proliferation increases secretory cell prevalence in enteroid monolayers, in 3D organoids, and in vivo.
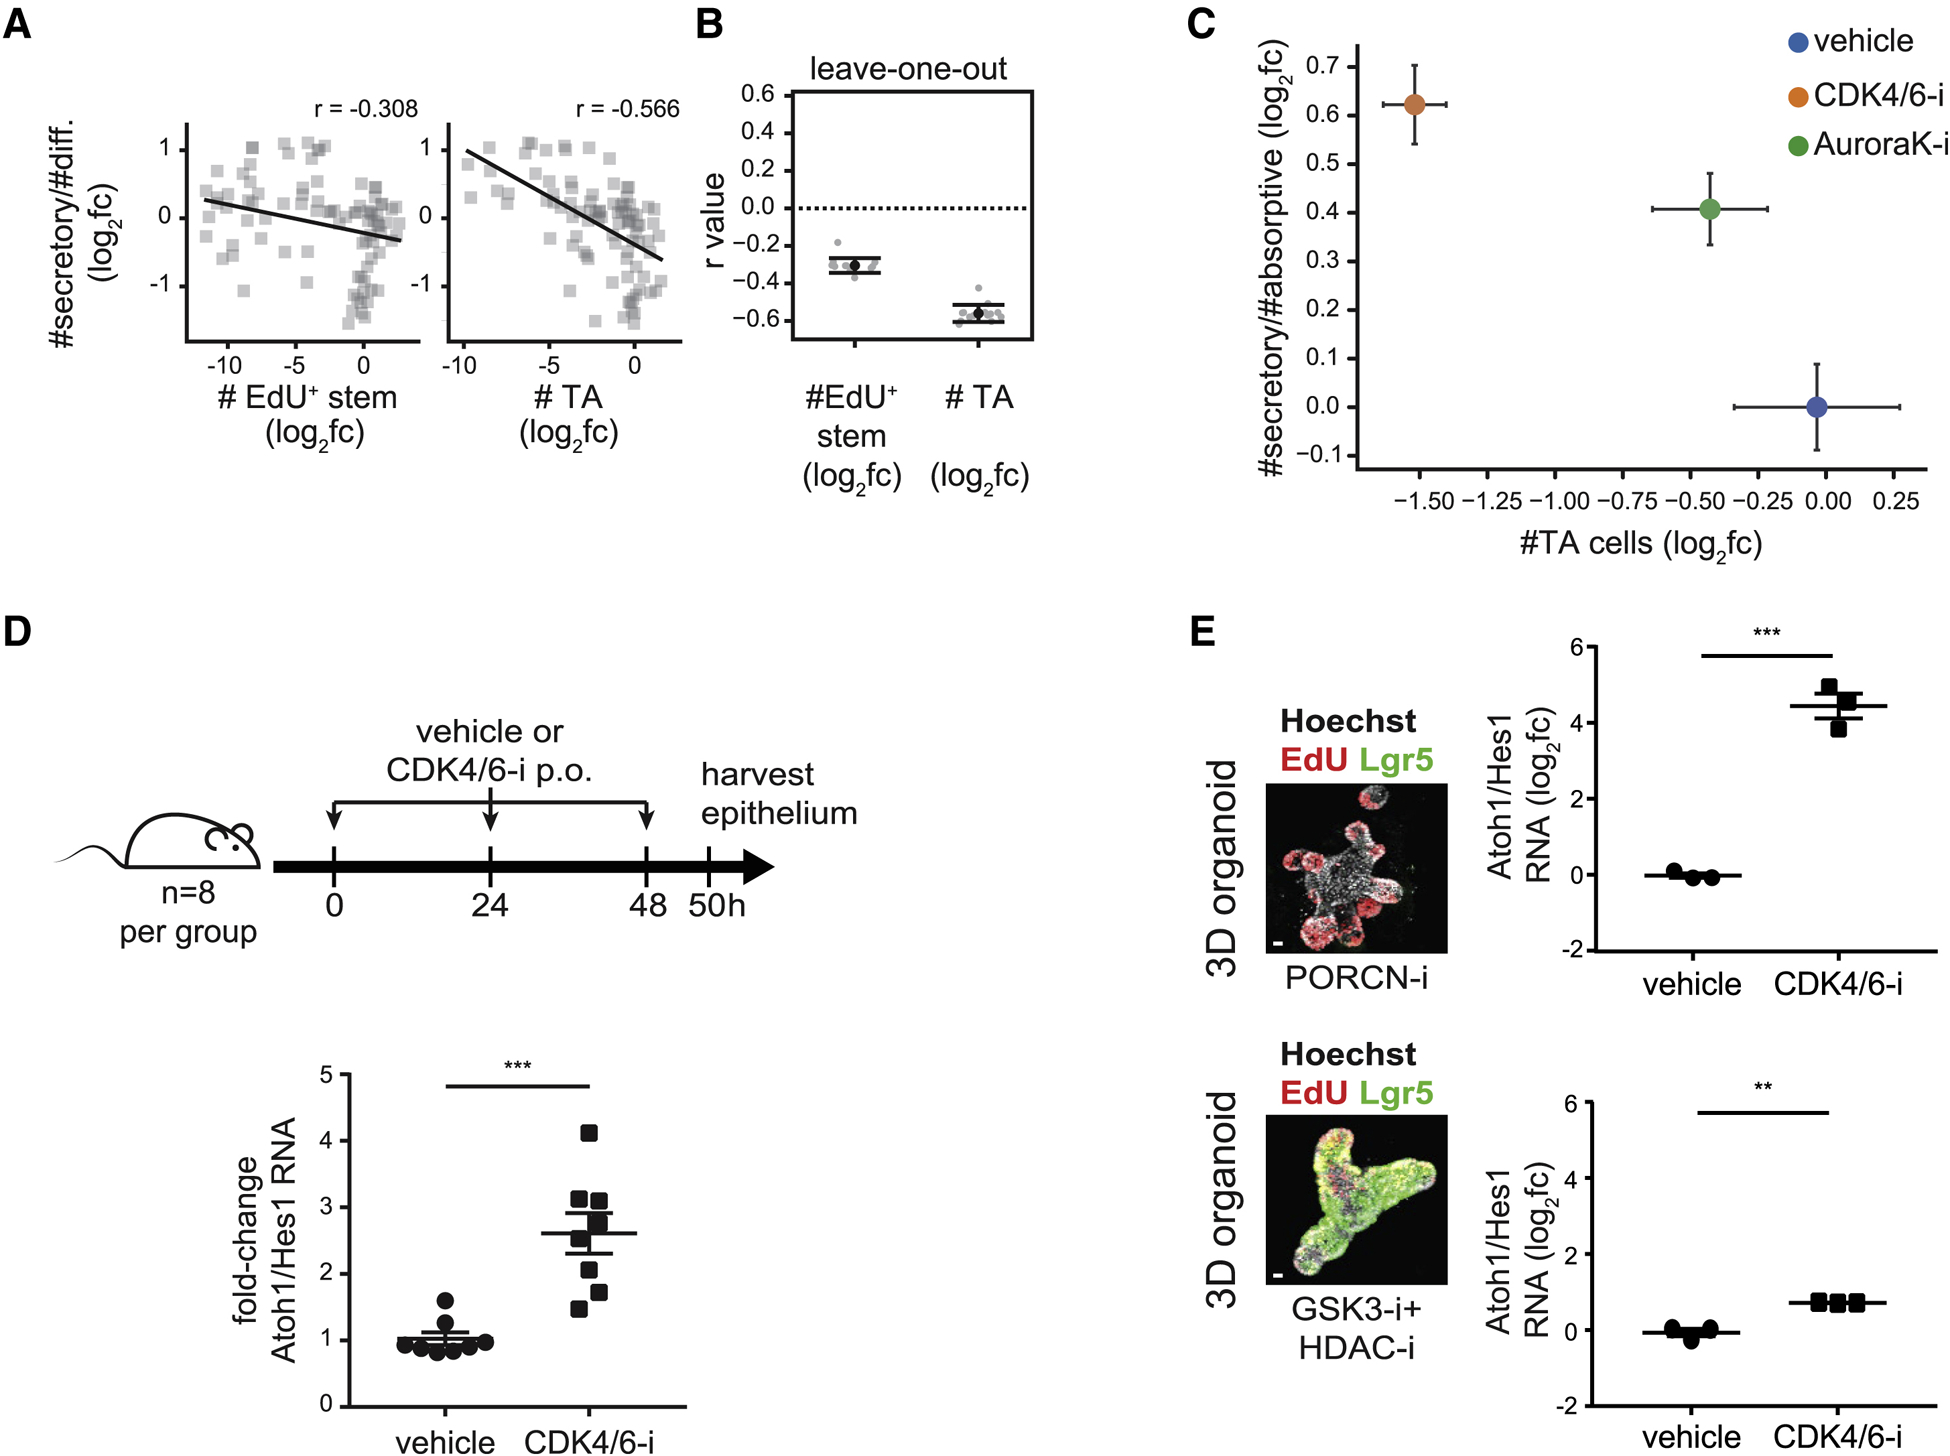
(A) Numbers of TA cells, but not EdU+ stem cells, correlate with secretory cell fractions. Perturbation effects (log2fc) are plotted pairwise for each feature. r: correlation coefficient (r). Diff.: #EdU− cells (Methods).
(B) The TA to secretory cell correlation is not driven by a specific perturbation. Each of 13 perturbations was sequentially dropped from the dataset and correlation coefficients (r value) were calculated. Error bars mean +/− SD.
(C) Inhibiting cell cycle progression increases secretory cell fractions. Enteroid monolayers were treated as indicated for 48 hours, after which #TA cells and #secretory/#absorptive cells were quantified. n = 3 wells. Error bars mean +/− SEM.
(D) Impairing proliferation increases the secretory to absorptive (Atoh1:Hes1) ratio in vivo. Mice were treated with CDK4/6-i (palbociclib) or vehicle every 24 hours for 48 hours. At 50 hours, intestinal crypts were harvested and gene expression was measured by qRT-PCR. n=8 mice/group. Error bars mean +/− SEM.
(E) TA cells alter secretory fractions in response to cell cycle inhibitors. 3D organoids were enriched for stem (GSK3-i + HDAC-i) or TA (PORCN-i) cells then treated with a CDK4/6 inhibitor (palbociclib) for 48 hours. The secretory to absorptive (Atoh1:Hes1) ratio was measured by qRT-PCR. n = 3 wells. Scale bars 10μm. Error bars mean +/− SEM.
** indicates p-values < 0.01; *** indicates p-values < 0.001
We also observed this anticorrelation upon directly modulating proliferation using cell cycle inhibitors in enteroid monolayers, 3D organoids, and in vivo. In enteroid monolayers, the cell cycle inhibitors CDK4/6-i (palbociclib) and AuroraK-i (AT9283) decreased TA cell numbers (estimated using either EdU and Ki67 staining) and increased the secretory to absorptive ratio in a dose-dependent manner (Figures 4C, S4E–J). We note that while progenitor cell numbers were reduced under cell cycle inhibitor treatments, the tissue spatial organization into crypt-like foci and differentiated regions was maintained (Figure S4E). To validate this correlation in vivo, mice (n=8 per group) were treated with CDK4/6-i or vehicle. After 50 hours of treatment, intestinal crypts were harvested and RNA levels of proliferative (Ki67), secretory (Atoh1) and absorptive (Hes1) cell markers were measured. Consistent with the enteroid monolayer experiment, CDK4/6-i treatment decreases proliferation (Figure S4K) and increases the secretory to absorptive ratio (Figure 4D). Finally, we used 3D organoids to test whether the anticorrelation is specific to TA cells, but not stem cells. 3D organoid cultures, enriched for either stem or TA cells (Figures 4E, images, S4L), were treated with CDK4/6-i. Strikingly, CDK4/6-i increased the secretory to absorptive ratio in 3D organoids enriched for TA cells ~10-fold more than in 3D organoids enriched for Lgr5+ stem cells (Figure 4E, graphs). Together, these results demonstrate that decreasing TA proliferation causes the relative fraction of secretory to absorptive cells to increase in the intestinal epithelium.
Differential amplification as a model for proliferation-based control of tissue composition
How does altering TA cell proliferation affect the abundance of secretory cells relative to absorptive cell types? Lineage structures have been modeled in the past, such as the branching of progenitors in enabling robust feedback control (Lander et al., 2009). Previous studies suggest that secretory progenitors are less proliferative compared to absorptive progenitors. In particular, commitment to a secretory fate (specifically expression of the Notch ligand Dll1) coincides with cell cycle exit (Stamataki et al., 2011), and lineage tracing showed that secretory cell clones are on average smaller than absorptive cell clones (Bjerknes and Cheng, 1999).
We confirmed that secretory progenitors undergo fewer divisions—and thus have less amplification—than absorptive progenitors. An EdU dilution experiment (Methods) in enteroid monolayers indicated that the overall population of intestinal epithelial cells were amplified more than the secretory cell types (Figure 5A). Next, we made use of clonal lineage tracing experiments to investigate the observed differential amplification between absorptive and secretory progenitors. Enteroid monolayers from transgenic mice (Atoh1-CreER;R26R-tdTomato or Notch1-CreER;R26R-tdTomato) were treated with 4-hydroxytamoxifen for 24 hours to induce sparse labeling of secretory (Atoh1+) or absorptive (Notch1+) clones (Methods, Figures 5B–C). We observed that on average absorptive progenitors amplified 3.8-fold more than secretory progenitors (secretory: 3.5 cells per clone; absorptive: 13.3 cells per clone). This suggested that absorptive progenitors undergo ~2 more cell divisions than secretory progenitors. In contrast, Cdk4/6-i treatment caused absorptive progenitors to amplify only ~1.6 fold more than secretory progenitors (secretory: 2.7 cells per clone; absorptive: 4.2 cells per clone). Thus, inhibiting proliferation impairs amplification of absorptive cells to a greater extent than secretory cells.
Figure 5. Differential amplification of secretory progenitors connects proliferation with differentiated cell type composition.
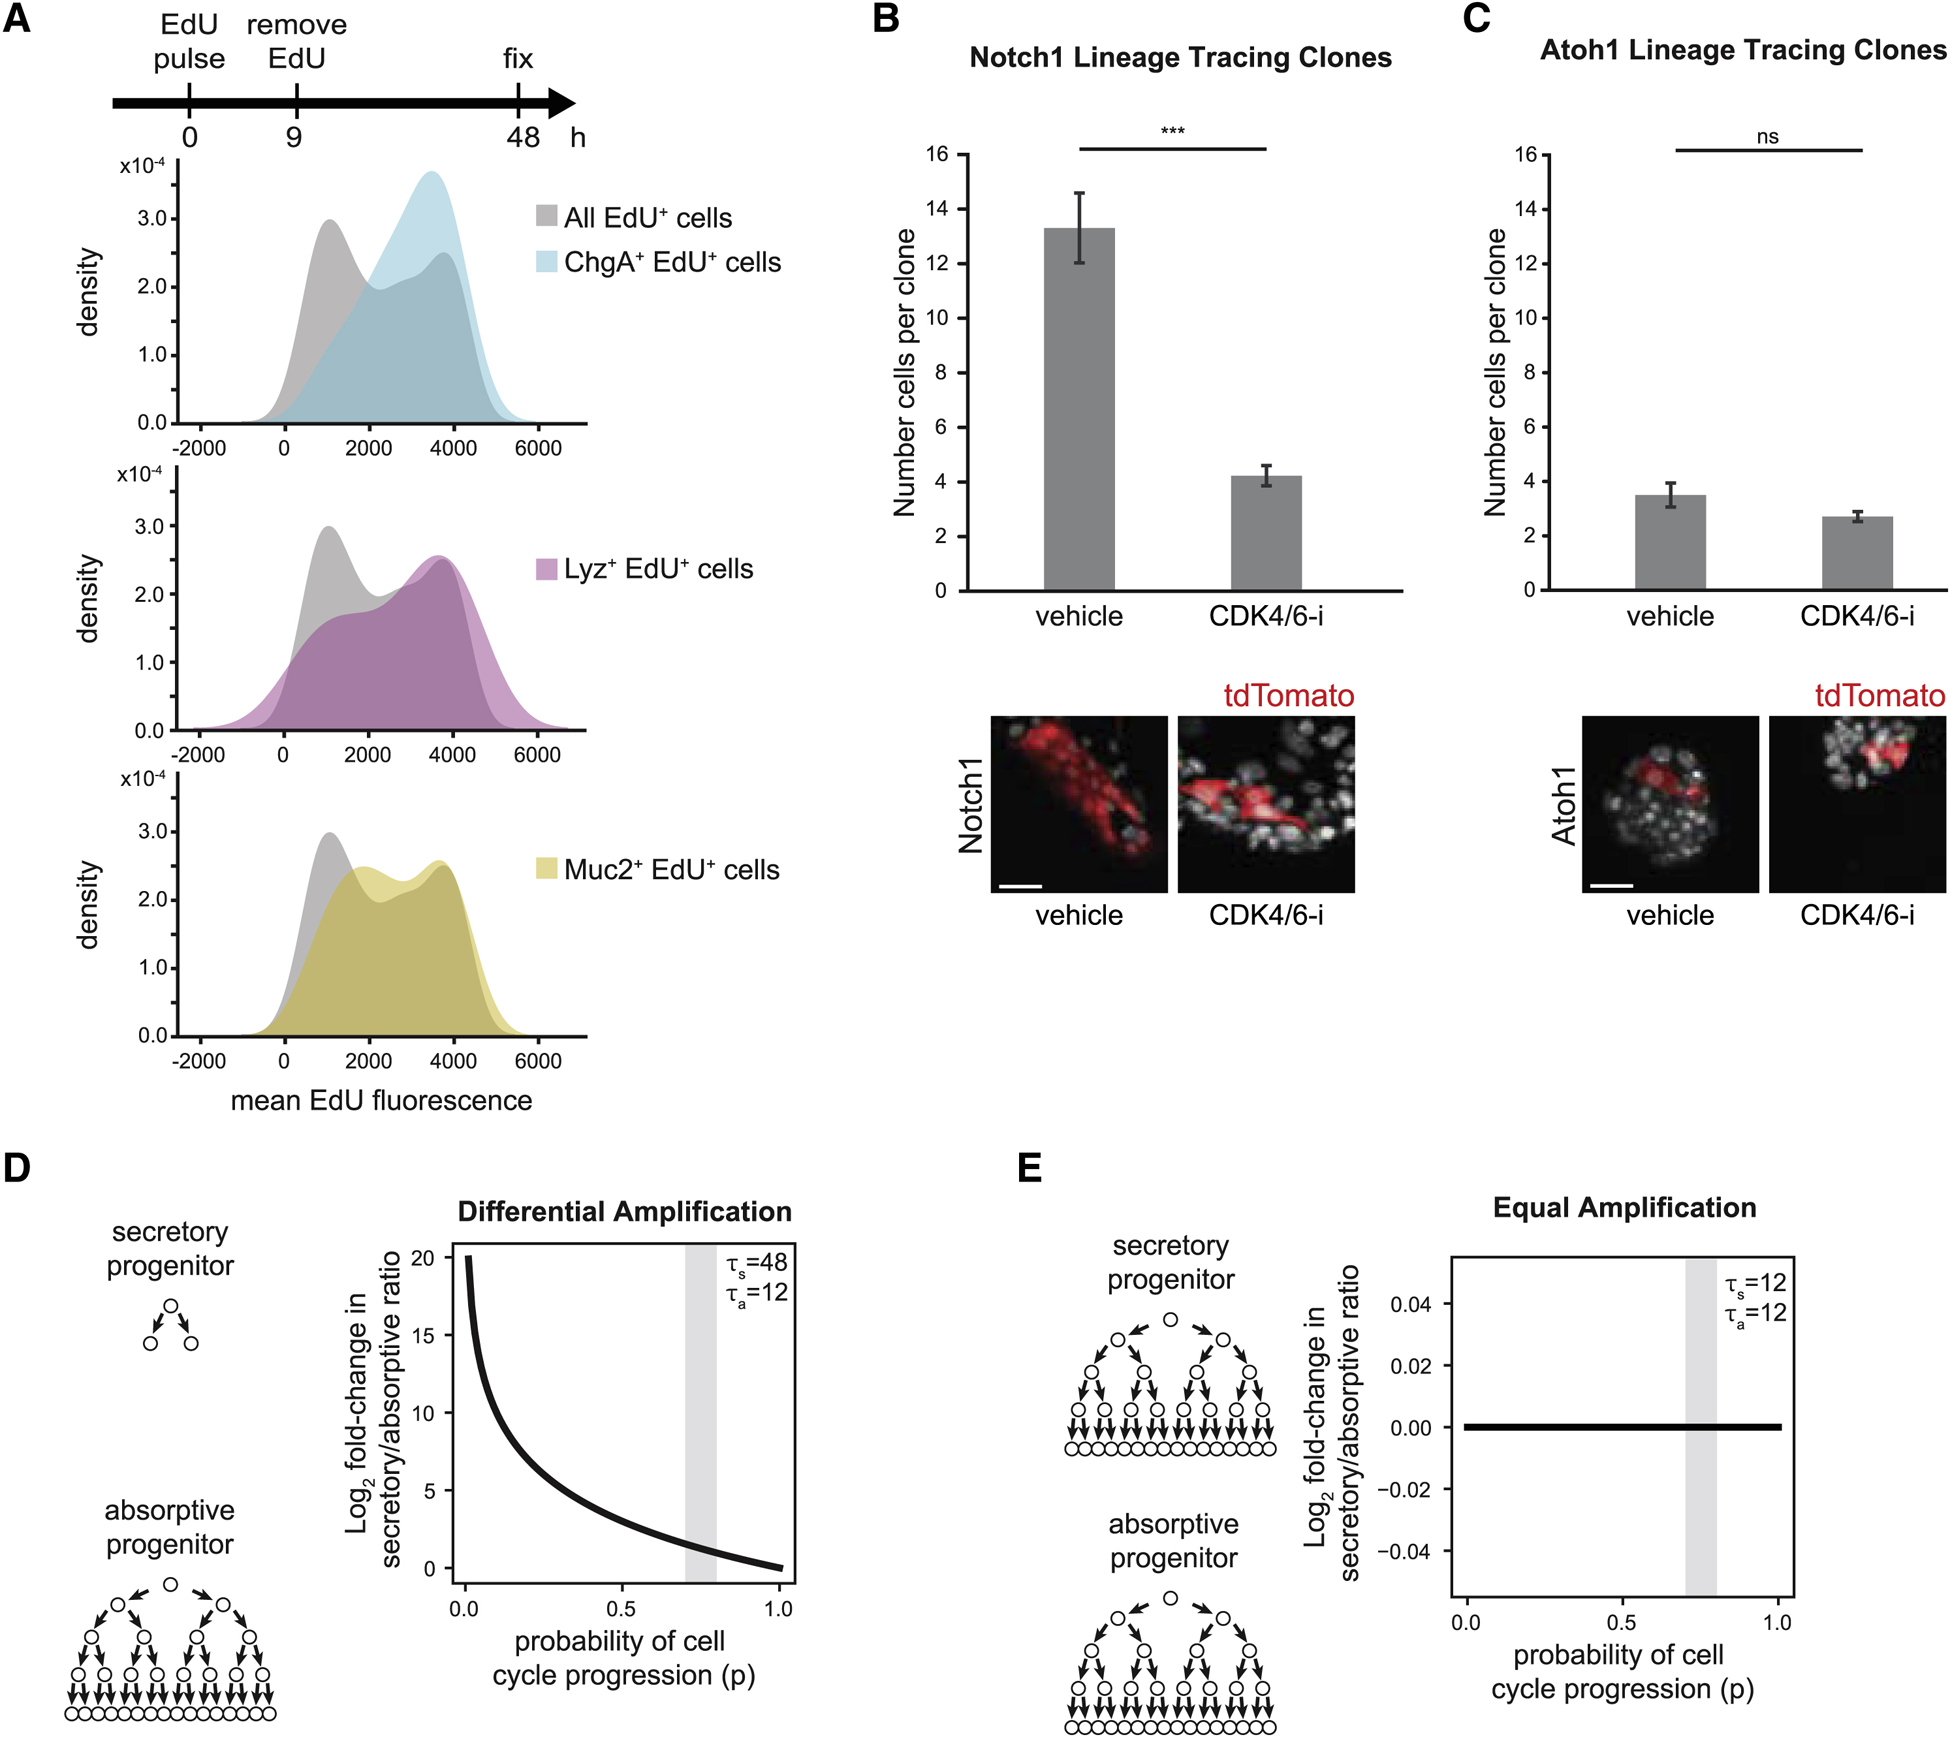
(A) Secretory progenitors divide fewer times than other progenitors. Top: Enteroids were pulsed with EdU (0–9 hours) then fixed and stained (at 48 hours). Mean EdU signal intensity was quantified in all EdU+ cells and in EdU+ cells that also stained positive for markers of Paneth (Lyz), goblet (Muc2) and EE (ChgA) cells. Distribution of EdU intensities is represented as a kernel density plot. Cells with higher EdU intensity divided fewer times than those with lower EdU.
(B-C) Enteroid monolayers were derived from (B) Notch1-CreER;R26R-tdTomato mice or (C) Atoh1-CreER;R26R-tdTomato mice. 4-hydroxytamoxifen was added to cultures for 24 hours, followed by 48 hours of vehicle or CDK4/6-i (palbociclib). CDK4/6-i reduced the average number of cells in absorptive (Notch1) clones but had little effect on the average number of cells in secretory (Atoh1) clones. Representative images of clones under vehicle or CDK4/6-i treatment are shown. Error bars mean +/− SEM. n= 78 (Notch1 vehicle), 74 (Notch1 CDK4/6-i), 30 (Atoh1 vehicle), or 38 (Atoh1 CDK4/6-i) clones. Scale bar 50 μm.
(D-E) Model output of secretory to absorptive differentiated cell ratio as a function of probability of cell cycling (p). Gray bands indicate experimentally observed range for parameter p.
(D) Secretory progenitors divide fewer times than absorptive progenitors (τs=48 hours, τa=12 hours). Inhibiting the cell cycle (increasing p) increases the secretory to absorptive ratio.
(E) Secretory progenitors divide the same number of times as absorptive progenitors (τs, τa=12 hours). Inhibiting the cell cycle (increasing p) does not change the secretory to absorptive ratio.
*** indicates p-values < 0.001; ns: not significant
Finally, we mathematically modeled the lineage expansion process from TA to differentiated cells (Methods, Figures 5D–E, S5A–B). A fit of parameters to the clonal lineage tracing data suggests that the effects of cell cycle inhibitors on division probabilities were roughly the same for both lineages (Methods). Moreover, the model recapitulates the anticorrelation between proliferation and the secretory to absorptive cells type ratio (Figures 5D–E). In summary, differential amplification of TA progenitors in the intestinal epithelium provides a mechanism for controlling the secretory to absorptive bias through proliferation.
Discussion
The intestinal epithelium is a constantly renewing tissue that maintains a precise cell type composition throughout life. To investigate how signals combine to regulate tissue renewal, we conducted a systematic survey of single and paired perturbations on enteroid monolayers. Our survey revealed conditions that enrich for specific cell types, including Lgr5+ stem (combinations of GSK3, p38MAPK, BMPR, HDAC, and JAK1/2 inhibitors) and enteroendocrine cells (TGF-β +/− PORCN-i). These results highlight potential convergent effects of these pathways in regulating stemness and EE cell maturation, respectively. We also identified perturbations that have unexpected combined effects on tissue growth, including an unexpected mutual antagonism between IL-4 and EGFR-i that regulated the TA cell population. Investigation of this antagonism led us to identify functions of IL-4, namely its ability to bypass an EGFR blockade and to induce BMP production.
Our survey further suggested a general anticorrelation between progenitor cell proliferation and the ratio of secretory to absorptive cells (observed in enteroid monolayers, 3D organoids and in vivo). We found fewer rounds of cell division for secretory than absorptive progenitors, and that this difference diminishes under cell cycle inhibition (observed in enteroid monolayer in both EdU dilution and lineage tracing studies), leading to an increase in the differentiated secretory to absorptive cell ratio. These results suggest a “differential amplification model” by which modulating TA cell proliferation (such as during times of injury, infection or calorie restriction) can control tissue cell type composition (Koch and Nusrat, 2012; Yilmaz et al., 2012).
A limitation of our current study is that we did not take into account the spatial arrangements or dynamics of TA cell spatial localization in the niche. Future studies will be needed to dissect the interplay among TA cell location, microenvironmental signals, and amplification. Further, while our study identified and focused on differential amplification, probabilistic fate decisions from stem cells also play a role in controlling cell type composition (Balázsi et al., 2011). It will be interesting in future studies to identify how these two mechanisms co-exist, and whether they play different roles in homeostatic control of tissue.
Our studies point to a crucial and overlooked role for TA cells in guiding tissue function. TA cells can coordinate tissue responses to changing microenvironments (e.g. worm infections (Birchenough et al., 2016)) and thereby insulate stem cells from extreme, transient changes. TA cell intermediates between the stem and differentiated cell populations are present in numerous organs, including skin and the hematopoietic system, and differential amplification may play a general role in regulating cell type composition.
STAR Methods
Resource Availability
Lead Contact
Further information and requests for resources and reagents should be directed to and will be fulfilled by the Lead Contact, Steven Altschuler (steven.altschuler@ucsf.edu).
Materials Availability
This study did not generate new unique reagents.
Data and Code Availability
The published article includes all datasets generated or analyzed during this study. The code (image analysis software) generated during this study are available at Github (https://github.com/AltschulerWu-Lab/MAGS).
Experimental Model and Subject Details
Mice
All animal care and experimentation was conducted under protocol AN-179937 agreed upon by the Administrative Panel on Laboratory Animal Care at the University of California, San Francisco. All our animal studies are performed in full accordance with UCSF Institutional Animal Care and Use Committee (IACUC). 5- to 6-week-old male C57BL/6 mice (C57BL/6NHsd) were purchased from Envigo. Lgr5eGFP-DTR mice were a kind gift from Frederic de Sauvage, Genentech under MTA #OM-216813 (Tian et al., 2011). Intestinal epithelium-specific SMAD3 null mice (SMAD3 fl/fl;Villin-Cre/wt) were generated by crossing SMAD3 fl/fl mice (kind gift from Tamara Alliston) with Villin-Cre mice. Secretory and absorptive progenitor cell labeled enteroid monolayers were generated from Atoh1-CreER;R26R-tdTomato and Notch1-CreER;R26R-tdTomato mice, respectively. Mice were housed with ad libitum food and water on a 12 hour light cycle at the UCSF Preclinical Therapeutics Core vivarium.
Enteroid monolayer cultures
Enteroid monolayers were derived as previously described (Thorne et al., 2018, Sanman et al., 2020). Briefly, jejunum was isolated from male mice between 6–12 weeks of age. Mice used were either from the C57BL/6 strain or, when indicated, the Lgr5eGFP-DTR strain. Epithelium was released from jejunal tissue by incubation in ice-cold PBS with 3 mM EDTA in PBS (Ambion #9260). Released epithelial tissue was washed 3x with OBM, after which crypts were separated from villus material using 100 and 70 μm cell strainers (BD Falcon) in succession. Crypts were resuspended in seeding media and plated on Matrigel (Thermo Fisher #CB-40234C)-coated 96-well optical bottom plates (BD Biosciences #353219 and Greiner #655090). Typically, 300 crypts were seeded per well. We identified this seeding density because, at this density, we did not observe an effect of variations in initial confluency on cell outgrowth (#cells) or cell type composition (Figure S1F). Four hours after seeding, cells were washed with OBM and incubated in control media containing other perturbations of interest. At the 48 hour time point, ~30,000–40,000 cells were typically observed per well under control conditions.
3D organoid cultures
3D organoids were cultured as previously described (Sato et al., 2009). Organoids were derived from male mice between 6–12 weeks of age. Mice used were either from the C57BL/6 strain or, when indicated, the Lgr5eGFP-DTR strain. For imaging experiments, 3D organoids were seeded in 10 μL of Matrigel in 96-well optical bottom plates.
Method Details
Media
Organoid basal media (OBM) consists of Advanced DMEM/F12 with non-essential amino acids and sodium pyruvate (Fisher Scientific #12634–028) containing 1x N-2 (Fisher Scientific #17502–048), 1x B-27 (Invitrogen #17504–044), 10 mM HEPES (Invitrogen #15630080), 1x GlutaMAX (Invitrogen #35050–061), 1 μM N-acetylcysteine (Sigma Aldrich #A9165), 100 U/mL penicillin and 100 μg/mL streptomycin (Corning #30–002).
For initial seeding, enteroid monolayers were maintained in OBM supplemented with 3 μM CHIR-99021 (Sigma Aldrich #SML1046), 50 ng/mL murine EGF (Invitrogen #PMG8043), 1 μM LDN-193189 (Sigma Aldrich #SML0559), 500 ng/mL murine R-spondin-1 (Peprotech #315–32), and 10 μM Y-27632 (Selleck Chemicals #S1049).
4 hours after initial seeding, media was changed into OBM supplemented with 50 ng/mL murine EGF, 100 ng/mL murine Noggin, and 500 ng/mL murine R-spondin-1. Perturbations applied in the studies described here were all applied in the background of this medium.
Growth factors and chemical compounds
All growth factors and chemical compounds were purchased from suppliers and used as designated without further purification. Unless otherwise indicated, perturbations were used as follows:
| Perturbation | Vendor and Catalog # | Concentration |
|---|---|---|
| DAPT (Notch-i) | Stemgent #04–0041 | 10 μM |
| CHIR-99021 (GSK3-i) | Sigma Aldrich #1046 | 3 μM |
| Valproic acid (HDAC-i) | Sigma Aldrich #P4543 | 1 mM |
| IWP-2 (PORCN-i) | Selleck Chemicals #S7085 | 2 μM |
| Wnt3a | R&D Systems #5036-WN-500 | 200 ng/mL |
| TGF-β | PeproTech #100–21C | 4 ng/mL |
| EW-7197 (TGF-βR-i) | Selleck Chemicals #S7530 | 1 μM |
| BMP4 | R&D Systems #314-BP-010 | 200 ng/mL |
| LDN-193189 (BMPR-i) | Sigma Aldrich #SML0559 | 1 μM |
| Baricitinib (JAK1/2-i) | Selleck Chemicals #S2851 | 2 μM |
| SB202190 (p38MAPK-i) | Sigma Aldrich #S7067 | 10 μM |
| IL-4 | PeproTech #214–14 | 20 ng/mL |
| Erlotinib HCl (EGFR-i) | Selleck Chemicals #S1023 | 2.5 μM |
| PD0325901 (MEK-i) | Selleck Chemicals #S1036 | 1 μM |
| Palbociclib (PD-0332991) (CDK4/6-i) | Selleck Chemicals #S1116 (organoid studies) or LC Laboratories #−7744 (in vivo studies) | 10 μM |
| Flavopiridol (CDK-i) | Selleck Chemicals #S2679 | 0.3 μM |
| AT9283 (AuroraK-i) | Selleck Chemicals #S1134 | 1 μM |
CDK4/6-i administration to mice and tissue harvest
To test the effects of cell cycle inhibition on the secretory to absorptive ratio, palbociclib (LC Laboratories #P-7744) at 150 mg/kg in 50 mM sodium lactate buffer pH 4.4 was administered to mice by oral gavage every 24 hours for 48 hours (at 0 hours, 24 hours, and 48 hours). At 50 hours, the small intestine was harvested, and intestinal crypts were harvested as described in the enteroid monolayer culture section above. Crypts were lysed in Buffer RLT (RNEasy Kit, Qiagen) for subsequent RNA purification.
3D organoid enrichment for stem and TA cells
3D organoid cultures were enriched for stem cells by treating with GSK3-i + HDAC-i for 48 hours (Yin et al., 2014). 3D organoid cultures were enriched for TA cells by treatment with PORCN-i for 24 hours.
Immunofluorescence assay
Enteroid monolayer
Enteroid monolayers were washed 1x with warm D-PBS and then fixed with 4% paraformaldehyde in PBS for 15 minutes at room temperature. Cells were then washed with PBS and permeabilized with 0.5% Triton-X-100 in PBS at room temperature for 10 minutes. Cells were washed, blocked with 3% BSA in PBS for 30 minutes, and then incubated in primary antibody in antibody buffer (PBS with 0.3% Triton-X-100, 1% BSA) overnight at 4C. The next day, cells were washed and incubated with secondary antibodies and Hoechst 33342 (5 μg/mL; Invitrogen #H3570) in antibody buffer for 2 hours at room temperature. After this, cells were washed with PBS and imaged in TBS-T (0.1% Tween in 1x TBS pH 7.4).
3D organoids
Media was carefully aspirated from around Matrigel domes containing 3D organoids using a P100 pipette. 4% paraformaldehyde in PBS was immediately added for 15 minutes at room temperature. Cells were then washed 2x with PBS and permeabilized using 0.5% Triton-X-100 in PBS for 20 minutes at room temperature. Cells were then rinsed 3×10 minutes with 100 mM glycine in PBS with gentle agitation. Cells were blocked in 3% BSA in PBS for 40 minutes and then incubated with primary antibody in antibody buffer overnight at room temperature. The next day, cells were washed 3×20 minutes in antibody buffer and then incubated with fluorescent secondary antibodies and Hoechst in antibody solution for 1 hour at room temperature. Cells were then rinsed in PBS and stored and imaged in TBS-T.
Antibodies
All antibodies were purchased from suppliers and used as designated without further purification. Unless otherwise indicated, antibodies were used as follows:
| Epitope | Vendor and Catalog # | Dilution |
|---|---|---|
| Lysozyme (Lyz) | Dako | 1:2000 |
| Mucin-2 (Muc2) | Santa Cruz Biotechnology #15334 | 1:100 |
| Chromogranin A (ChgA) | Santa Cruz Biotechnology #393941 | 1:100 |
| GFP | Abcam #5450 | 1:2000 |
| Dclk1 | Abcam #31704 | 1:1000 |
| Erk1 (pT202/pY204) + Erk2 (pT185/pY187) (pErk) | Abcam #50011 | 1:200 |
| Cyclin D1 | Life Technologies #MA5–14512 | 1:200 |
| Active Caspase-3 | BD Pharmingen #559565 | 1:500 |
EdU pulse and visualization
To visualize proliferating cells (specifically, those in S phase), enteroid monolayers were incubated with 10 μM EdU (Thermo Fisher #A10044) in media (containing indicated perturbations or vehicle) for 2 hours prior to fixation. After immunofluorescence staining, EdU+ cells were visualized using Click chemistry as previously described (Salic and Mitchison, 2008). Briefly, cells were incubated with a reaction mixture containing 1 mM CuSO4 (VWR International #470300–880), 5 μM sulfo-Cyanine5 azide (Lumiprobe #B3330) or 5 μM BDP-FL azide (Lumiprobe #11430), and 100 mM sodium ascorbate (Sigma Aldrich #A4034) in PBS for 30 minutes at room temperature.
EdU dilution experiment
An EdU pulse was administered for the first 9 hours of culture (less than one TA cell cycle length (Matsu-Ura et al., 2016)), followed by a chase of 39 hours. EdU is initially incorporated into proliferating cells and then subsequently diluted with each cell division. Thus, EdU intensity in differentiated cells serves as a proxy for division number. Cells were fixed and stained for secretory cell markers Lyz, Muc2, and ChgA as well as EdU.
RNA sequencing
RNA was harvested using an RNEasy Plus Mini Kit (Qiagen) according to manufacturer’s instructions. Libraries were prepared using a QuantSeq 3’ mRNA-Seq Library Prep Kit FWD for Illumina. Samples were quantified by Qubit prior to pooling and library size and integrity confirmed by Agilent Bioanalyzer with the high-sensitivity DNA kit. RNA sequencing was performed using 50 bp single-end sequencing on the Illumina HiSeq 4000 in the UCSF Center for Advanced Technology. A PhiX control library was used as an in-run control, spiked in at 5%.
BMP2 ELISA
Supernatant levels of BMP2 were quantified using a BMP-2 Quantikine ELISA kit (R&D Systems #DBP200), without significant deviations from manufacturer’s instructions. We note that the measured concentration may be lower than the actual concentration due to the presence of Noggin, which binds BMP, in the culture media.
qRT-PCR
RNA was harvested from enteroid monolayers using an RNEasy Plus Mini Kit (Qiagen #74136). Reverse transcription was performed using iScript Reverse Transcription kit (Bio-Rad #1708841). Quantitative PCR was performed using SsoAdvanced Universal SYBR Green Supermix (Bio-Rad #1725272) on a BioRad CFXConnect. RNA levels were determined using the following primers:
| Target mRNA | Forward Primer | Reverse Primer |
|---|---|---|
| Atoh1 | 5’-TCCCCTTCCTCCTACCTTCTCC-3’ | 5’-CAACACGCAAGGATGAACTCCC-3’ |
| Hes1 | 5’-AGAAGAGGCGAAGGGCAAGAAT-3’ | 5’-TGGAATGCCGGGAGCTATCTTT-3’ |
| Lyz | 5’-AAGAATGCCTGTGGGATCAA-3’ | 5’-CGGTTTTGACATTGTGTTCG-3’ |
| Muc2 | 5’-ACCCCAAGCCCTTCTCCTACTA-3’ | 5’-AGTGGATTGAGAGGTCACAGGC-3’ |
| ChgA | 5’-GCAACACAGCAGCTTTGAGGAT-3’ | 5’-GTTAGGCTCTGGAAAGGCCTGA-3’ |
| Bmp2 | 5’-GCTTCTTAGACGGACTGCGG-3’ | 5’-GCAACACTAGAAGACAGCGGGT-3’ |
| β-actin | 5’-CGCCACCAGTTCGCCATGGA-3’ | 5’-TACAGCCCGGGGAGCATCGT-3’ |
| Lgr5 | 5’-ACCCGCCAGTCTCCTACATC −3’ | 5’-GCATCTAGGCGCAGGGATTG −3’ |
| Ki67 | 5’-GTCAGCAAGAGGCAGCAAGGGG −3’ | 5’-CTGGGTCTTTGCCACTGGCTGG −3’ |
Automated brightfield microscopy
Upon initial plating, enteroid monolayers were imaged in the brightfield channel using the 10x objective of a Nikon TE200-E epifluorescence microscope. These data were used as a control to determine whether enteroid monolayers were seeded at an optimal and consistent confluency.
Automated confocal microscopy
Enteroid monolayers were imaged on the 10x objective of a Nikon A1 confocal with Ti2-E microscope. The area of each well was covered by 24 individual scans. In each field of view, 4–8 z planes were collected at 1024×1024 resolution. Importantly, the nuclear stain was used to autofocus in each new field of view. Images in the paper are maximum projection images.
Lineage tracing
Enteroid monolayers were derived from Atoh1-CreER;R26R-tdTomato and Notch1-CreER;R26R-tdTomato mice. After initial plating in 96-well imaging plates, 4-hydroxytamoxifen (Sigma) was added to cultures for 24 hours. After this, 4-hydroxytamoxifen was removed and vehicle or cell cycle inhibitors were added. Enteroid monolayers were cultured for a further 48 hours after which cultures were fixed and stained with Hoechst. The Atoh1 enteroid monolayers were imaged on an Operetta CLS High Content Imaging System (Perkin Elmer) at 20x resolution; the area of each well was covered by 61 individual scans and four z-planes were collected for each field of view. The Notch 1 enteroid monolayers were imaged on the Nikon A1 confocal with Ti2-E microscope as described above (Automated confocal microscopy; images of Notch 1 enteroids shown in Figure 5 were imaged on the Operetta).
Quantification and Statistical Analysis
Quantifying % confluency
% Confluency (percent of image which is occupied by enteroid monolayer cultures) was quantified from brightfield images using a previously reported algorithm (CellularRegionsFromBrightField function in Supplementary Software 1 from reference (Ramirez et al., 2016)).
Immunofluorescence image segmentation and analysis
General segmentation approach
Image segmentation was performed using a custom Python analysis pipeline. Starting with maximum intensity projections of Hoechst, EdU, Lgr5-GFP, Muc2, Lyz, and ChgA fluorescent images, we segmented and then quantified numbers of nuclei, EdU+ cells, stem cells, goblet cells, Paneth cells, and enteroendocrine cells, respectively. The general segmentation process for each object type consisted of two major steps: a thresholding step to identify image foreground, and a segmentation step to generate location and boundary of objects. Specific details are as follows:
Segmenting nuclei and EdU+ nuclei
Hoechst stain (for nuclei) or EdU (for EdU+ nuclei) images were smoothed through convolution with a bilateral filter. The foreground was identified using a modified Otsu threshold method. Sparse nuclei were first segmented using a multi-scale Laplacian of Gaussian (LoG) detector followed by watershed algorithm. Clumps of nuclei in the sparse segmentation were detected based object size and shape irregularity thresholds. The clumps were then further segmented using a differently parameterized LoG detector followed by watershed (also see Figure S1C).
Segmenting stem cells:
Lgr5-GFP stain images were processed to remove tissue background and thresholded to identify crypt regions. Holes and gaps in crypt regions were filled using morphological operations and small objects (typically Lgr5+/Dclk1+ cells, see Figure S1E) were dropped. Nuclei within crypt regions not associated with Paneth cells were segmented as stem cells (Figure S1A).
Segmenting goblet cells
Mucin-2 (Muc2) stain images were smoothed by convolution with a median filter. Foreground was identified using a convex hull of objects in each Otsu-thresholded Muc2 immunofluorescence image. Goblet cells were segmented using a LoG detector to generate markers of goblet object locations followed by watershed to create object boundaries.
Segmenting Paneth cells
Lysozyme (Lyz) immunofluorescence images were smoothed through convolution with a bilateral filter then a tophat filter. Foreground was identified using the Otsu-thresholded Lyz immunofluorescence image. A LoG detector was then used to generate markers of Paneth object locations.
Segmenting enteroendocrine (EE) cells
ChgA stain images were processed using the same steps as Paneth cell identification, only with different parameters.
Quantifying Lgr5-GFP intensity
Lgr5-GFP stain images were max projected. Mean intensities were quantified in nuclear segmentation, which captures cytoplasmic and membrane staining present across z-stacks in the segmentation regions.
Evaluation of Image Segmentation
Each cell type object (e.g., each nucleus, each goblet cell, each Paneth cell) was identified in raw immunofluorescence images by hand by an expert and, in parallel, using the customized algorithms described above. The expert-generated segmented images (where each mask represents an individual object) were compared to algorithm-generated segmented images to determine algorithm performance. ‘Precision’ was quantified by dividing the number of true positives (expert-identified objects also identified by the algorithm) by the number of total positives (all algorithm-identified objects). ‘Recall’ was quantified by dividing the number of true positives by the total number of expert-identified objects. F1 scores were calculated as the harmonic mean of precision and recall. See Table S1 for results.
Lineage tracing clone analysis
For analysis we made use of the following images: Notch1 – 2 conditions (control, palbociclib) × 72 images; Atoh1 – 2 conditions (control, palbociclib) × 61 images. Clones were identified as regions of continuous staining with > 1 cell. The number of nuclei in each clone was counted manually.
RNA expression analysis
RNA reads were mapped and counted using the Integrated QuantSeq data analysis pipeline on BlueBee (BlueBee, now Illumina). One sample (one replicate of TGF-β + PORCN-i treatment) was removed from downstream analysis due to small library size and not passing other QC metrics. Filtering and normalization was performed using edgeR. Camera gene set enrichment analysis (camera function in R) was performed to assess significance of gene set changes under TGF-β and TGF-β + PORCN-i treatments.
Data Analysis
Extracting numbers of each cell type
The numbers of EdU+, stem, goblet, Paneth, and EE cells were quantified from respective cell type segmentation masks. The number of EdU+ stem cells was quantified from the combination of EdU+ and stem cell segmentations. The number of TA cells was quantified as #EdU+ cells minus #EdU+ stem cells. The number of EdU− cells were used to approximate the number of differentiated (#diff.) cells. The number of enterocytes was quantified as the number of cells with mean FABP1 intensity above the Youden index (EdU+ vs EdU− cells). The number of Ki67+ cells was quantified as the number of cells with mean Ki67 intensity above the Otsu threshold. The number of Ki67+ TA cells was quantified as #Ki67+ cells minus # Ki67+ stem cells. Due to limitations of conventional fluorescence microscopy, the number of secretory cells was quantified by combining goblet, Paneth, and EE cell numbers from two stain sets (Hoechst, EdU, Lgr5-GFP, Lyz; Hoechst, EdU, Muc2, ChgA).
Replicates and Error Estimation
In-plate replicate control wells (2–6 wells per plate) were used to estimate mean and error. For replicate plates, mean and error were pooled. For across stain-set readouts, error was propagated.
Fold Change
We calculated fold-change effects relative to in-plate controls for readouts within each stain set (#EdU+ stem cell, #TA cells). Fold-changes for readouts calculated across both stain sets (#goblet/#secretory, #Paneth/#secretory, #EE/#secretory) were calculated to a pooled control baseline measurement.
Statistical testing
To compare samples, two-sided Student’s t tests were used if equality of variance can be confirmed (Levene’s test). Otherwise, two-sided Welch’s t-tests were used.
Perturbation effect visualization
For Figure 2B, double perturbation phenotypes were sorted into similar phenotypes using hierarchical clustering (clustermap function in seaborn) with a euclidean distance metric. Single perturbation phenotypes were sorted based on the number of EdU+ stem cells in each row.
Distribution visualization
For Figures 5A and S1E, distributions were visualized as kernel density estimation plots.
Identifying perturbation interactions
Multiplicative model
Under a conventional multiplicative model (van Hasselt and Iyengar, 2019; Mani et al., 2008), perturbations that do not interact combine as the multiplicative (or log-additive) of the individual perturbations:
For our analysis, features with a count of 0 are assigned a pseudocount of 1.
Effect size
The deviation of each combinatorial perturbation from the prediction of the multiplicative model is quantified using effect size (Cohen’s d):
Where μobs and μpred are the observed and predicted means for the combination effect and σpooled is the pooled standard deviation from σobs and σpred.
Cell type correlations
Leave-one-out
Perturbations were dropped one at a time from the dataset (dropping all single and pairwise conditions containing the perturbation) and correlations were re-calculated for each data subset (Figures 4B, S4B).
Population growth model and variants
In our modeling of differentiated tissue from initial TA cell populations, we assumed: 1) stem cells give rise to TA cells, which are either secretory or absorptive progenitors; 2) the initial ratio of absorptive to secretory TA progenitors produced by stem cells is equal; and 3) the progenitors are locked into either secretory or absorptive fates after the initial commitment, an assumption supported by previous studies (van Es et al., 2012; Stamataki et al., 2011). Further, we did not consider the effects of dedifferentiation as we are focused on the initial 48 hour response to perturbation and dedifferentiation occurs over a longer period of time (Murata et al., 2020). The model describes the theoretical output of differentiated cells from populations of initial secretory or absorptive TA progenitors.
Control conditions
Under normal growth (control condition), the number of absorptive, A, and secretory, S, cells generated from an initial number of absorptive, A0, and secretory, S0, TA progenitors is given by:
Here, T is the total model time, set to be 48 hours. By assumption (2) above, A0= S0. Finally, τa and τs are the cell cycle lengths of absorptive and secretory progenitors, respectively. From past studies, absorptive progenitors are generally found to divide 4–5 times while secretory progenitors only divide 1–2 times (van Es et al., 2012; Potten, 1998; Stamataki et al., 2011). In line with these studies, we found from our lineage tracing experiments that absorptive progenitors divide around 4 times while secretory progenitors divide around 2 times. This corresponds to τa and τs values of around 12 and 24 hours in control conditions (Figure 5D–E). Progenitors that divide fewer times are not considered differentiated cells.
Cell cycle inhibition conditions
We next consider the effects of cell cycle inhibition. This can be connected to the exponential growth model in a number of ways (Table below). Transformations of parameters that relate these models are given in (Table below, column 4).
The model variants for incorporating cell cycle inhibition are defined as follows:
| Model | Absorptive | Secretory | Relation to Model 0 |
|---|---|---|---|
| 0 | - | ||
| 1 | |||
| 2 | |||
| 3 | Same as model 0, except cell cycle arrested TA cells differentiated | Same p | |
Model 0.
In this model, cell cycle inhibitor drugs change the probability p that progenitor cells continue to cell cycle (0 < p < 1 in the case of cell cycle inhibition conditions, or p = 1 in the control condition). Cell cycle arrested progenitors prematurely stop dividing (e.g. become quiescent or die) and do not contribute to the final differentiated lineages A or S.
In this stochastic implementation, the expected numbers of differentiated absorptive and secretory cells is determined by averaging over an ensemble of initial progenitor populations. The expectation follows from the observation that the expected number of direct progeny at each generation from a TA cell is 2p regardless of the generation. More explicitly, if we let Xi be the number of cells in generation i, then Xi+1 = 2pXi, and the expectation is given as E(Xi+1) = 2pE(Xi). Starting from a single initial progenitor, the expected number of progeny at time T is:
The final secretory to absorptive ratio in the differentiated population is given as:
Since f′(p) is always negative if τs > τa, inhibiting proliferation (increasing p) corresponds to an increase in secretory to absorptive ratio whenever secretory progenitors divide fewer times than absorptive progenitors.
We estimated the values of p for absorptive and secretory progenitors based on experimental data (Figures 5B–C). In the clonal lineage tracing experiment (A0 = S0 = 1), we quantified the average absorptive (Notch1) and secretory (Atoh1) clone size (E(A) = 13.31, E(S) = 3.50) under control (p = 1) to obtain number of divisions (, ). We additionally quantified the average clones sizes under cell cycle inhibition (E(A) = 4.23, E(S) = 2.71) to estimate p = 0.736 ± 0.0231 for absorptive progenitors and p = 0.868 ± 0.0658 for secretory progenitors (bootstrapped error). This parameter range is highlighted in Figures 5D–E.
Model 1.
In the first model variant, based on Lander et al. (2009), the cell cycle inhibitor drug deterministically affects the probability p1 of cell cycling. (0 < p1 < 1 in the case of cell cycle inhibition condition and 1 − p1 in the control condition.) This model can be related to the expectation of Model 0 through a change of parameters (Table above, column 4). Since the derivative of the transformation function is positive, the output of Model 1 shares the same sign of change as the output of Model 0.
Model 2.
In the second model variant, we consider the alternative mechanism that the cell cycle inhibitors lengthen the cell cycle duration. This deterministic model is parametrized by c, a cell cycle lengthening factor (c > 1 in the case of cell cycle inhibition conditions and c = 1 in the untreated condition). In this variant, we do not lose progenitors to quiescence and all progenitors are considered differentiated at the end of the experiment time T. Here, inhibiting proliferation (increasing c) also corresponds to an increase in secretory to absorptive ratio whenever secretory progenitors divide fewer times than absorptive progenitors.
Model 3.
In the third model variant, we consider the possibility that progenitor cells differentiate when they are cell cycle arrested. In the previous model variants, cell cycle arrested progenitor cells were not included in final counts as they were neither proliferative nor differentiated. Here, we modified the first stochastic model such that cell cycle arrested progenitor cells become differentiated cells of the same lineage, thus contributing to the final progeny size. The simulation output for this model variant produces the same trend as Model 0.
Taken together, these models consider three alternative mechanisms for cell cycle. All model behavior trends were consistent with the experimental observation.
qRT-PCR measurements
Test gene values were normalized to β-actin values. To quantify the Atoh1/Hes1 ratio, both Atoh1 and Hes1 fold-changes relative to control were calculated and then the Atoh1 fold-change was divided by the Hes1 fold-change.
Supplementary Material
Key Resources Table
| REAGENT or RESOURCE | SOURCE | IDENTIFIER |
|---|---|---|
| Antibodies | ||
| Goat polyclonal anti-GFP | Abcam | #5450 |
| Mouse monoclonal anti-Chromogranin A | Santa Cruz Biotechnology | #393941 |
| Mouse monoclonal anti-Erk1 (pT202/pY204) + Erk2 (pT185/pY187) | Abcam | #50011 |
| Rabbit monoclonal anti-Cyclin D1 | Life Technologies | #MA5–14512 |
| Rabbit polyclonal anti-DCAMKL1 | Abcam | #31704 |
| Rabbit polyclonal anti-Lysozyme C | Dako | #A0099 |
| Rabbit polyclonal anti-Mucin 2 | Santa Cruz Biotechnology | #15334 |
| Chemicals, Peptides, and Recombinant Proteins | ||
| Advanced DMEM/F-12 | Fisher Scientific | #12634–028 |
| AT9283 | Selleck Chemicals | #S1134 |
| B-27 Supplement (50X), serum free | Invitrogen | #17504–044 |
| Baricitinib (INCB028050) | Selleck Chemicals | #S2851 |
| BDP-FL azide | Lumiprobe | #11430 |
| DAPT | Stemgent | #04–0041 |
| CHIR-99021 | Sigma Aldrich | #SML1046 |
| Copper(II) Sulfate | VWR International | #470300–880 |
| EdU (5-ethynyl-2’-deoxyuridine) | Thermo Fisher | #A10044 |
| EGF Recombinant Mouse Protein | Invitrogen | #PMG8043 |
| Erlotinib HCl (OSI-744) | Selleck Chemicals | #S1023 |
| Flavopiridol HCl | Selleck Chemicals | #S2679 |
| GlutaMAX Supplement | Invitrogen | #35050–061 |
| HEPES (1M) | Invitrogen | #15630080 |
| Hoechst 33342 | Invitrogen | #H3570 |
| IWP-2 | Selleck Chemicals | #S7085 |
| LDN193189 hydrochloride | Sigma Aldrich | #SML0559 |
| N-2 Supplement (100X) | Fisher Scientific | #17502–048 |
| N-Acetyl-L-cysteine | Sigma Aldrich | #A9165 |
| P-7744 Palbociclib, Free Base, >99% | LC Laboratories | #−7744 |
| Palbociclib (PD-0332991) HCl | Selleck Chemicals | #S1116 |
| Penicillin-Streptomycin Solution | Corning | #30–002 |
| PD0325901 (Mirdametinib) | Selleck Chemicals | #S1036 |
| Recombinant Human BMP-4 Protein | R&D Systems | #314-BP-010 |
| Recombinant Human TGF-β1 (CHO derived) | PeproT ech | #100–21C |
| Recombinant Human Wnt-3a Protein | R&D Systems | #5036-WN-500 |
| Recombinant Murine IL-4 | PeproT ech | #214–14 |
| Recombinant Murine R-Spondin-1 | Peprotech | #315–32 |
| SB 202190 | Sigma Aldrich | #S7067 |
| Sodium L-ascorbate | Sigma Aldrich | #A4034 |
| Sulfo-Cyanine5 azide | Lumiprobe | #B3330 |
| Vactosertib (EW-7197) | Selleck Chemicals | #S7530 |
| Valproic acid sodium salt 98% | Sigma Aldrich | #P4543 |
| Y-27632 2HCl | Selleck Chemicals | #S1049 |
| Critical Commercial Assays | ||
| Human/Mouse/Rat BMP-2 Quantikine ELISA Kit | R&D Systems | #DBP200 |
| iScript Reverse Transcription kit | Bio-Rad | #1708841 |
| RNEasy Plus Mini Kit | Qiagen % | #74136 |
| SsoAdvanced Universal SYBR Green Supermix | Bio-Rad | #1725272 |
| QuantSeq 3’ mRNA-Seq Library Prep Kit FWD | Lexogen | #015.96 |
| Experimental Models: Organisms/Strains | ||
| Mouse: C57BL/6NHsd | Envigo | Envigo 044 |
| Mouse: Lgr5eGFP-UIK | de Sauvage Lab (Tian et al., 2011) | N/A |
| Mouse: SMAD3fl/fl | Alliston Lab, UCSF | N/A |
| Mouse: Villin-Cre | Klein Lab, UCSF | N/A |
| Mouse: Atoh1-CreER; R26R-tdTomato | Klein Lab, UCSF | N/A |
| Mouse: Notch1-CreER; R26R-tdTomato | Klein Lab, UCSF | N/A |
| Oligonucleotides | ||
| Primers for qRT-PCR, see qRT-PCR section in STAR Methods | This paper | N/A |
| Software and Algorithms | ||
| Image analysis software | This paper | https://github.com/AltschulerWu-Lab/MAGS |
| Quantifying percent confluency from brightfield | (Ramirez et al., 2016) | CellularRegionsFro mBrightField function in Supplementary Software 1 |
Highlights.
Survey of single and paired perturbation effects on enteroid cell-type composition
TGF-β enriches for enteroendocrine cells through SMAD signaling
IL-4 and EGFR signaling regulate TA cell numbers via mutual antagonism
Differential amplification of TA cells biases the secretory to absorptive cell ratio
Acknowledgments
We are grateful to Zev Gartner, Curtis Thorne, and members of the Altschuler-Wu lab for their feedback. We additionally thank Frederic de Sauvage for mouse resources. This work was supported by NIH GM112690 (S.J.A.), NCI-NIH R01 CA184984 (L.F.W.), the UCSF Program for Breakthrough Biomedical Research which is partly funded by the Sandler Foundation (L.F.W.), NIH R01-DK126376 (O.D.K.), NIH NRSA fellowship F32DK120102 (L.E.S.), and NSF GRFP fellowship 1650113 (I.W.C.).
Footnotes
Publisher's Disclaimer: This is a PDF file of an unedited manuscript that has been accepted for publication. As a service to our customers we are providing this early version of the manuscript. The manuscript will undergo copyediting, typesetting, and review of the resulting proof before it is published in its final form. Please note that during the production process errors may be discovered which could affect the content, and all legal disclaimers that apply to the journal pertain.
Declaration of interests
Authors declare no competing interests.
References
- Balázsi G, van Oudenaarden A, and Collins JJ (2011). Cellular decision making and biological noise: from microbes to mammals. Cell 144, 910–925. [DOI] [PMC free article] [PubMed] [Google Scholar]
- Basak O, Beumer J, Wiebrands K, Seno H, van Oudenaarden A, and Clevers H (2017). Induced Quiescence of Lgr5+ Stem Cells in Intestinal Organoids Enables Differentiation of Hormone-Producing Enteroendocrine Cells. Cell Stem Cell 20, 177–190.e4. [DOI] [PubMed] [Google Scholar]
- Batlle E, Henderson JT, Beghtel H, van den Born MMW, Sancho E, Huls G, Meeldijk J, Robertson J, van de Wetering M, Pawson T, et al. (2002). Beta-catenin and TCF mediate cell positioning in the intestinal epithelium by controlling the expression of EphB/ephrinB. Cell 111, 251–263. [DOI] [PubMed] [Google Scholar]
- Beumer J, and Clevers H (2016). Regulation and plasticity of intestinal stem cells during homeostasis and regeneration. Development 143, 3639–3649. [DOI] [PubMed] [Google Scholar]
- Beumer J, and Clevers H (2020). Cell fate specification and differentiation in the adult mammalian intestine. Nat. Rev. Mol. Cell Biol [DOI] [PubMed] [Google Scholar]
- Birchenough GMH, Nyström EEL, Johansson MEV, and Hansson GC (2016). A sentinel goblet cell guards the colonic crypt by triggering Nlrp6-dependent Muc2 secretion. Science 352, 1535–1542. [DOI] [PMC free article] [PubMed] [Google Scholar]
- Bjerknes M, and Cheng H (1999). Clonal analysis of mouse intestinal epithelial progenitors. Gastroenterology 116, 7–14. [DOI] [PubMed] [Google Scholar]
- Cheng H, and Leblond CP (1974a). Origin, differentiation and renewal of the four main epithelial cell types in the mouse small intestine. V. Unitarian Theory of the origin of the four epithelial cell types. Am. J. Anat 141, 537–561. [DOI] [PubMed] [Google Scholar]
- Cheng H, and Leblond CP (1974b). Origin, differentiation and renewal of the four main epithelial cell types in the mouse small intestine. I. Columnar cell. Am. J. Anat 141, 461–479. [DOI] [PubMed] [Google Scholar]
- Clevers H (2013). The intestinal crypt, a prototype stem cell compartment. Cell 154, 274–284. [DOI] [PubMed] [Google Scholar]
- Dames P, Bergann T, Fromm A, Bücker R, Barmeyer C, Krug SM, Fromm M, and Schulzke J-D (2015). Interleukin-13 affects the epithelial sodium channel in the intestine by coordinated modulation of STAT6 and p38 MAPK activity. J. Physiol 593, 5269–5282. [DOI] [PMC free article] [PubMed] [Google Scholar]
- van Es JH, Jay P, Gregorieff A, van Gijn ME, Jonkheer S, Hatzis P, Thiele A, van den Born M, Begthel H, Brabletz T, et al. (2005). Wnt signalling induces maturation of Paneth cells in intestinal crypts. Nat. Cell Biol 7, 381–386. [DOI] [PubMed] [Google Scholar]
- van Es JH, Sato T, van de Wetering M, Lyubimova A, Nee ANY, Gregorieff A, Sasaki N, Zeinstra L, van den Born M, Korving J, et al. (2012). Dll1+ secretory progenitor cells revert to stem cells upon crypt damage. Nat. Cell Biol 14, 1099–1104. [DOI] [PMC free article] [PubMed] [Google Scholar]
- Farin HF, Jordens I, Mosa MH, Basak O, Korving J, Tauriello DVF, de Punder K, Angers S, Peters PJ, Maurice MM, et al. (2016). Visualization of a short-range Wnt gradient in the intestinal stem-cell niche. Nature 530, 340–343. [DOI] [PubMed] [Google Scholar]
- Feng X-H, and Derynck R (2005). Specificity and versatility in tgf-beta signaling through Smads. Annu. Rev. Cell Dev. Biol 21, 659–693. [DOI] [PubMed] [Google Scholar]
- Flentjar N, Chu P-Y, Ng AY-N, Johnstone CN, Heath JK, Ernst M, Hertzog PJ, and Pritchard MA (2007). TGF-betaRII rescues development of small intestinal epithelial cells in Elf3-deficient mice. Gastroenterology 132, 1410–1419. [DOI] [PubMed] [Google Scholar]
- van der Flier LG, and Clevers H (2009). Stem cells, self-renewal, and differentiation in the intestinal epithelium. Annu. Rev. Physiol 71, 241–260. [DOI] [PubMed] [Google Scholar]
- van der Flier LG, Haegebarth A, Stange DE, van de Wetering M, and Clevers H (2009). OLFM4 is a robust marker for stem cells in human intestine and marks a subset of colorectal cancer cells. Gastroenterology 137, 15–17. [DOI] [PubMed] [Google Scholar]
- Haber AL, Biton M, Rogel N, Herbst RH, Shekhar K, Smillie C, Burgin G, Delorey TM, Howitt MR, Katz Y, et al. (2017). A single-cell survey of the small intestinal epithelium. Nature 551, 333–339. [DOI] [PMC free article] [PubMed] [Google Scholar]
- Hahn S, Nam MO, Noh JH, Lee DH, Han HW, Kim DH, Hahm KB, Hong SP, Yoo JH, and Yoo J (2017). Organoid-Based Epithelial to Mesenchymal Transition (OEMT) Model: From an Intestinal Fibrosis Perspective. Scientific Reports 7, 2435. [DOI] [PMC free article] [PubMed] [Google Scholar]
- Han L, Diehl A, Nguyen NK, Korangath P, Teo W, Cho S, Kominsky S, Huso DL, Feigenbaum L, Rein A, et al. (2014). The Notch pathway inhibits TGFβ signaling in breast cancer through HEYL-mediated crosstalk. Cancer Res. 74, 6509–6518. [DOI] [PMC free article] [PubMed] [Google Scholar]
- van Hasselt JGC, and Iyengar R (2019). Systems Pharmacology: Defining the Interactions of Drug Combinations. Annu. Rev. Pharmacol. Toxicol 59, 21–40. [DOI] [PubMed] [Google Scholar]
- He XC, Zhang J, Tong W-G, Tawfik O, Ross J, Scoville DH, Tian Q, Zeng X, He X, Wiedemann LM, et al. (2004). BMP signaling inhibits intestinal stem cell self-renewal through suppression of Wnt-beta-catenin signaling. Nat. Genet 36, 1117–1121. [DOI] [PubMed] [Google Scholar]
- Hong SP, Song S, Cho SW, Lee S, Koh BI, Bae H, Kim KH, Park J-S, Do H-S, Im I, et al. (2017). Generation of PDGFRα Cardioblasts from Pluripotent Stem Cells. Sci. Rep 7, 41840. [DOI] [PMC free article] [PubMed] [Google Scholar]
- Houde M, Laprise P, Jean D, Blais M, Asselin C, and Rivard N (2001a). Intestinal Epithelial Cell Differentiation Involves Activation of p38 Mitogen-activated Protein Kinase That Regulates the Homeobox Transcription Factor CDX2. J. Biol. Chem 276, 21885–21894. [DOI] [PubMed] [Google Scholar]
- Koch S, and Nusrat A (2012). The Life and Death of Epithelia During Inflammation: Lessons Learned from the Gut. Annu. Rev. Pathol. Mech. Dis 7, 35–60. [DOI] [PubMed] [Google Scholar]
- Lander AD, Gokoffski KK, Wan FYM, Nie Q, and Calof AL (2009). Cell lineages and the logic of proliferative control. PLoS Biol. 7, e15. [DOI] [PMC free article] [PubMed] [Google Scholar]
- Li Y, Liu Y, Liu B, Wang J, Wei S, Qi Z, Wang S, Fu W, and Chen Y-G (2018). A growth factor-free culture system underscores the coordination between Wnt and BMP signaling in Lgr5 intestinal stem cell maintenance. Cell Discov 4, 49. [DOI] [PMC free article] [PubMed] [Google Scholar]
- Lukonin I, Serra D, Meylan LC, Volkmann K, Baaten J, Zhao R, Meeusen S, Colman K, Maurer F, Stadler M, et al. (2020) Phenotypic landscape of intestinal organoid regeneration. Nature 586, 275–280. [DOI] [PMC free article] [PubMed] [Google Scholar]
- Mani R, St Onge RP, Hartman JL 4th, Giaever G, and Roth FP (2008). Defining genetic interaction. Proc. Natl. Acad. Sci. U. S. A 105, 3461–3466. [DOI] [PMC free article] [PubMed] [Google Scholar]
- Massagué J (1998). TGF-beta signal transduction. Annu. Rev. Biochem 67, 753–791. [DOI] [PubMed] [Google Scholar]
- von Moltke J, Ji M, Liang H-E, and Locksley RM (2015). Tuft-cell-derived IL-25 regulates an intestinal ILC2–epithelial response circuit. Nature 529, 221–225. [DOI] [PMC free article] [PubMed] [Google Scholar]
- Murata K, Jadhav U, Madha S, van Es J, Dean J, Cavazza A, Wucherpfennig K, Michor F, Clevers H, and Shivdasani RA (2020). Ascl2-Dependent Cell Dedifferentiation Drives Regeneration of Ablated Intestinal Stem Cells. Cell Stem Cell 26, 377–390.e6. [DOI] [PMC free article] [PubMed] [Google Scholar]
- Potten CS (1998). Stem cells in gastrointestinal epithelium: numbers, characteristics and death. Philos. Trans. R. Soc. Lond. B Biol. Sci 353, 821–830. [DOI] [PMC free article] [PubMed] [Google Scholar]
- Qi Z, Li Y, Zhao B, Xu C, Liu Y, Li H, Zhang B, Wang X, Yang X, Xie W, et al. (2017). BMP restricts stemness of intestinal Lgr5 stem cells by directly suppressing their signature genes. Nat. Commun 8, 13824. [DOI] [PMC free article] [PubMed] [Google Scholar]
- Ramirez M, Rajaram S, Steininger RJ, Osipchuk D, Roth MA, Morinishi LS, Evans L, Ji W, Hsu C-H, Thurley K, et al. (2016). Diverse drug-resistance mechanisms can emerge from drug-tolerant cancer persister cells. Nat. Commun 7, 10690. [DOI] [PMC free article] [PubMed] [Google Scholar]
- Richmond CA, Rickner H, Shah MS, Ediger T, Deary L, Zhou F, Tovaglieri A, Carlone DL, and Breault DT (2018). JAK/STAT-1 Signaling Is Required for Reserve Intestinal Stem Cell Activation during Intestinal Regeneration Following Acute Inflammation. Stem Cell Reports 10, 17–26. [DOI] [PMC free article] [PubMed] [Google Scholar]
- Rodríguez-Colman MJ, Schewe M, Meerlo M, Stigter E, Gerrits J, Pras-Raves M, Sacchetti A, Hornsveld M, Oost KC, Snippert HJ, et al. (2017). Interplay between metabolic identities in the intestinal crypt supports stem cell function. Nature 543, 424–427. [DOI] [PubMed] [Google Scholar]
- Salic A, and Mitchison TJ (2008). A chemical method for fast and sensitive detection of DNA synthesis in vivo. Proceedings of the National Academy of Sciences 105, 2415–2420. [DOI] [PMC free article] [PubMed] [Google Scholar]
- Sanman LE, Chen IW, Bieber JM, Thorne CA, Wu LF, and Altschuler SJ (2020). Generation and Quantitative Imaging of Enteroid Monolayers. Methods Mol. Biol 2171, 99–113. [DOI] [PubMed] [Google Scholar]
- Sato T, Vries RG, Snippert HJ, van de Wetering M, Barker N, Stange DE, van Es JH, Abo A, Kujala P, Peters PJ, et al. (2009). Single Lgr5 stem cells build crypt-villus structures in vitro without a mesenchymal niche. Nature 459, 262–265. [DOI] [PubMed] [Google Scholar]
- Sato T, Stange DE, Ferrante M, Vries RGJ, Van Es JH, Van den Brink S, Van Houdt WJ, Pronk A, Van Gorp J, Siersema PD, et al. (2011). Long-term expansion of epithelial organoids from human colon, adenoma, adenocarcinoma, and Barrett’s epithelium. Gastroenterology 141, 1762–1772. [DOI] [PubMed] [Google Scholar]
- Stamataki D, Holder M, Hodgetts C, Jeffery R, Nye E, Spencer-Dene B, Winton DJ, and Lewis J (2011). Delta1 expression, cell cycle exit, and commitment to a specific secretory fate coincide within a few hours in the mouse intestinal stem cell system. PLoS One 6, e24484. [DOI] [PMC free article] [PubMed] [Google Scholar]
- Thorne CA, Chen IW, Sanman LE, Cobb MH, Wu LF, and Altschuler SJ (2018). Enteroid Monolayers Reveal an Autonomous WNT and BMP Circuit Controlling Intestinal Epithelial Growth and Organization. Dev. Cell 44, 624–633.e4. [DOI] [PMC free article] [PubMed] [Google Scholar]
- Tian A, Benchabane H, Wang Z, and Ahmed Y (2016). Regulation of Stem Cell Proliferation and Cell Fate Specification by Wingless/Wnt Signaling Gradients Enriched at Adult Intestinal Compartment Boundaries. PLoS Genet. 12, e1005822. [DOI] [PMC free article] [PubMed] [Google Scholar]
- Tian H, Biehs B, Warming S, Leong KG, Rangell L, Klein OD, and de Sauvage FJ (2011). A reserve stem cell population in small intestine renders Lgr5-positive cells dispensable. Nature 478, 255–259. [DOI] [PMC free article] [PubMed] [Google Scholar]
- VanDussen KL, Carulli AJ, Keeley TM, Patel SR, Puthoff BJ, Magness ST, Tran IT, Maillard I, Siebel C, Kolterud Å, et al. (2012). Notch signaling modulates proliferation and differentiation of intestinal crypt base columnar stem cells. Development 139, 488–497. [DOI] [PMC free article] [PubMed] [Google Scholar]
- Yilmaz H, Katajisto P, Lamming DW, Gu Y, Birsoy K, Dursun A, Yilmaz VO, Selig M, Nielsen GP, Mino-kenudson M, Zukerberg LR, Bhan AK, Deshpande V and Sabatini DM (2012). mTORC1 in the Paneth cell niche couples intestinal stem-cell function to calorie intake. Nature 486, 490–495. [DOI] [PMC free article] [PubMed] [Google Scholar]
- Yin X, Farin HF, van Es JH, Clevers H, Langer R, and Karp JM (2014). Niche-independent high-purity cultures of Lgr5+ intestinal stem cells and their progeny. Nat. Methods 11, 106–112. [DOI] [PMC free article] [PubMed] [Google Scholar]
- Zhan T, Ambrosi G, Wandmacher AM, Rauscher B, Betge J, Rindtorff N, Häussler RS, Hinsenkamp I, Bamberg L, Hessling B, et al. (2019). MEK inhibitors activate Wnt signalling and induce stem cell plasticity in colorectal cancer. Nat. Commun 10, 2197. [DOI] [PMC free article] [PubMed] [Google Scholar]
- Zhang YE (2009). Non-Smad pathways in TGF-β signaling. Cell Research 19, 128–139. [DOI] [PMC free article] [PubMed] [Google Scholar]
Associated Data
This section collects any data citations, data availability statements, or supplementary materials included in this article.
Supplementary Materials
Data Availability Statement
The published article includes all datasets generated or analyzed during this study. The code (image analysis software) generated during this study are available at Github (https://github.com/AltschulerWu-Lab/MAGS).