

Abstract
It has been independently demonstrated by us1 and Liang et al.2 that naked mole-rat (NMR) cells are more resistant to SV40LT and H-RasV12-induced transformation than mouse cells. In the accompanying comment, Hadi et al. argued that NMR cells and mouse cells are equally susceptible to oncogenic transformation by SV40LT and H-RasV12. However, their observations are based on much higher expression levels of H-RasV12 than in our study1 and Liang et al.’s study2. Our new RNA-seq data shows that NMR cells are strikingly more resistant to transcriptomic changes induced by oncogenic Ras than mouse, blind mole-rat, and human cells, revealing suppressed Ras signaling as an anti-cancer mechanism in NMR cells. Furthermore, we found that high expression of H-RasV12 abolished this mechanism and rendered NMR cells susceptible to oncogenic transformation. Our results explain that the ostensibly equal susceptibility of NMR and mouse cells to transformation observed by Hadi et al. was resulted from high levels of H-RasV12 overriding anti-cancer mechanisms of the naked mole rat.
The key difference between our1 and Hadi et al.’s tumorigenesis experiments was the strength of the promoters used to drive oncogenic Ras expression. Here, we clarify that in our original publication1, mouse and NMR stable cell lines used for tumour xenograft experiments (Fig. 4b)1 were generated by sequentially integrating a NotI-linearized pBabe-puro-largeTcDNA plasmid (Addgene plasmid # 14088) followed by puromycin selection and a NotI-linearized pWZL-hygro-H-RasV12 plasmid (Addgene plasmid # 18749) followed by hygromycin selection. Both SV40LT and H-RasV12 in these plasmids are driven by a retroviral LTR promoter, the same promoter that was used by Liang et al.2 and numerous other tumorigenesis studies3–6. The pSG5-largeT and pCMV-RasV12 plasmids cited by Hadi et al. were used for anchorage-independent soft agar growth assays only1, and no stable cell lines were generated with them.
In contrast, Hadi et al. used much stronger CMV, SV40, PGK, and EF1α promoters which drove much higher expression of H-RasV12 (Extended Fig. 2e of Hadi et al.). This prompted us to investigate whether differential levels of oncogene expression explain the discrepancy of observations by Hadi et al.
We performed RNA sequencing (RNA-seq) on the mouse and NMR stable cell lines generated in our original study1. Human and blind mole-rat (BMR) stable cell lines were also included to test whether NMR cells have a unique response to oncogenes compared to other long-lived species. All transgenes used to generate stable cell lines were driven by LTR promoters (see Methods). The tumorigenicity of the cell lines from each species1,7 is summarized in Extended Data Fig. 1a. Similar numbers of genes were detected in all samples from RNA-seq analysis (Extended Data Table 1). Ortholog identification revealed that 13,276 orthologs were shared by all four species, the expression of which was used for further analysis.
Principal Component Analysis (PCA) showed that the segregation patterns induced by oncogenes were different across the four species (Extended Data Fig. 1b–e). Notably, in NMR cells, separation of samples in PCA plots was primarily driven by LT (NMR-L), but not by H-RasV12 (NMR-L-R) (Extended Data Fig. 1d), indicating that NMR cells are refractory to the transcriptomic changes induced by H-RasV12. Furthermore, the number of LT and H-RasV12-induced DEGs was similar in mouse, BMR, and human cells, but was much lower in NMR cells (Fig. 1a). Consistently, multiple gene ontology (GO) terms that were significantly changed by LT and H-RasV12 in mouse cells, such as cell cycle, cell division, mitotic nuclear division etc., were not altered or altered to a much lesser extent in NMR cells (Extended Data Fig. 2a).
Fig. 1. Differential response of naked mole-rat cells to H-RasV12.
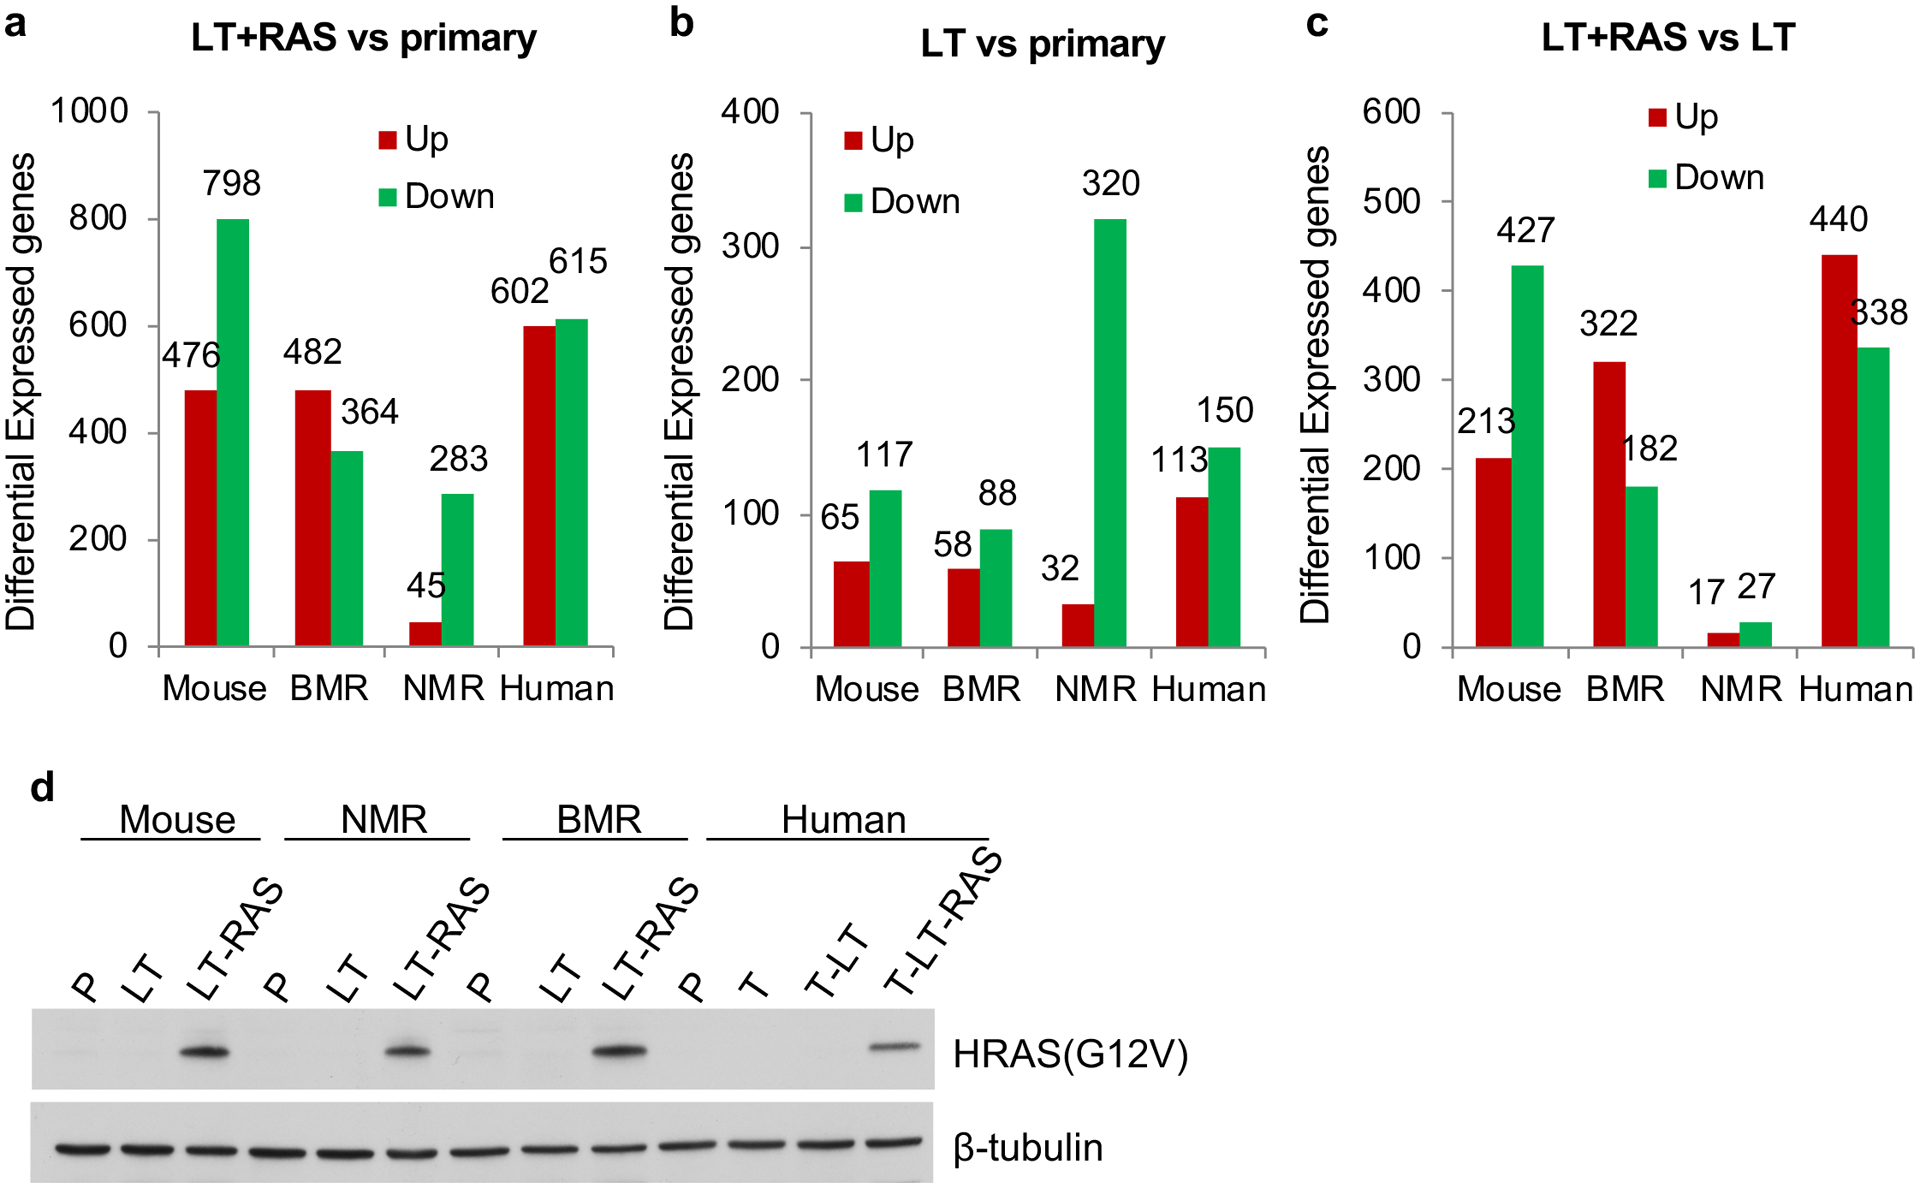
a, The number of differentially expressed genes (DEGs) induced by the combination of Large T (LT) and H-RasV12 (Ras) across species. b, The number of DEGs induced by LT. c, The number of DEGs induced by H-RasV12. d, Western blot of the stable cell lines used for RNA-seq. P, primary cells; LT, Large T; L-R, Large T and H-RasV12; T, hTERT.
We next dissected the effect of LT and H-RasV12 on transcriptomic changes separately. Interestingly, LT induced more DEGs in NMR cells than in the other three species (Fig. 1b and Extended Data Fig. 2b). However, H-RasV12 induced much fewer DEGs (Fig. 1c) and fewer changes in GO terms (Extended Data Fig. 2c) in the NMR cells, supporting a refractory response of NMR cells to H-RasV12 as seen in the PCA analysis. The levels of H-RasV12 expression were similar across species (Fig. 1d), excluding the possibility that the refractory response of NMR cells to H-RasV12 was due to differential H-RasV12 expression.
It was previously demonstrated that the expression level of H-RasV12 determines human cell transformation8. We next asked if a high level of H-RasV12 expression in NMR cells could lead to transformation and explain the discrepancy of observations. H-RasV12 driven by a CAG promoter was stably integrated into NMR-L cells, generating NMR (LT)LTR+(RAS)CAG cells (see Methods). The generated cell lines expressed a much higher level of H-RasV12 than the LTR-driven NMR-L-R cells (Fig. 2a). We next tested the tumorigenicity of the stable cell lines. The tumour incidence of NMR (LT+RAS)LTR cells was relatively low (~29%, 4 tumours formed out of 14 xenografts, Fig. 2b) compared to M (LT+RAS)LTR cells (100%, 6 tumours formed out of 6 xenografts), confirming our original observation that NMR cells are more resistant to oncogenic transformation than mouse cells1. However, NMR cells with higher expression of H-RasV12 driven by the CAG promoter (NMR (LT)LTR+(RAS)CAG) formed tumours 100% of the time (18 tumours formed out of 18 xenografts) and displayed significantly reduced tumour latency (Fig. 2b, 2c). Tumorigenicity of NMR (LT+RAS)LTR cells could also be increased by a high expression of SV40 small T (ST) driven by a CAG promoter as in NMR (LT+RAS)LTR+STCAG cells (~75%, 9 tumours formed out of 12 xenografts), but not by a lower expression of ST driven by a LTR promoter as in NMR (LT+RAS+ST)LTR cells (Fig. 2b, 2c). NMR cells expressing LT and ST (NMR (LT+ST)CAG) failed to form tumours (Fig. 2b, 2c). The combination of LT, ST, TERT, and H-RasV12 driven by CAG promoters efficiently transformed human skin fibroblasts (Fig. 2b, 2c), confirming previous publications3,4,9.
Fig. 2. H-RasV12 expression levels determine oncogenic transformation in NMR cells.
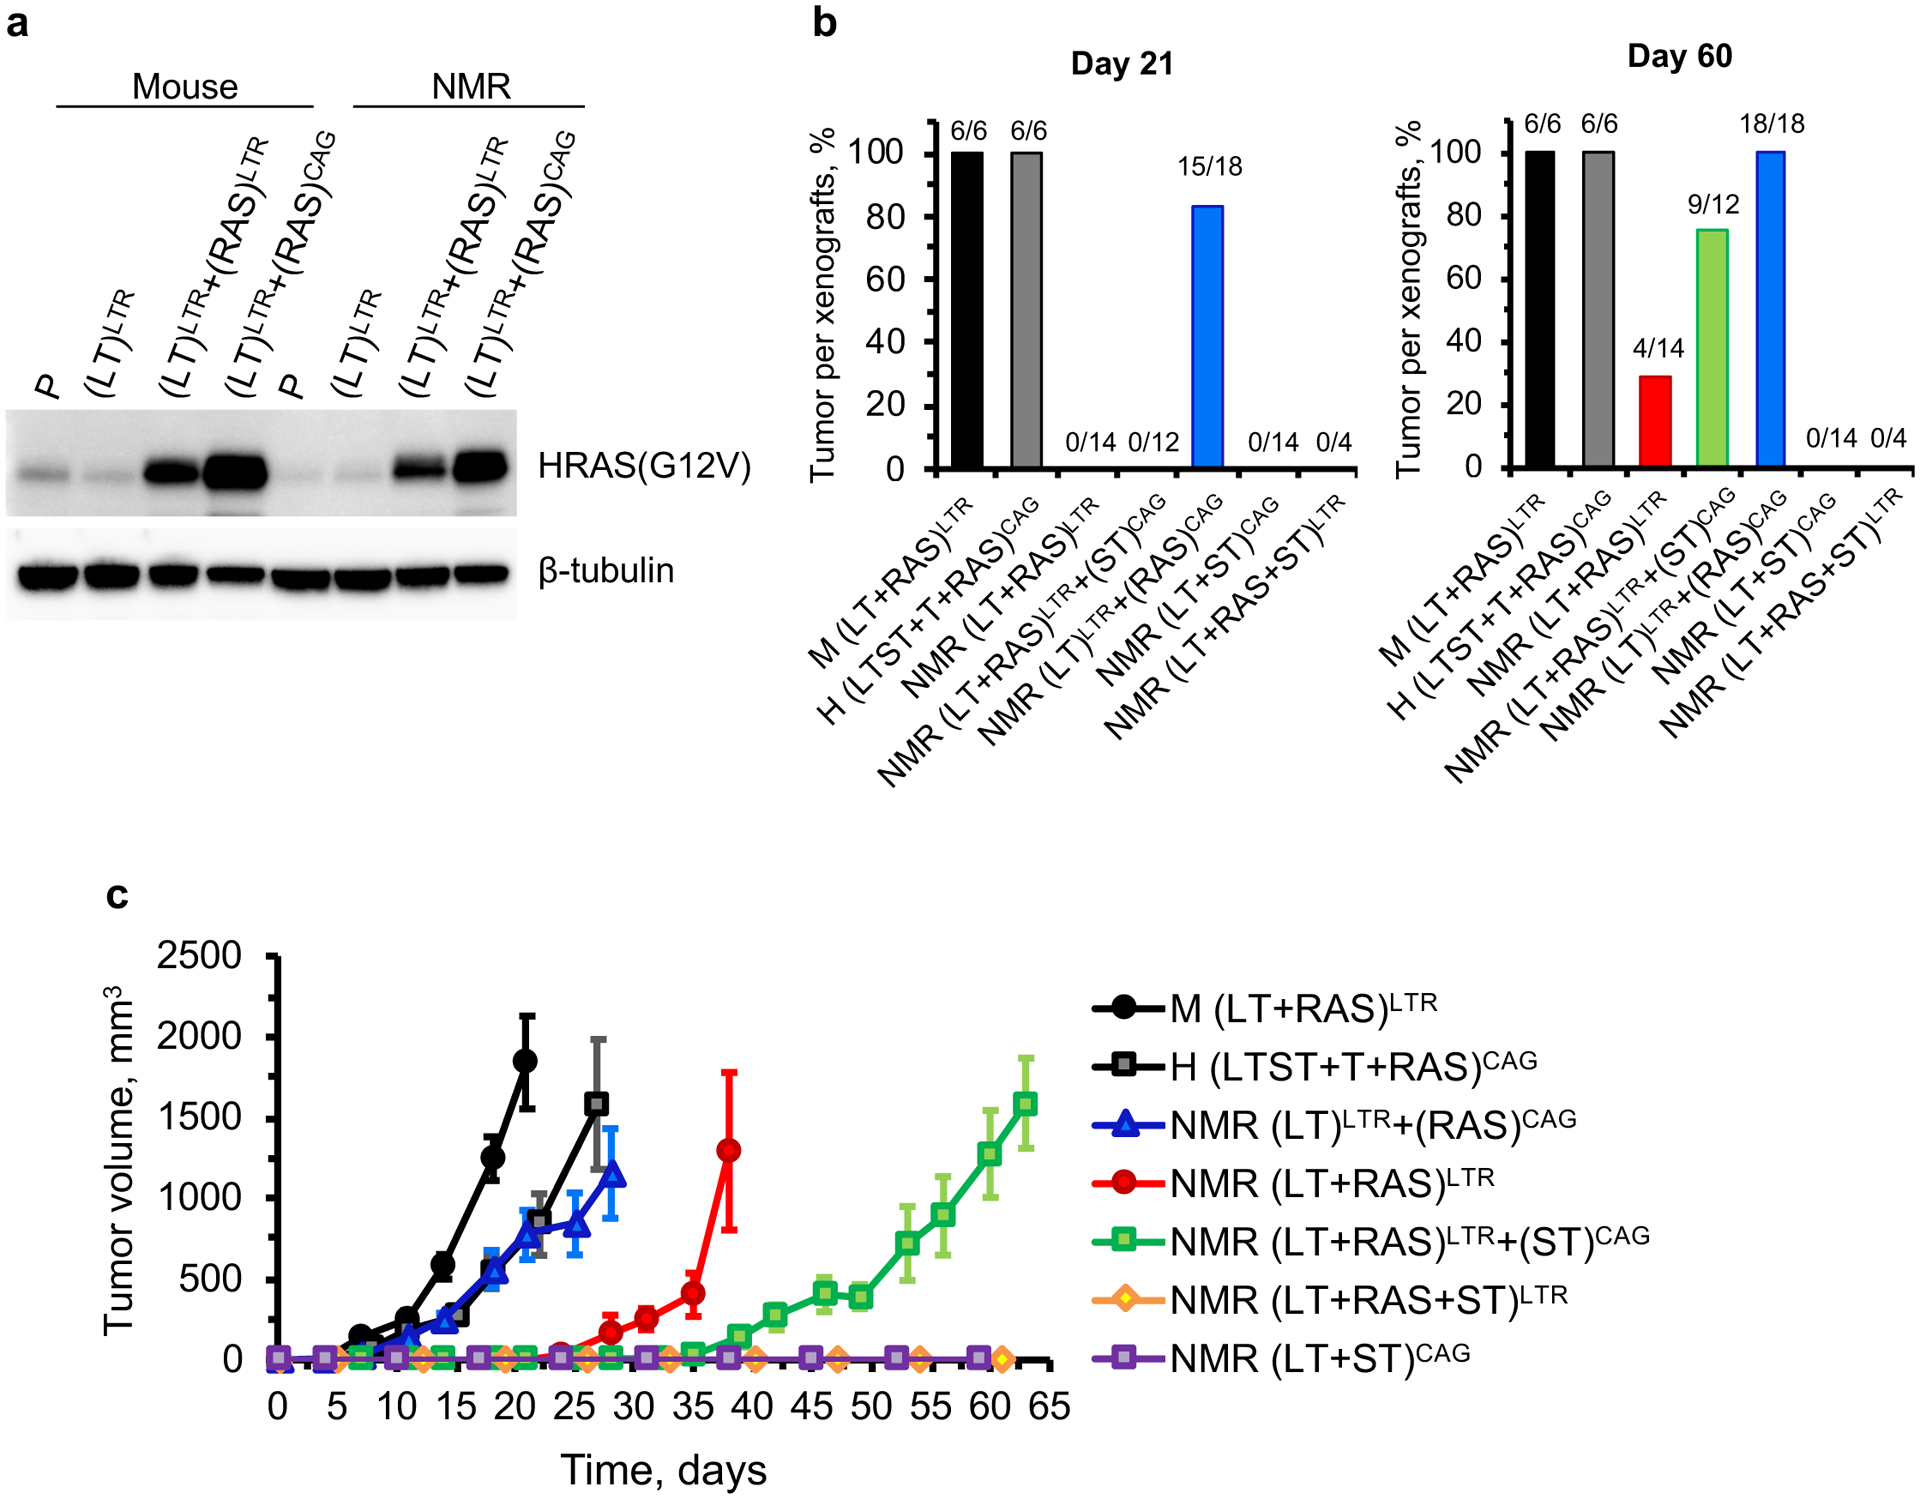
a, Western blot analysis of mouse and NMR cells expressing low and high levels of H-RasV12. b, Summary of tumour formation in xenografts of mouse, human, and NMR cells expressing oncoproteins under the control of different promotors. LTR is a moderate promoter that has been commonly used to transform mouse and human cells (see Methods). CAG is a strong promoter. The fraction values indicate number of tumours formed out of number of injections. c, Growth curves of tumours formed by the transformed cells. The error bars indicate SEM.
To decipher the molecular mechanisms underlying differential response to high and moderate levels of H-RasV12 expression in NMR cells, we thoroughly analyzed the Ras effector pathways including ERK and AKT and identified inherently dampened PI3K/AKT signaling downstream of Ras (see bioRxiv preprint10). Furthermore, the AKT activity was derepressed by high expression of H-RasV1210. These results indicate that dampened PI3K/AKT signaling is an evolutionary adaption to resist oncogenic transformation in NMR cells. The PI3K/AKT signaling pathway has also been recognized to regulate longevity. In C. elegans and Drosophila, abolishing PI3K/AKT signaling significantly extends lifespan11,12. In mice, partial inactivation of PI3K or AKT enhances metabolic function and extends lifespan13,14. Therefore, the natural suppression of the PI3K/AKT pathway in NMR likely contributes not only to cancer resistance, but also to a long lifespan.
Hadi et al. also observed a lower clonogenic efficiency and longer tumour latency using the stable NMR cells (NMR (LT+RAS)LTR) that we provided to them. Both the low frequency and long latency of tumour formation from the NMR (LT+RAS)LTR cells suggest that additional genetic changes may have accumulated in a small fraction of the cell population during passaging after introduction of LT and H-RasV12, which overcame tumour suppressing mechanisms of NMR cells such as the suppressed Ras signaling pathway and the hyaluronan barrier. Hadi et al.’s results using our transformed cells support our conclusion that NMR cells are more resistant to transformation than mouse cells, but this difference could only be revealed with a moderate level of oncogene expression. Very high levels of oncogenic Ras expression are unlikely to be physiologically relevant8. The naturally dampened Ras signaling pathway in NMR makes the Ras expression level particularly critical for cross-species comparison, as artificially high Ras expression overrides the natural cancer-resistance mechanism in NMR.
Methods
Animals.
C57BL/6 mice were purchased from the Jackson Laboratory. The naked mole rats and the blind mole rats were from the University of Rochester colonies. NIH-III nude mice (Crl:NIH-Lystbg-JFoxn1nuBtkxid) were purchased from Charles River Laboratories. All animal experiments were approved and performed in accordance with the guidelines set up by the University of Rochester Committee on Animal Resources.
Cell extraction and culture.
Primary fibroblasts from mice, naked mole rats, and blind mole rats were isolated from underarm skin samples. The mouse samples were from a C57BL/6 mouse. The naked mole-rat and the blind mole-rat skin samples were from the University of Rochester colonies. The human skin fibroblasts were a gift from Pereira-Smith lab at University of Texas Health Science Center at San Antonio. Mouse, human, and blind mole-rat cells were cultured at 37°C with 5% CO2 and 3% O2. Naked mole rat cells were cultured at 32 °C (body temperature of naked mole rats) with 5% CO2 and 3% O2. All cells were cultured in EMEM medium (ATCC) supplemented with 15% (vol/vol) fetal bovine serum (Gibco) and 1× penicillin-streptomycin (Corning).
Transfections.
Cells were plated at 5×10⁵ cells per 10 cm plate 2 days before transfection, except for naked mole rat cells which were seeded at 2×10⁵ cells per plate 5 days before transfection. Cells were harvested, resuspended in NHDF transfection solution (Amaxa) and transfected with corresponding plasmid DNA using Amaxa Nucleofector II on program U-20.
Plasmids and stable cell line generation.
Mouse and naked mole-rat primary and transformed cells used for RNA sequencing were previously published1. To generate the stable cell lines, NotI-linearized pBabe-puro-largeTcDNA plasmid (Addgene plasmid # 14088) was transfected into mouse and naked mole-rat skin fibroblasts and selected with puromycin for 2–4 weeks (mouse cells took ~2 weeks, and naked mole-rat cells took ~4 weeks) to generate stable clones. After selection, stable clones were pooled to minimize the clonal variations. Pooled clones were expanded before being transfected with NotI-linearized pWZL-hygro H-RasV12 plasmid (Addgene plasmid # 18749) and selected with hygromycin for 2–4 weeks to generate stable clone. On average, 50–100 stable clones formed from each plate after selection. The expression of each protein was confirmed by western blotting. Blind mole-rat cells used for RNA sequencing were generated using the same method. Human cells used for RNA sequencing were first integrated with NotI-linearized pBABE-neo-hTERT plasmid (Addgene plasmid # 1774) and selected with G418. The generated HCA2-hTERT cells were integrated with LT and H-RasV12 using the same method described above. For each antibiotic selection, an untransfected control was included to ensure complete death of the un-transfected cells. The oncogenes were all driven by retroviral LTR promoter.
To generate cell lines for xenograft experiments, two different techniques were used. The LTR-driven plasmids expressing LT (Addgene plasmid # 14088), H-Ras V12 (Addgene plasmid # 18749), and ST (Addgene plasmid # 8583) were integrated into cells using the same transfection and selection method described above. NotI-linearized pBABE-zeo small T integration was selected using Zeocin. The CAG-driven oncogenes were integrated into the cells using piggyBac (pPB) expression vectors described previously7. Basically, to generate H (LTST+T+RAS)CAG cells, HCA2 was first co-transfected with pPB-puro-LTST and piggyBac transposase (PBase) plasmids and selected with puromycin. Stable clones were pooled and co-transfected with pPB-neo-hTERT and PBase plasmids and selected with G418. The generated stable clones were pooled and then co-transfected with pPB-hyg-H RasV12 and PBase plasmids and selected with hygromycin. To generate NMR (LT)LTR+(RAS)CAG cells, the NMR (LT)LTR cells generated using pBABE plasmid (Addgene plasmid # 14088) described above were co-transfected with pPB-hyg-H-RasV12 and PBase plasmids and selected with hygromycin. To generate NMR (LT+RAS)LTR+(ST)CAG cells, NMR (LT+RAS)LTR described above was co-transfected with pPB-zeo-ST and PBase plasmids and selected with Zeocin. To generate NMR (LT+ST)CAG cells, NMRSF was first co-transfected with pPB-puro-LT and PBase, and selected with puromycin. The generated stable clones were co-transfected with pPB-zeo-ST and PBase and selected with Zeocin. Extensive passages were avoided to prevent clonal expansion.
Xenograft assay and tumour measurement.
Xenograft experiments were performed according to our previously published procedure1 with minor modifications. Basically, two- to three-month-old female NIH-III nude mice (Crl:NIH-Lystbg-JFoxn1nuBtkxid) were used to establish xenografts. Cells were re-suspended to a dilution of 2 × 10⁶ cells in 100 μl ice-cold 50% matrigel (Corning) in PBS. 100 μl of cell suspension was injected subcutaneously into the flank using a 22-gauge needle after general anesthesia. The mice were monitored and the size of tumours was measured using a caliper twice a week. When the length of the tumours reached 20 mm, the mice were euthanized. If no tumours grew, the mice were euthanized after two months. The volume of the tumours was calculated by the following formula: Tumour volume (mm3) = D × d × d /2, where D and d are the longest and shortest diameter of the tumours in mm.
Antibodies.
The following antibodies were used in this study: H-Ras V12 (ab140962, Abcam), β-tubulin (ab6046, Abcam).
RNA extraction and sequencing.
Total RNA was extracted from cultured cells using Qiagen RNeasy mini kit and treated with DNase I (DNA-free, Ambion). Oligo (dT) was used to isolate mRNA. All samples were mixed with the fragmentation buffer. The mRNAs were fragmented and 1 μg was used for cDNA synthesis (iScript, Bio-Red) in 20 μl reaction using the mRNA fragments as templates. Short fragments were purified and dissolved with EB buffer for end preparation and single nucleotide A (adenine) addition. After that, the short fragments were connected with adapters. The suitable fragments are selected for the PCR amplification. During the quality assessment steps, Agilent 2100 Bioanaylzer and ABI StepOnePlus Real-Time PCR System (Applied Biosystems) were used in quantification and qualification of the sample libraries. The RNAseq libraries were prepared with Illumina’s TruSeq RNA sample Prep kit according to the manufacturer’s protocols. Next, the libraries were taken for sequencing using Illumina HiSeq 4000.
Data filtering and processing.
After acquiring the sequencing data, Paired End reads (PE) were filtered to trim adapters and low-quality reads using SOAPnuke V1.5. We obtained a total number of 729,359,058 pairs of clean reads. After that, Human, mouse, NMR, and BMR RNA-Seq reads were first mapped to their respective reference genomes using HISAT2 and calculated FPKM values with Cufflinks. In total, 15426, 16073, 15833, and 15249 genes were expressed in mouse, human, naked mole-rat and blind mole-rat, respectively.
Orthologs identification.
To identify human, mouse, BMR, and NMR orthologous genes, we compared the RNA-seq data between species, and used mouse genes as the reference. First, we aligned mouse gene sequences against genes of other three species. Next, we identified orthologs between mouse and each species according to gene identities. Finally, we merged the three outputs into one final table. In total, 13276 orthologs were shared by all four species.
Gene differential expression analysis.
We conducted a cross-species differential expression gene analysis (DEG) using DESeq2, which takes replicates as one group. The thresholds for significance are fold change ≥ 2 and adjusted p-value ≤ 0.01. We did comparisons of L_R VS P, L VS P, and L_R VS L for each species, in which P means primary cells; L means LT-expressing cells; and L_R means LT and Ras-expressing cells. We also compared same processed samples between each two species. We classified GO and KEGG annotations of DEGs according to official classification and performed GO and pathway functional enrichment using topGO and phyper, both of which are functions from R. GO annotation and enrichment analysis was performed using an online-based software, DAVID.
Extended Data
Extended Data Table 1.
Statistics of sequencing data and expressed genes of all samples
| Sample | Number of Reads | Number of base | Number of genes |
|---|---|---|---|
| BMR-1 | 34943168 | 5241475200 | 12816 |
| BMR-2 | 34237168 | 5135575200 | 12913 |
| BMR-3 | 34763768 | 5214565200 | 12783 |
| BMR-L-1 | 33980456 | 5097068400 | 12983 |
| BMR-L-2 | 34715316 | 5207297400 | 13185 |
| BMR-L-3 | 33697198 | 5054579700 | 13113 |
| BMR-L-R-1 | 34896340 | 5234451000 | 13370 |
| BMR-L-R-2 | 33554738 | 5033210700 | 13352 |
| BMR-L-R-3 | 35027026 | 5254053900 | 13428 |
| HCA2–1 | 34428058 | 5164208700 | 13549 |
| HCA2–2 | 34559592 | 5183938800 | 13533 |
| HCA2–3 | 34311928 | 5146789200 | 13570 |
| HCA2-T-1 | 34369286 | 5155392900 | 13537 |
| HCA2-T-2 | 34482134 | 5172320100 | 13531 |
| HCA2-T-3 | 34939600 | 5240940000 | 13546 |
| HCA2-T-LT-1 | 34654506 | 5198175900 | 13580 |
| HCA2-T-LT-2 | 34653804 | 5198070600 | 13517 |
| HCA2-T-LT-3 | 35401832 | 5310274800 | 13594 |
| HCA2-T-LT-RAS-1 | 34482018 | 5172302700 | 13755 |
| HCA2-T-LT-RAS-2 | 34917538 | 5237630700 | 13780 |
| HCA2-T-LT-RAS-3 | 35351198 | 5302679700 | 13771 |
| M-1 | 34856638 | 5228495700 | 13364 |
| M-2 | 33703474 | 5055521100 | 13165 |
| M-3 | 34872236 | 5230835400 | 13376 |
| M-L-1 | 34876306 | 5231445900 | 13423 |
| M-L-2 | 33989634 | 5098445100 | 13457 |
| M-L-3 | 34168260 | 5125239000 | 13452 |
| M-L-R-1 | 34267706 | 5140155900 | 13229 |
| M-L-R-2 | 33990568 | 5098585200 | 13355 |
| M-L-R-3 | 34491972 | 5173795800 | 13195 |
| NMR-1 | 34807890 | 5221183500 | 13144 |
| NMR-2 | 34095594 | 5114339100 | 13148 |
| NMR-3 | 34153410 | 5123011500 | 13339 |
| NMR-L-1 | 35874752 | 5381212800 | 13343 |
| NMR-L-2 | 36027014 | 5404052100 | 13436 |
| NMR-L-3 | 35718470 | 5357770500 | 13410 |
| NMR-L-R-1 | 35318112 | 5297716800 | 13443 |
| NMR-L-R-2 | 35524056 | 5328608400 | 13510 |
| NMR-L-R-3 | 34950234 | 5242535100 | 13508 |
Extended Data Fig. 1. Tumorigenicity of the cell lines and Principal Component Analysis (PCA) of the RNA-seq datasets.
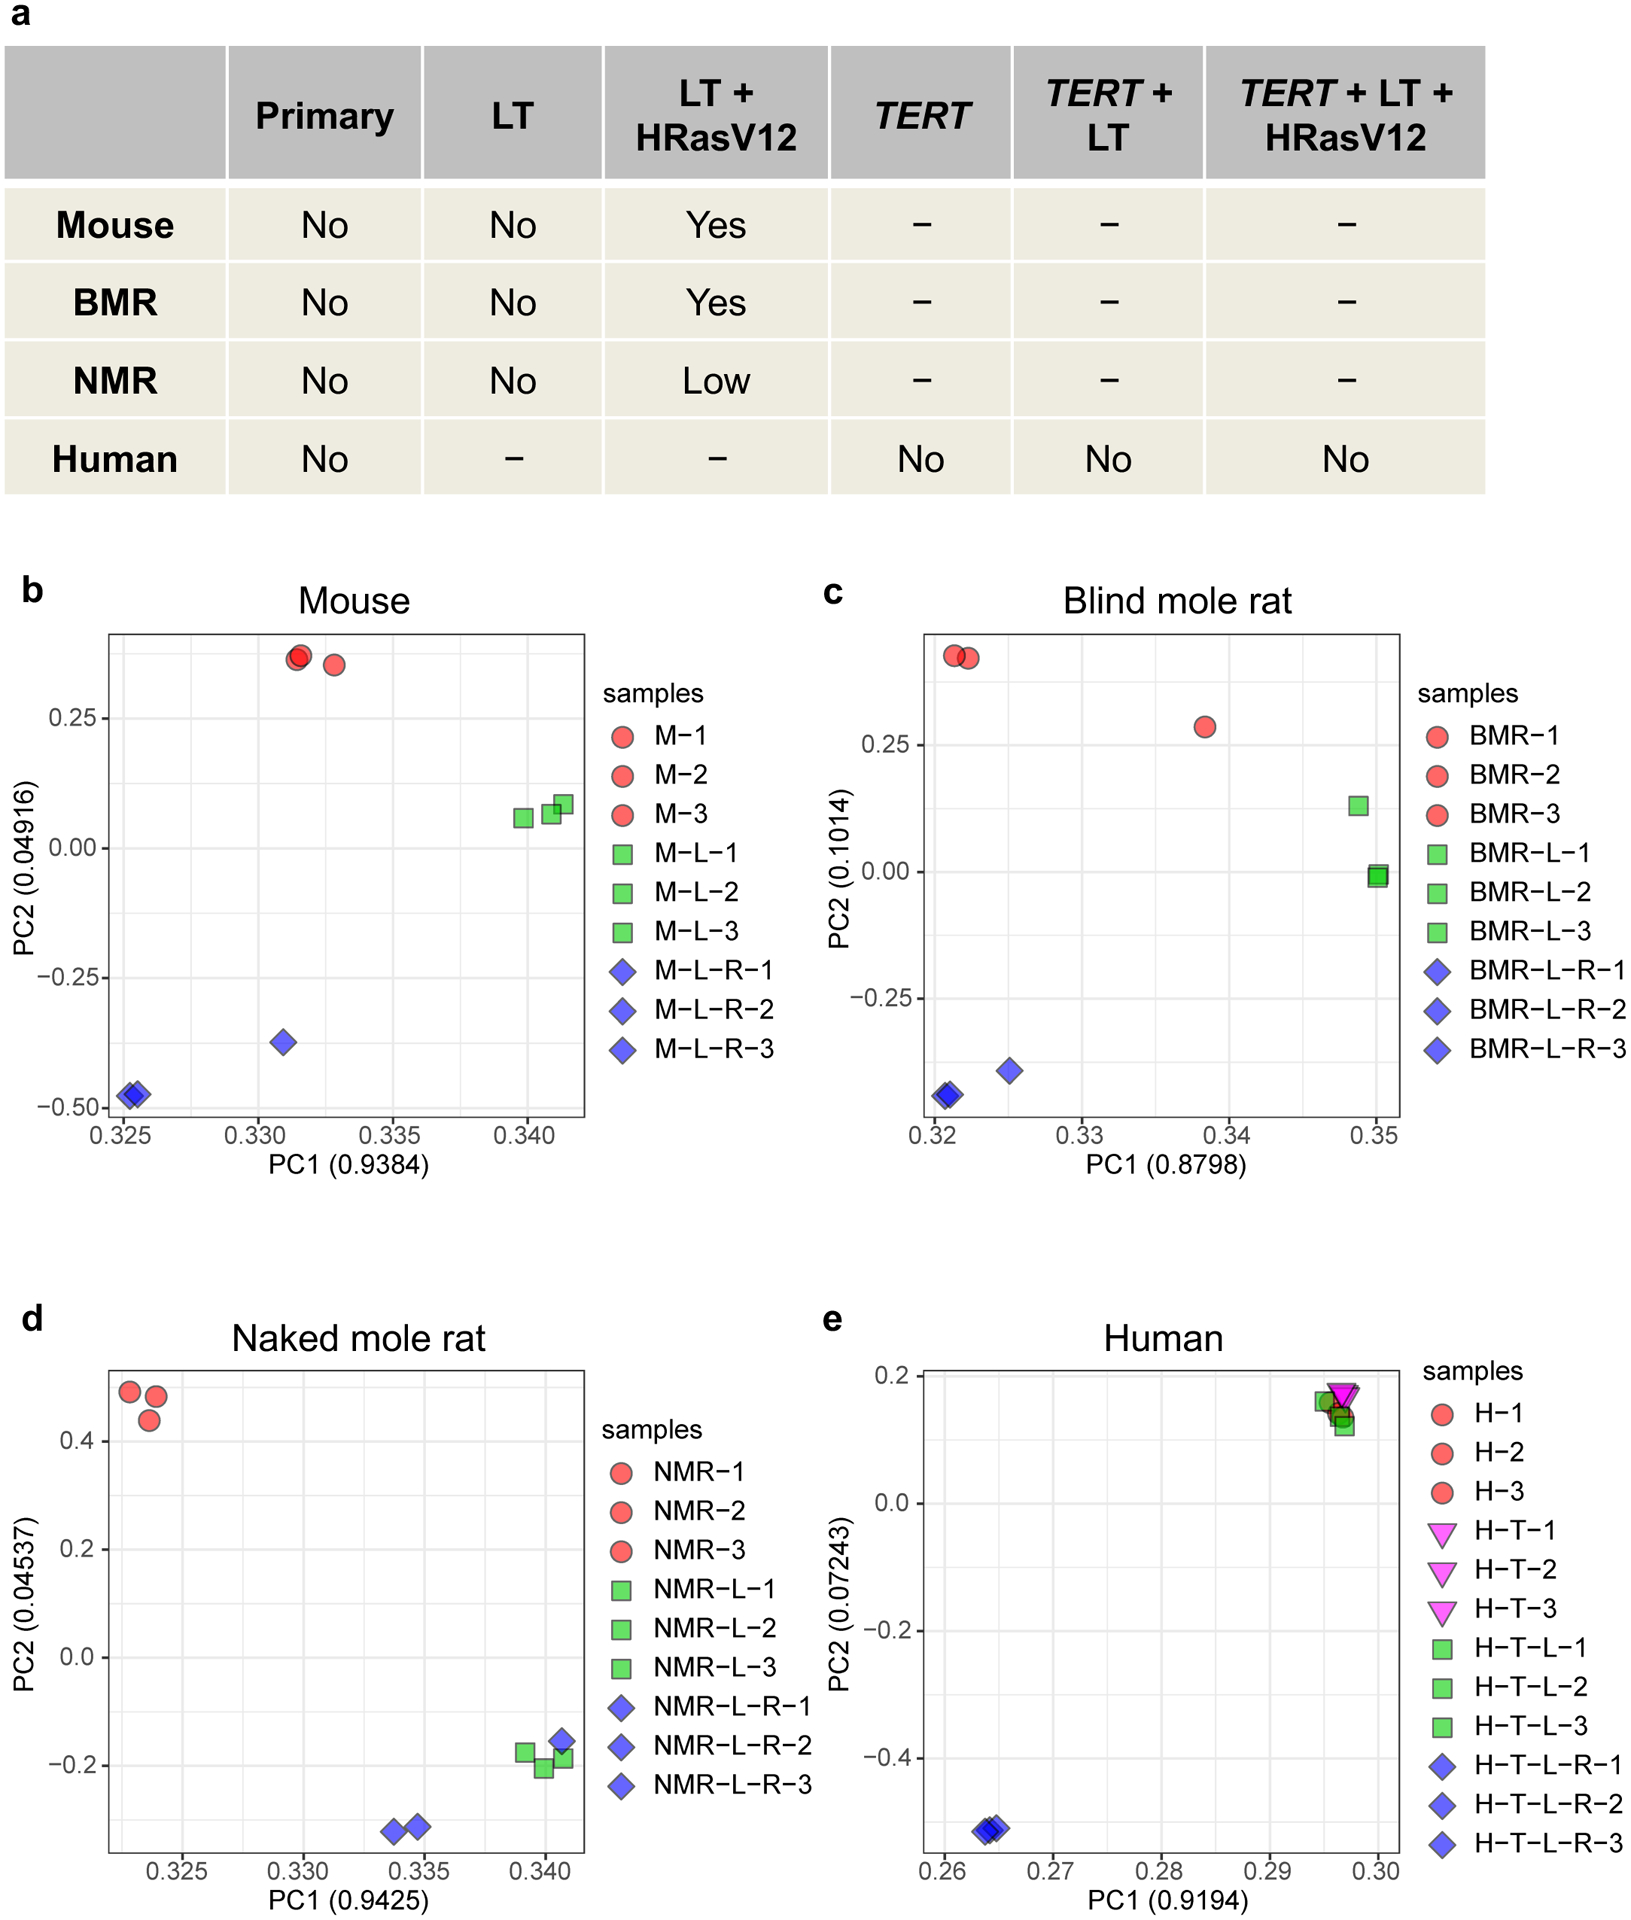
a, Tumorigenicity of the cell lines. LT, SV40 large T antigen. “-” indicates that such cells were not analyzed in this study. All transforming genes were driven by retroviral LTR promoter. b-e, PCA of the RNA-seq datasets. PCA was done using the expression of 13,276 orthologous genes across all four species. The first two Principal Components of each analysis were extracted. Values in parenthesis indicate the variance explained by each of the PCs.
Extended Data Fig. 2. Enrichment analysis of DEGs in the transformed cells across species.
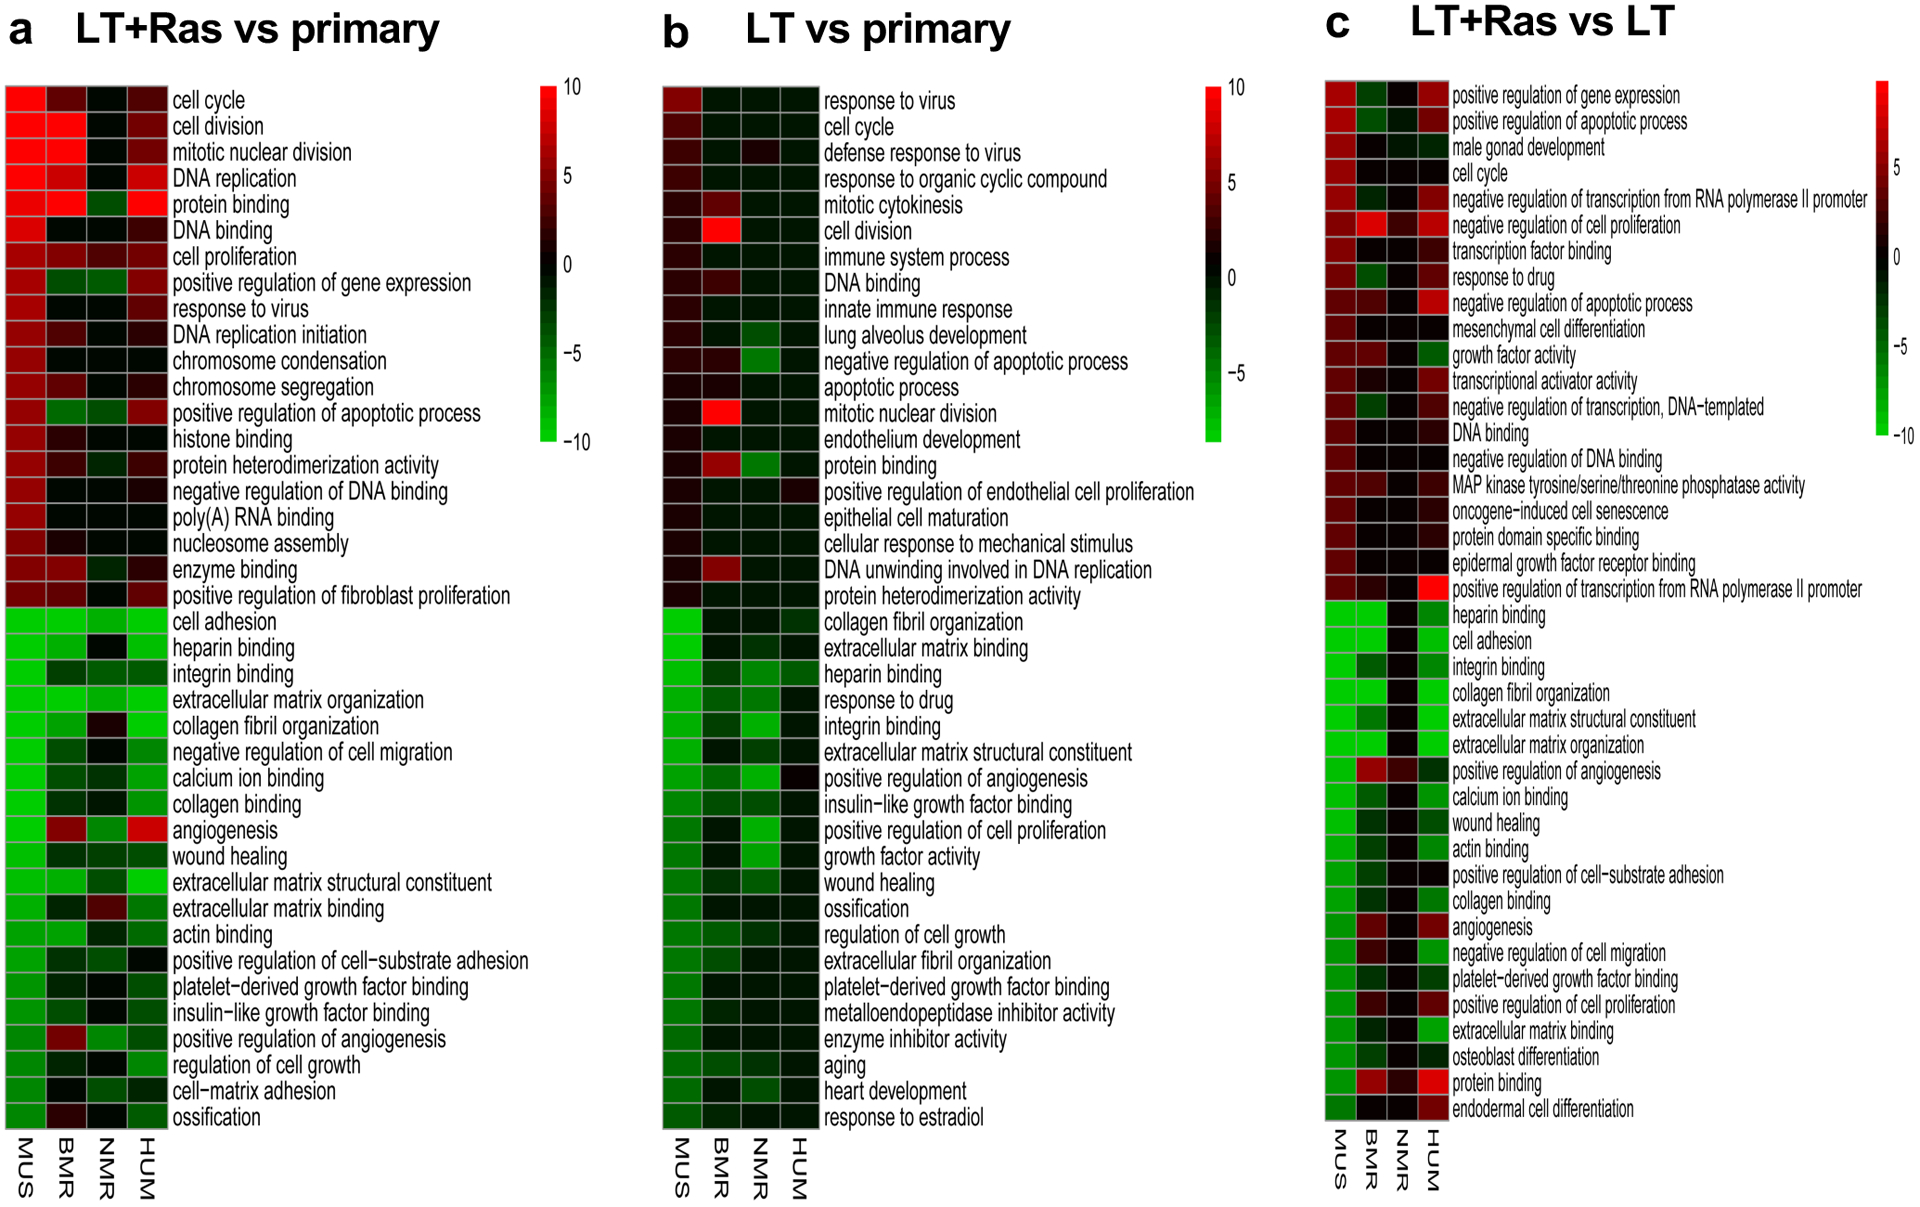
a, GO enrichment analysis of the DEGs derived from Fig. 1a. b, GO enrichment analysis of the DEGs derived from Fig. 1b. c, GO enrichment analysis of the DEGs derived from Fig. 1c. Biological Process (BP) and Molecular Function (MF) terms were shown. All GO terms in a-c are arranged in the order of decreased significance in the mouse cells. The top 20 significantly upregulated (red) and downregulated (green) terms are shown.
Supplementary Material
Acknowledgments
This study is supported by the US National Institutes of Health grant AG047200 to VG and AS, and the Natural Science Foundation of China 81672818, Science Technology and Innovation Committee of Shenzhen Municipality under grant No. JCYJ20160331190123578 and Guangzhou science and technology program key project 201604020005 to XF.
Footnotes
Competing interests
The authors declare no competing interests.
References
- 1.Tian X et al. High-molecular-mass hyaluronan mediates the cancer resistance of the naked mole rat. Nature 499, 346–349, doi: 10.1038/nature12234 (2013). [DOI] [PMC free article] [PubMed] [Google Scholar]
- 2.Liang S, Mele J, Wu Y, Buffenstein R & Hornsby PJ Resistance to experimental tumorigenesis in cells of a long-lived mammal, the naked mole-rat (Heterocephalus glaber). Aging Cell 9, 626–635, doi: 10.1111/j.1474-9726.2010.00588.x (2010). [DOI] [PMC free article] [PubMed] [Google Scholar]
- 3.Hahn WC et al. Enumeration of the simian virus 40 early region elements necessary for human cell transformation. Mol Cell Biol 22, 2111–2123 (2002). [DOI] [PMC free article] [PubMed] [Google Scholar]
- 4.Rangarajan A, Hong SJ, Gifford A & Weinberg RA Species- and cell type-specific requirements for cellular transformation. Cancer cell 6, 171–183 (2004). [DOI] [PubMed] [Google Scholar]
- 5.Zhao JJ et al. Human mammary epithelial cell transformation through the activation of phosphatidylinositol 3-kinase. Cancer cell 3, 483–495 (2003). [DOI] [PubMed] [Google Scholar]
- 6.Serrano M, Lin AW, McCurrach ME, Beach D & Lowe SW Oncogenic ras provokes premature cell senescence associated with accumulation of p53 and p16INK4a. Cell 88, 593–602, doi: 10.1016/s0092-8674(00)81902-9 (1997). [DOI] [PubMed] [Google Scholar]
- 7.Tian X et al. Evolution of telomere maintenance and tumour suppressor mechanisms across mammals. Philosophical transactions of the Royal Society of London. Series B, Biological sciences 373, doi: 10.1098/rstb.2016.0443 (2018). [DOI] [PMC free article] [PubMed] [Google Scholar]
- 8.Elenbaas B et al. Human breast cancer cells generated by oncogenic transformation of primary mammary epithelial cells. Genes Dev 15, 50–65 (2001). [DOI] [PMC free article] [PubMed] [Google Scholar]
- 9.Hahn WC et al. Creation of human tumour cells with defined genetic elements. Nature 400, 464–468, doi: 10.1038/22780 (1999). [DOI] [PubMed] [Google Scholar]
- 10.Zhao J et al. Dampened PI3K/AKT signaling contributes to cancer resistance of the naked mole rat. bioRxiv, 2020.2002.2027.967729, doi: 10.1101/2020.02.27.967729 (2020). [DOI] [Google Scholar]
- 11.Ayyadevara S, Alla R, Thaden JJ & Shmookler Reis RJ Remarkable longevity and stress resistance of nematode PI3K-null mutants. Aging Cell 7, 13–22, doi: 10.1111/j.1474-9726.2007.00348.x (2008). [DOI] [PubMed] [Google Scholar]
- 12.Moskalev AA & Shaposhnikov MV Pharmacological inhibition of phosphoinositide 3 and TOR kinases improves survival of Drosophila melanogaster. Rejuvenation research 13, 246–247, doi: 10.1089/rej.2009.0903 (2010). [DOI] [PubMed] [Google Scholar]
- 13.Nojima A et al. Haploinsufficiency of akt1 prolongs the lifespan of mice. PloS one 8, e69178, doi: 10.1371/journal.pone.0069178 (2013). [DOI] [PMC free article] [PubMed] [Google Scholar]
- 14.Foukas LC et al. Long-term p110alpha PI3K inactivation exerts a beneficial effect on metabolism. EMBO molecular medicine 5, 563–571, doi: 10.1002/emmm.201201953 (2013). [DOI] [PMC free article] [PubMed] [Google Scholar]
Associated Data
This section collects any data citations, data availability statements, or supplementary materials included in this article.