Abstract
Electronic stethoscopes offer several advantages over conventional acoustic stethoscopes, including noise reduction, increased amplification, and ability to store and transmit sounds. However, the acoustical characteristics of electronic and acoustic stethoscopes can differ significantly, introducing a barrier for clinicians to transition to electronic stethoscopes. This work proposes a method to process lung sounds recorded by an electronic stethoscope, such that the sounds are perceived to have been captured by an acoustic stethoscope. The proposed method calculates an electronic-to-acoustic stethoscope filter by measuring the difference between the average frequency responses of an acoustic and an electronic stethoscope to multiple lung sounds. To validate the method, a change detection experiment was conducted with 51 medical professionals to compare filtered electronic, unfiltered electronic, and acoustic stethoscope lung sounds. Participants were asked to detect when transitions occurred in sounds comprising several sections of the three types of recordings. Transitions between the filtered electronic and acoustic stethoscope sections were detected, on average, by chance (sensitivity index equal to zero) and also detected significantly less than transitions between the unfiltered electronic and acoustic stethoscope sections (p < 0.01), demonstrating the effectiveness of the method to filter electronic stethoscopes to mimic an acoustic stethoscope. This processing could incentivize clinicians to adopt electronic stethoscopes by providing a means to shift between the sound characteristics of acoustic and electronic stethoscopes in a single device, allowing for a faster transition to new technology and greater appreciation for the electronic sound quality.
Index Terms—: Electronic stethoscope, acoustic stethoscope, stethoscope filtering, listening experiment, frequency response
I. Introduction
The stethoscope was first introduced in the early 1800’s by Laennec as a means of observing sounds from a patient’s body without making physical contact [1]. In contrast to the original design of a long, hollow wooden tube, acoustic stethoscopes now use a chest piece to capture acoustic energy from the body and transmit the sound through flexible tubing to the listener’s ears. The stethoscope is currently amid another period of modernization with many electronic stethoscope models becoming available [2]. Using a transducer, the electronic stethoscope converts acoustic energy into an electrical signal that can be further amplified, filtered, and processed. This process of digitization in the electronic stethoscope improves on the acoustic stethoscope’s low sound levels and susceptibility to external noise [3]. The electronic stethoscope has several other advantages compared to the acoustic stethoscope, including volume adjustment, noise cancellation, automated diagnosis, remote auscultation, unencumbered movement, and less dependence on ear piece positions [4], [5]. Researchers are also exploring new designs for long-term auscultating, including patch [6]–[8] and vest [9] implementations, but these technologies are in the early stages of development and not used in practice by physicians.
The effectiveness of acoustic and electronic stethoscopes is dependent on the user’s capacity to accurately identify sounds associated with disease [10]. The exception is for newer electronic stethoscopes with capabilities to provide computer-aided diagnoses [11], [12]. Because the stethoscope’s efficacy is largely dependent on clinicians’ hearing and judgment, the listening experience is highly personal and difficult to standardize. In order to lessen the subjectivity of auscultation, there are trends towards adopting artificial intelligence in stethoscopes [13], improving teaching methods and databases [14], and using the stethoscope in conjunction with other tools, such as handheld ultrasound [15]. While some have argued less subjective instruments will replace the stethoscope [16], it still remains one of the most simple, easily available, and cost-effective tools to quickly assess the health of the heart, lungs, bones, and intestinal tract [3], [17].
Besides the variability in the listening experiences of individual clinicians, the acoustical characteristics of stethoscopes can also vary widely [18], [19]. Due to differences in materials, tubing, and components, each stethoscope possesses its own response that determines how specific frequency ranges, which are linked to the pathological state of the organ being monitored, will be transmitted [19]. Stethoscope responses have been approximated in a number of previous studies for acoustic [20], [21], electronic [22], and acoustic and electronic stethoscopes [18], [23]. Responses are generally measured by placing the stethoscope on a simulator designed to mimic the characteristics of the human body and exciting the simulator with noise or sine sweeps. Other studies have focused on the objective differences in the frequency responses of stethoscopes when auscultating on a real patient [19]. To our knowledge, there are no studies that include an objective analysis of the perceptual differences between stethoscope models.
As clinicians are typically trained with an acoustic stethoscope, they become accustomed to the frequency response of acoustic stethoscopes [24]. Despite the advantages of electronic stethoscopes, their use is still limited in medical practices [25]. One barrier to electronic stethoscope adoption is the change in sound quality [26], [27]. Currently available electronic stethoscopes implement selective filters to address differences in sound quality [2], [19]. It was shown that the frequency responses of electronic stethoscopes with bell and diaphragm filters are not consistent with acoustic stethoscopes [19]. These band-pass filters on electronic stethoscopes remove high or low frequency components from the signal to emulate an acoustic stethoscope’s bell and diaphragm. While the filter characteristics of electronic stethoscope models vary, bell and diaphragm modes typically include frequencies below 200 Hz and between 100 and 500 Hz, respectively. Simply using a bandpass filter may not take into account acoustical differences between acoustic and electronic stethoscopes related to the transducer type, sound transmission path, and mechanical coupling with the patient.
The aim of this study is to propose and validate an electronic stethoscope filtering method that increases the perceived similarity of lung sounds from filtered electronic and acoustic stethoscopes. While it may seem counterproductive to use processing to render an electronic stethoscope more similar to an acoustic stethoscope, rather than just continuing to use an acoustic stethoscope, the electronic stethoscope affords a number of distinct advantages, as mentioned previously. It is anticipated that, in time, the electronic stethoscope will become increasingly more commonplace and the filtering methodology will be important to slowly aid physicians in transitioning to electronic stethoscopes.
First, the paper presents a method to calculate an electronic-to-acoustic stethoscope filter using band equalization for a specific acoustic-electronic stethoscope pair. Second, a listening experiment with medical professionals across experience levels is used to evaluate how well filtered electronic stethoscope sounds mimic acoustic stethoscope sounds. To our knowledge, this is the first study that focuses on an objective analysis of the perceptual differences between stethoscopes, rather than quantitative results based on response data. The details of the filter calculation and listening experiment are presented in sections II and III, respectively. Sections IV and V conclude the study, summarizing findings and future directions.
II. Methods
Lung sounds were played from a simulator that mimics the characteristics of the human body and were recorded from acoustic and electronic stethoscopes. The magnitude spectra of ten recorded lung sounds were averaged for both the electronic and acoustic stethoscopes. An electronic-to-acoustic stethoscope filter was calculated as the difference between the average magnitude spectra of the electronic and acoustic stethoscopes for the ten lung sounds. The remaining electronic stethoscope lung sounds were processed with the electronic-to-acoustic stethoscope filter and included in a listener experiment. The processing steps discussed in this section are summarized in Fig. 1.
Fig. 1:
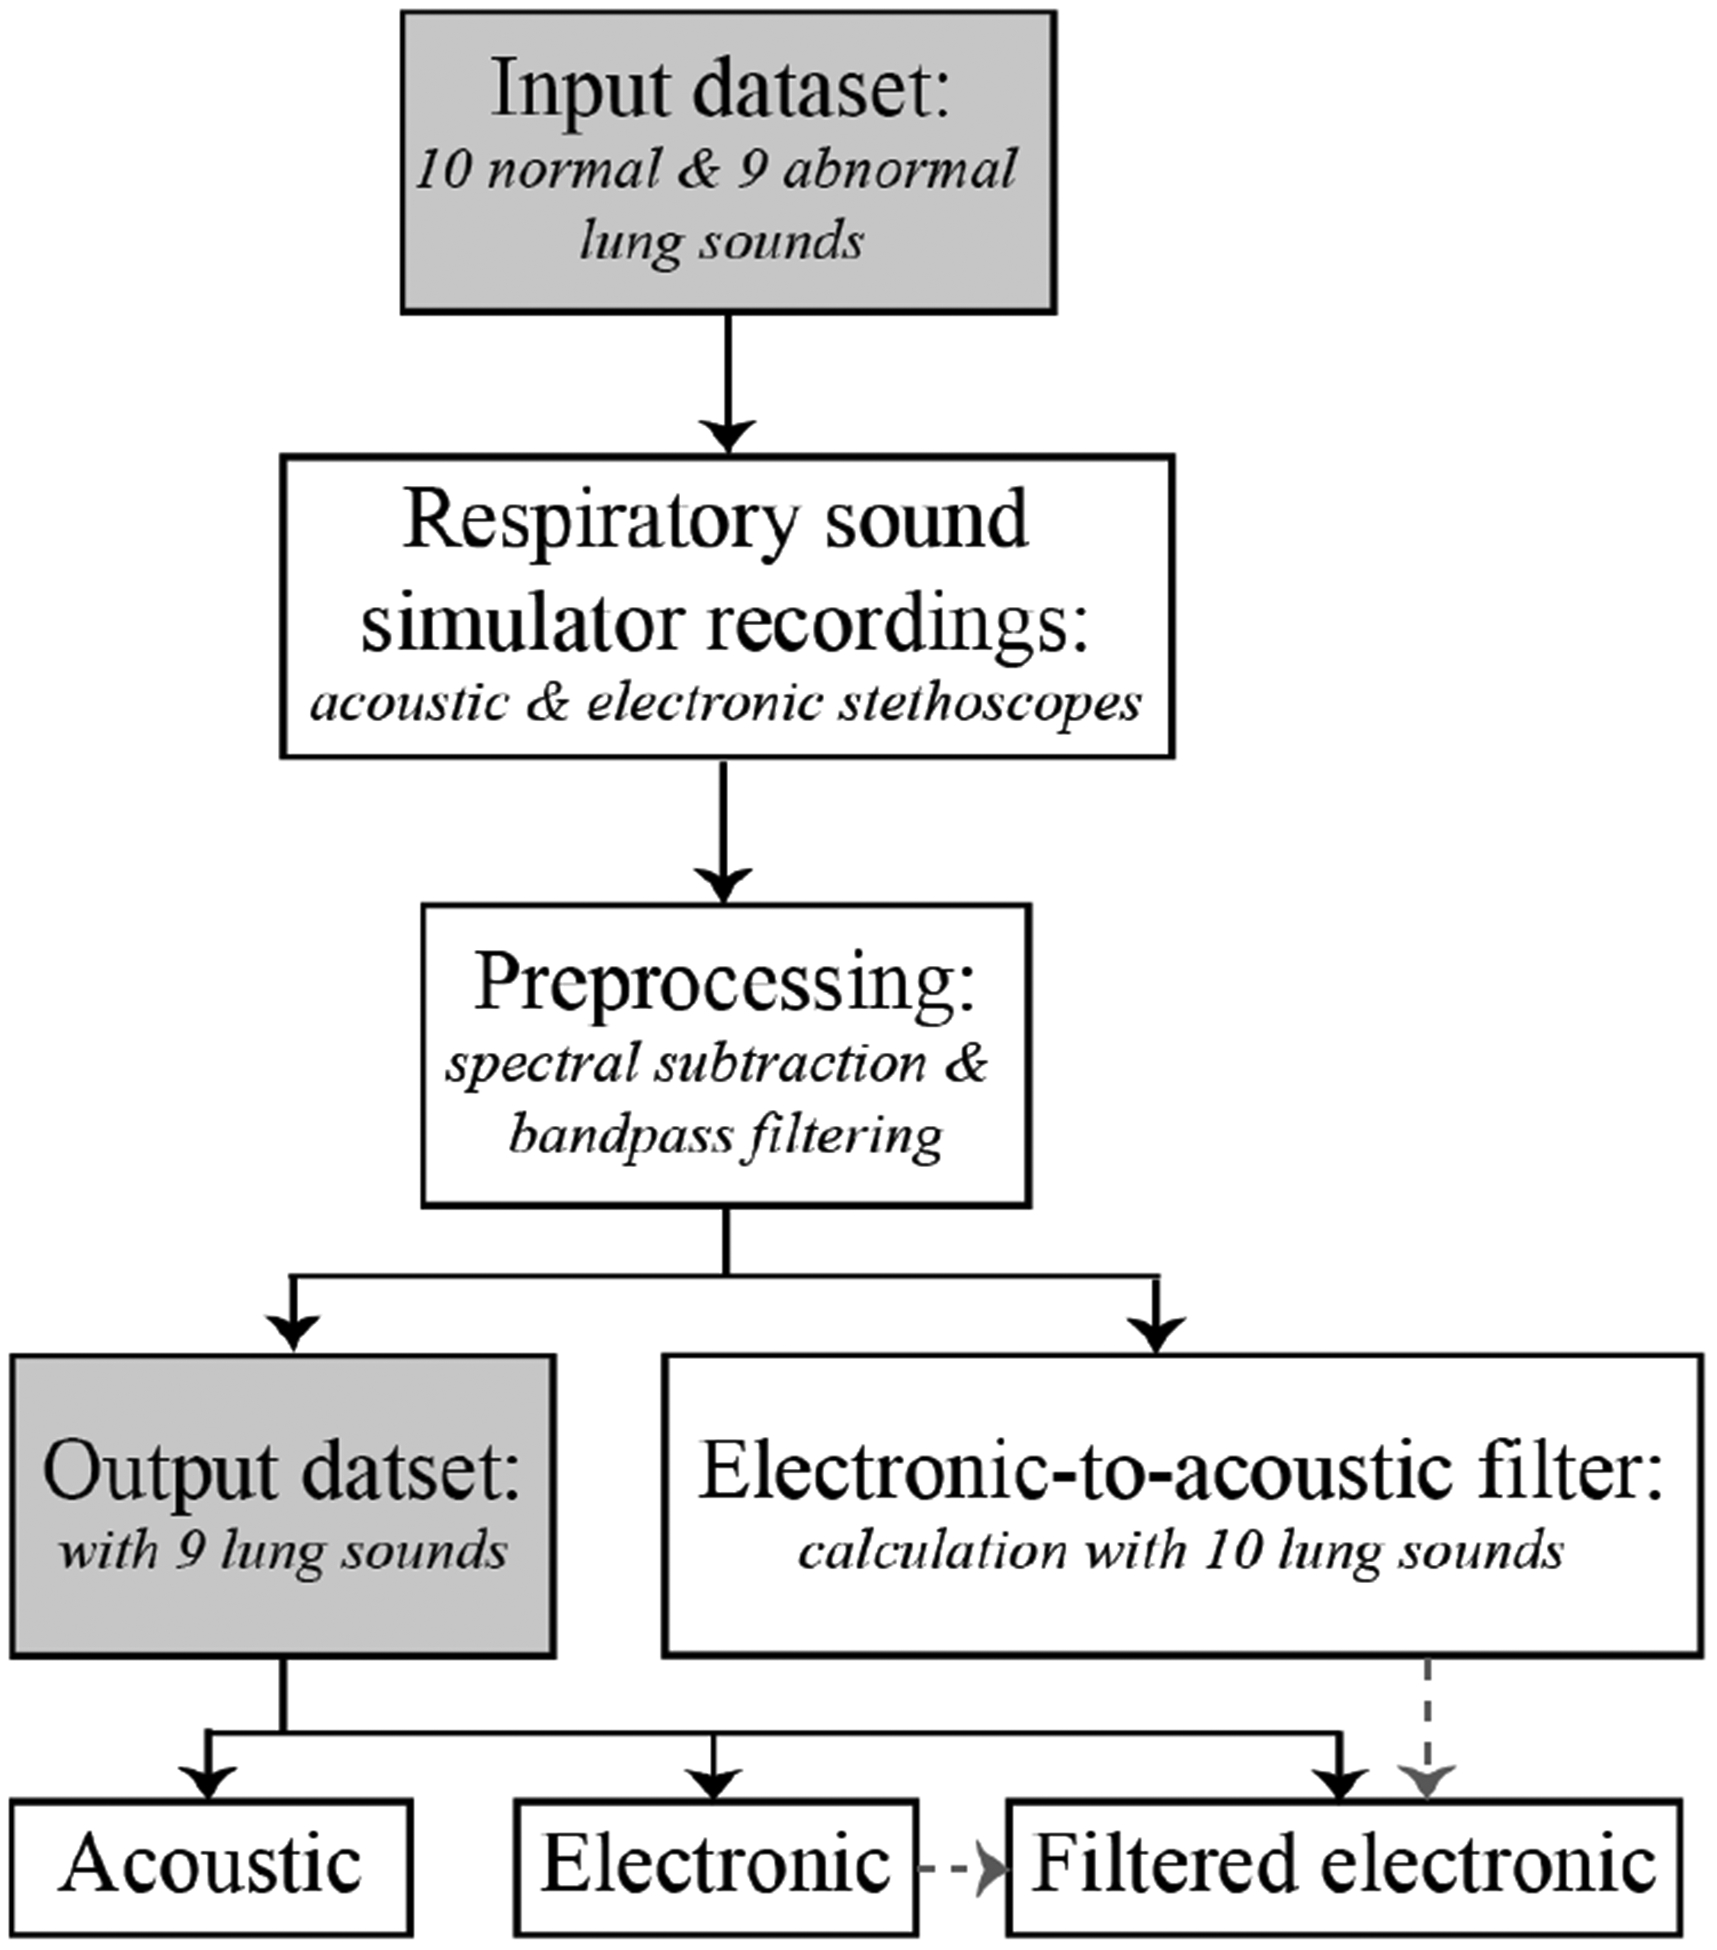
Flow chart of main processing steps from input to output datasets.
This band equalization approach was chosen due to the perceptual nature of the listening experiment, which involves sounds being played sequentially from each stethoscope. In contrast to a direct measurement of an acoustic stethoscope transfer function or response, the band equalization method accounts for differences between the acoustic and electronic stethoscope recordings due to hardware differences in the recording setup. Pink or white noise excitations can induce resonances due to the tubing and coupling between the body and acoustic stethoscope housing, which lie outside the frequencies of interest [18], [21]. As such, frequency characterization using pink or white noise changed the perceived characteristics of filtered sounds. Lung sounds were used as the excitation source to calculate the electronic-to-acoustic stethoscope filter to focus on the frequency content of lung sounds.
A. Input dataset
Ten normal and nine abnormal lung sounds were obtained from [28] and used without further modification. Previously recorded lung sounds from a database were used, rather than real subjects, to guarantee repeatable recordings for both the acoustic and electronic stethoscopes. The abnormal group consisted of four breath sounds with wheeze, three with crackle, one with stridor, and one with wheeze and crackle. The control group contained normal sounds recorded over various chest areas in addition to tracheal and diminished breath sounds. The sounds were each 15 seconds in length and recorded at 44.1 kHz in 32-bit float. The patient populations and recording devices used for the sounds in the database may have varied and were not disclosed.
B. Recording setup
The selected sounds were played from a respiratory sound simulator that imitates the characteristics of the human body and produces stable, repeatable lung sounds. A respiratory sound simulator was necessary because a stethoscope amplifies sounds from vibrating air as well as the movement of the skin. Direct measurement from a speaker would not have measured the full output of the stethoscope. Similar processes and simulators for transducer and bioacoustic testing were used in [18], [29], [30]. The sound simulator contains a Jawbone Jambox loudspeaker covered in 1.5-inch-thick ballistic gelatin from Clear Ballistics, which approximates the density and viscosity of human muscle tissue. The loudspeaker has a frequency response of 40 to 20,000 Hz with improved low-frequency sensitivity via a proprietary bass radiator. The frequency response is fairly flat (within ± 2.5 dB) from 60 Hz to 12 kHz at 85 dB.
An electronic stethoscope (JHUscope [31]) and acoustic stethoscope (Littmann Cardiology II, diaphragm mode) were placed adjacent to each other on the respiratory sound simulator (Fig. 2). The 15 second lung sounds were played from the simulator in a sound isolation booth and recorded from both stethoscopes simultaneously. The digital stethoscope output was captured directly from the included 3.5mm headphone jack. The acoustic stethoscope output was captured from the earpiece with a calibrated microphone (PCB Piezotronics 1/4” pressure, prepolarized condenser) that was sealed with a thick layer of clay. The second earpiece was also acoustically sealed with clay to restrict any potential noise leakage through the open end of the earpiece. Both signals were sent to a dual channel amplifier (Brüel & Kjær 5935) and recorded in Audacity at a sampling rate of 8 kHz. This sampling rate captures the frequency content of lung sounds, which is generally concentrated below 2,000 Hz [32]. Passthrough channels were also recorded simultaneously with recordings for the acoustic and electronic stethoscopes. The passthrough channels were used to characterize the noise introduced in the amplification and recording setup.
Fig. 2:
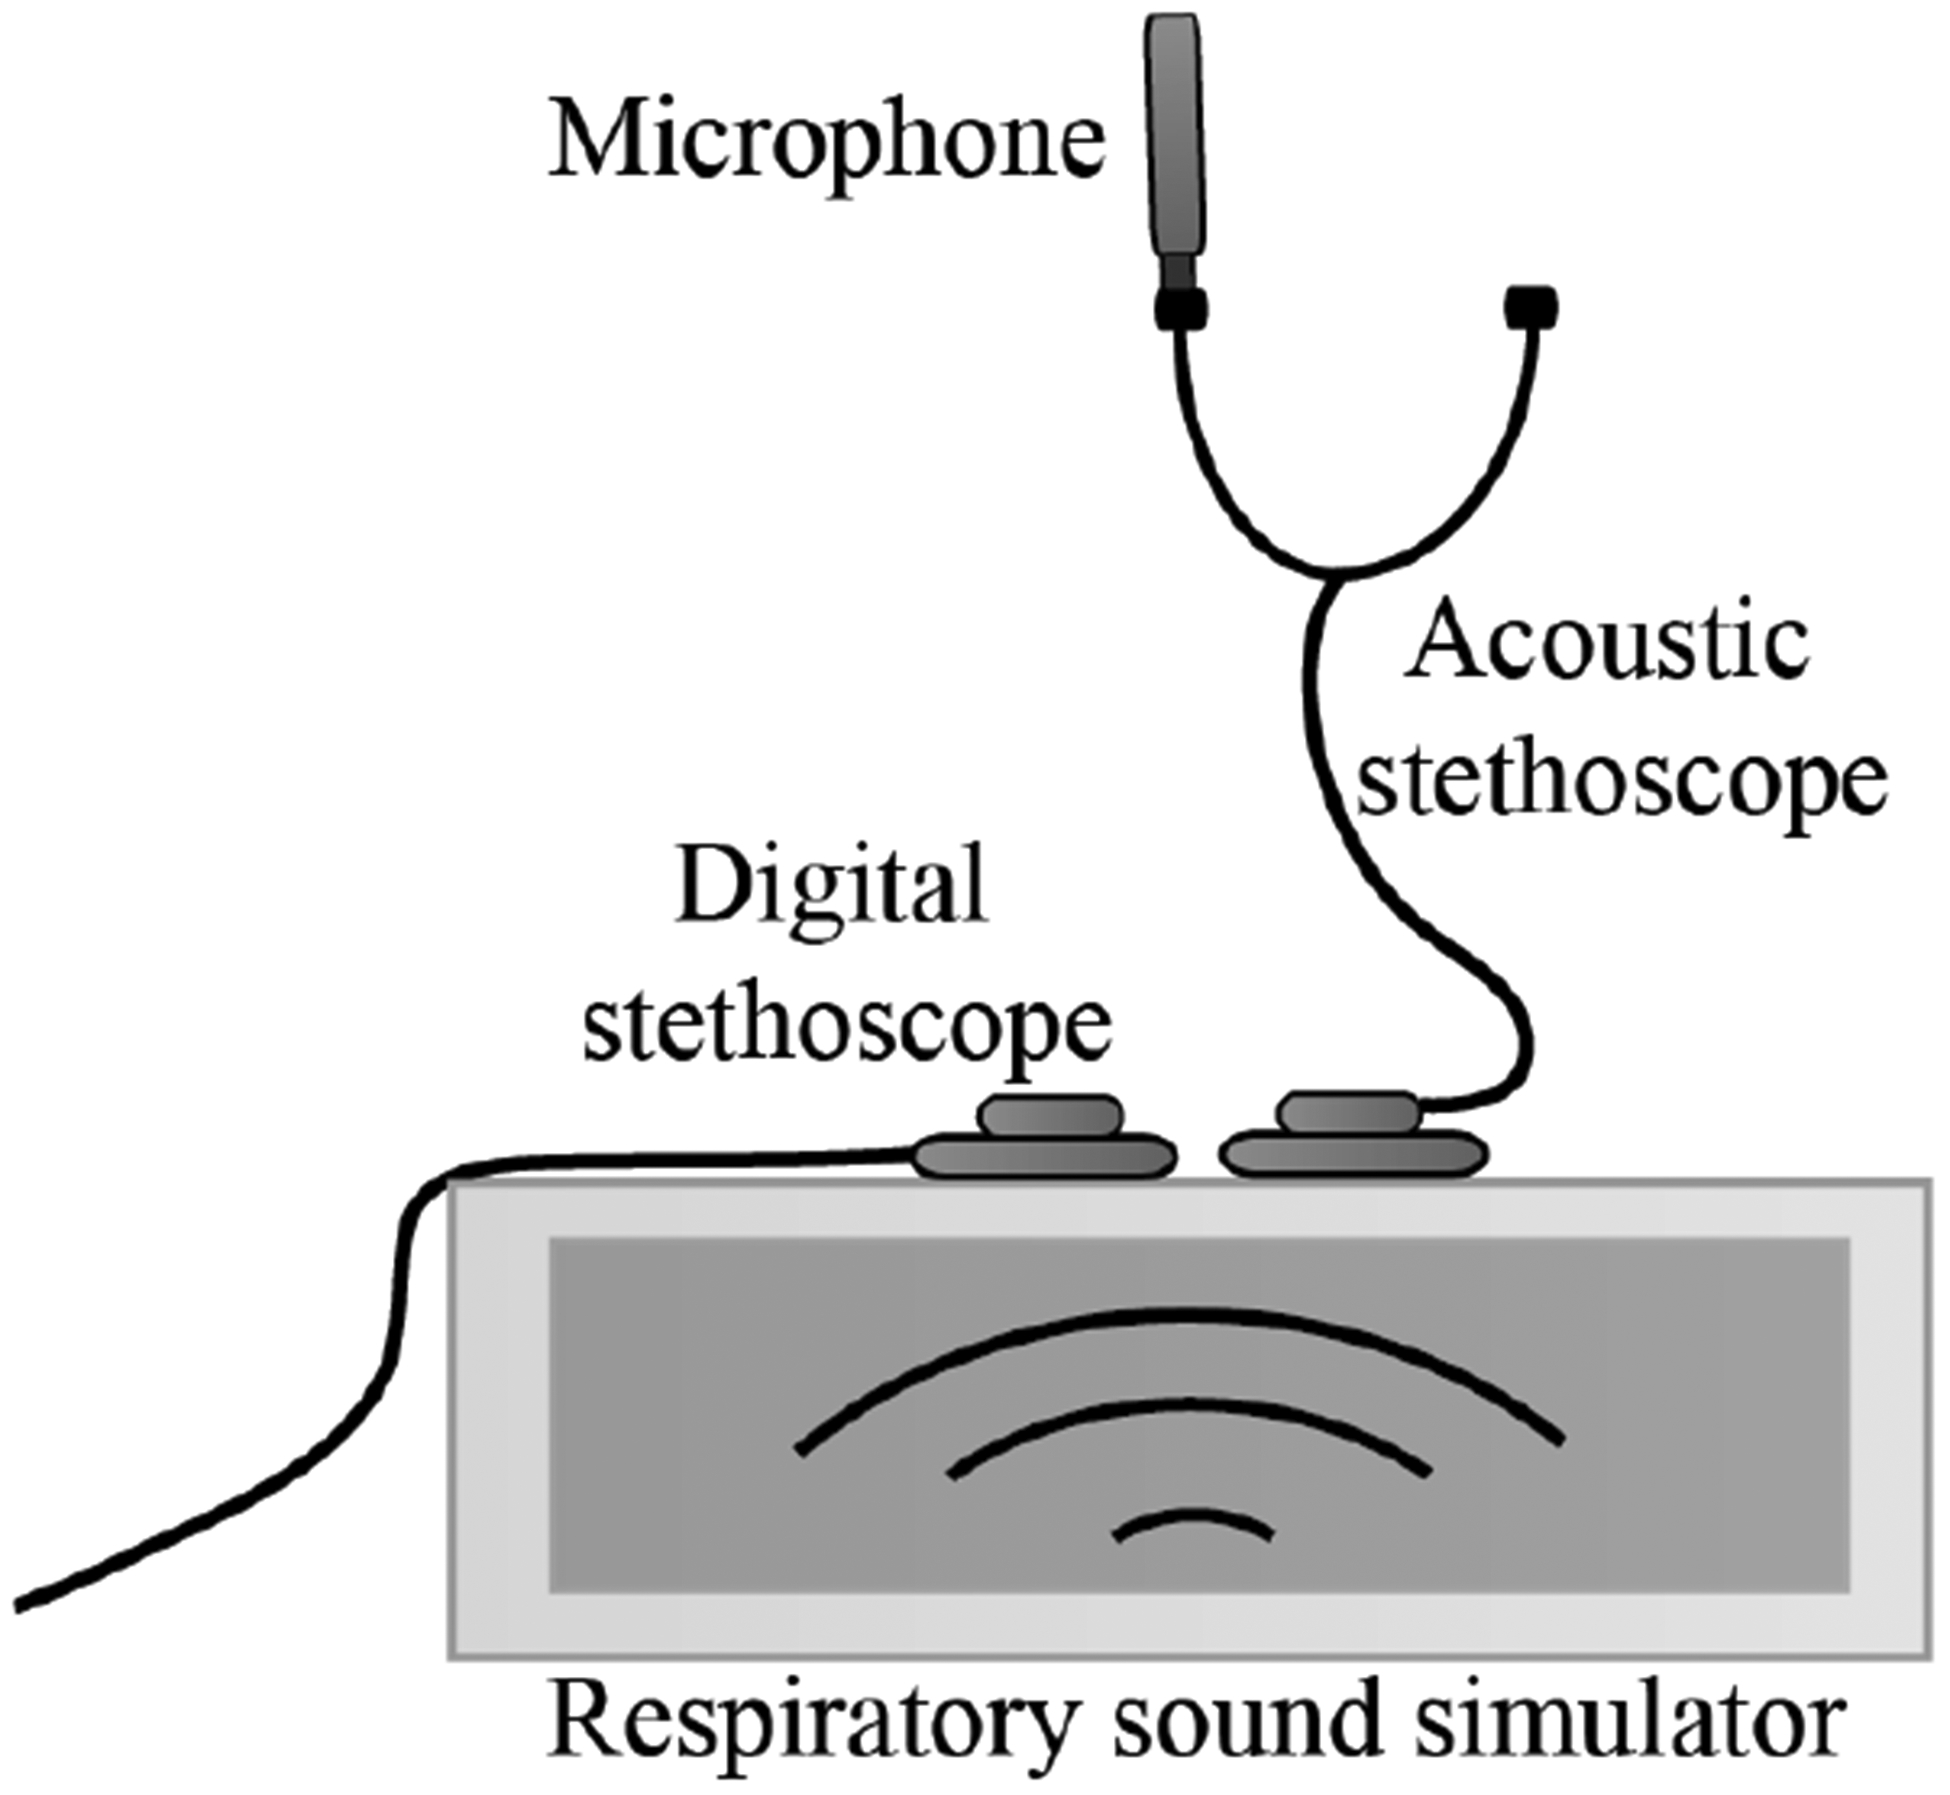
Diagram of lung sound recording setup with acoustic and electronic stethoscopes placed on the respiratory sound simulator.
C. Preprocessing
All recordings were clipped to an equal length of 10 seconds to reduce artifacts from the abrupt beginning and ending of the sound. The recorded lung sounds were subsequently denoised with spectral subtraction [33] to remove any noise or coloration introduced in the recording setup, as characterized by the passthrough channels. This processing was necessary for the listening experiment so that listeners distinguish recordings based on the quality of the sounds and not on introduced recording noise mismatch. The recordings were also bandpass filtered from 35 to 3000 Hz to remove out-of-band noise.
D. Electronic-to-acoustic stethoscope filter calculation
Ten recorded lung sounds (5 normal, 5 abnormal) from the electronic and acoustic stethoscopes were randomly chosen and used to calculate an electronic-to-acoustic stethoscope filter. The discrete short-time Fourier transform (STFT) of each lung sound (Xs(pL,k)) was calculated using 100 ms Hamming windows without overlap. Overlap was not necessary to gauge the average frequency response of the recording. In the following equation, x[m] is the lung sound signal of interest at sample m, w[pL−m] is a time-decimated window with length 2L shifted in integer multiples of p from −∞ to ∞, and 2π/N is equal to the frequency where N is the number of points used to calculate the discrete Fourier transform and k is an integer multiple from 0 to N − 1.
| (1) |
The average normalized magnitude spectrum for each lung sound was calculated with both the electronic (Es) and acoustic (As) stethoscope recordings:
| (2) |
where n is the total number of STFT windows over the 10 second recording and s is the lung sound number.
The average magnitude spectra were subsequently smoothed with a moving average filter over five samples. The difference between the smoothed average magnitude spectra of all ten acoustic and electronic stethoscope recordings was calculated and smoothed to obtain the electronic-to-acoustic stethoscope filter (F) in the Fourier domain.
| (3) |
E. Filtering of electronic stethoscope recordings
To filter the remaining nine lungs sounds from the input dataset that were recorded on the electronic stethoscope and not used for the electronic-to-acoustic filter calculation, FFT multiplication was performed with the electronic-to-acoustic stethoscope filter (F) and lung sound being processed. The discrete STFT of a lung sound recorded with the electronic stethoscope was calculated using 100 ms Hamming windows with 99.7% overlap. Unlike the previous step to calculate the filter, overlap was necessary in this step for accurate reconstruction of the signal. The discrete STFT magnitude was multiplied with the electronic-to-acoustic stethoscope filter and recombined with its original phase to obtain the filtered discrete STFT (XF(pL,k)).
| (4) |
Overlap and add reconstruction was performed to obtain the filtered signal, which was subsequently low pass filtered (fifth-order Butterworth filter with 2 kHz cutoff) to limit processing induced noise and artifacts in a frequency range listeners are particularly sensitive to.
F. Output dataset
The nine lung sounds that were not used for the electronic-to-acoustic filter calculation from the acoustic and electronic stethoscopes, as well as the nine filtered electronic stethoscope sounds, were high pass filtered at 80 Hz. Comparing the frequency content of the original lung sounds and stethoscope recordings of the same lung sounds, it was observed that the stethoscope recordings had significant energy below 50 Hz that was not in the original lung sounds. The high pass filter was used to remove this artificial noise below 80 Hz that was being amplified by the stethoscopes due to the recording setup and environment. For consistent levels, the recordings were all set to an integrated loudness of −23 LUFS by the EBU R 128 standard [34]. This output dataset of acoustic, electronic, and filtered electronic stethoscope sounds was used in the listening experiment.
III. Subjective Validation
A listening experiment was used to evaluate the electronic-to-acoustic stethoscope filtering effectiveness by quantifying how well listeners differentiated between true recordings of the acoustic stethoscope and filtered recordings from the electronic stethoscope. Filtered electronic stethoscope recordings will subsequently be referred to as simply ‘filtered’.
Participants were given five randomly chosen lung sound files approximately 60 seconds in length to assess. Each file comprised multiple sections of the same lung sound, recorded from the electronic, acoustic, or filtered stethoscopes in randomized orders. Participants reported when a change in the stethoscope used to capture the sound was detected on a computer interface. All methods were approved by the Johns Hopkins University Homewood Institutional Review Board (HIRB00009382).
A. Participants
Medical professionals or students with self-proclaimed training to use a stethoscope were eligible for this study. No distinction was made based on whether the volunteer typically uses an acoustic or electronic stethoscope. A total of 51 participants enrolled, all affiliated with Johns Hopkins Hospital or Johns Hopkins University in Baltimore, MD, USA, with informed consent.
Prior to beginning the listening experiment, participants completed a questionnaire reporting the number of years of experience they have using a stethoscope in a clinical setting (0 to 1 year, 2 to 4 years, 5 to 10 years, or over 10 years) and their current medical occupation (physician, nurse, resident, fellow, or other). Table I shows the questionnaire responses. The majority of respondents classified ‘Other’ as their occupation, which largely consisted of nursing or medical students (17 participants) and several physician assistants, researchers, and technicians. Physicians and nurses were the second and third most prevalent participant occupations. The participants had a fairly even distribution of years of experience using a stethoscope in a clinical setting with 10 to 16 volunteers in each range.
TABLE I:
Listening experiment participants’ occupations and years of experience using a stethoscope in a clinical setting.
| 0 – 1 | 2 – 4 | 5 – 10 | >10 | Total | |
|---|---|---|---|---|---|
| Nurse | 2 | 1 | 1 | 4 | 8 |
| Physician | - | 1 | 7 | 7 | 15 |
| Fellow | - | - | - | 1 | 1 |
| Resident | - | 1 | 1 | - | 2 |
| Other | 14 | 7 | 4 | - | 25 |
| Total | 16 | 10 | 13 | 12 | 51 |
B. Dataset
Nine acoustic, electronic, and filtered stethoscope lung sounds were used for the listening experiment, as described in section IIF. For each of the nine sounds, a single, long lung sound file, approximately 60 seconds in length, was constructed by splicing together different sections and lengths of the acoustic, electronic, and filtered stethoscope recordings (Fig. 3). The transitions joining recordings occurred in the silence between breaths and were crossfaded in the moments of silence to avoid audible clipping. Efforts were made to splice the sounds together such that the breaths transitioned smoothly and naturally. The sound files included two to three changes of each transition or its reverse (acoustic to electronic, electronic to filtered, or acoustic to filtered) with a minimum of 5 seconds between each change. The times that changes occurred were pseudo-randomized and did not repeat in a regular pattern. Volunteers were given a random subset of these 9 sounds files in the listening experiment to assess.
Fig. 3:

Diagram of sound file containing same lung sound, but with transitions between acoustic (A), electronic (B), and filtered (C) stethoscope recordings.
C. Setup
Listening experiments were given to participants in a quiet area with minimal background noise and designed to last for 10 to 15 minutes. The participant was seated in front of a computer and instructions for the listening experiment and graphical user interface (GUI) were provided with an on-screen prompt. The prompt stated participants would be presented with a series of five lung sounds and instructed to click a button when a change in the stethoscope used to record the sound was detected. Participants were given ample time to proceed through the listening experiment at their own pace. All participants used Sennheiser HD 595 headphones and were allowed to set the volume to a comfortable level. Based on visual observation, subjects did not adjust the volume following the example sound files.
Prior to beginning the listening experiment, participants were given three short (10 to 15 seconds) sound examples with a single transition. The GUI displayed ‘CHANGE’ when a transition occurred to acclimate participants to the sounds and change detection task. Following the presentation of the examples, participants were given five randomly chosen sound files out of the total nine available. Participants used the GUI to record when a change in sound quality was detected. When participants clicked the ‘Change detected’ button, the GUI displayed ‘Recorded’ for one second to avoid user confusion with the interface. The time of change detection was recorded for later analysis. The option was given for participants to reset a sound file and restart the change detection task if an error was made.
D. Analysis
The times when a participant recognized a change were compared with the times of an actual change and recorded as either a true or false detection. Change windows were defined around 0 to 1.6 seconds of an actual change. The remaining duration of the signal was broken into windows of no change that were also 1.6 seconds in length. This change window length was chosen based on [35], which studied the reaction times for change detection in auditory textures. Reaction times were found to vary based on several properties of the stimulus, but typically peaked at approximately 1 second. To account for silences between breaths, an additional 0.6 seconds was added to the change window length. This value was obtained by calculating the maximum average silence duration between transitions for each sound.
A true detection occurred when participants clicked within a change window, while a false detection occurred when participants clicked outside a change window. If a participant recognized multiple changes within a change window, subsequent detections after the first were counted as false detections. The detections were grouped based on two-way transitions between acoustic to electronic, electronic to filtered, or acoustic to filtered. The total number of true detections for each transition type and the total number of false detections were found for each volunteer over all five sound files. This approach removed the dependence on individual sound files in order to better understand the average listening experience across multiple sound types.
The resulting data were analyzed using detection theory, which takes the random variability of human perception into account [36]. In contrast to solely reporting the number of true detections, detection theory uses a sensitivity index to provide a more robust measure of event detection by considering the underlying noise present through false detections. The sensitivity index (d’) was calculated for each volunteer and transition type using the difference in z-scores of the hit and false alarm rates.
| (5) |
The hit rate for each transition type was calculated as the total number of true detections (Dtransition) over the total number of change windows of that type (Wtransition).
| (6) |
The false alarm rate was calculated as the total number of false detections (Dfalse) over the total number of windows with no change (Wno change).
| (7) |
The R ‘psycho’ package was used to calculate the sensitivity index. Within the package, the ‘qnorm’ function is used to calculate the z-score by finding the xth quantile with mean 0 and standard deviation 1.
IV. Results
A. Electronic-to-acoustic stethoscope filter
Fig. 4 shows the calculated average magnitude spectra of the lung sounds recorded by acoustic and electronic stethoscopes in addition to the electronic-to-acoustic stethoscope filter response. The stethoscopes have similar responses at low (< 60 Hz) and high frequencies (> 800 Hz). However, the acoustic stethoscope demonstrates a broader peak near 150 Hz and a more pronounced peak between 300 to 400 Hz, with additional gains of 10 and 14 dB, respectively. The acoustic stethoscope also has a small peak of approximately 3 dB near 500 Hz. In general, the filter corrects for the the main differences that are concentrated between 100 and 400 Hz.
Fig. 4:
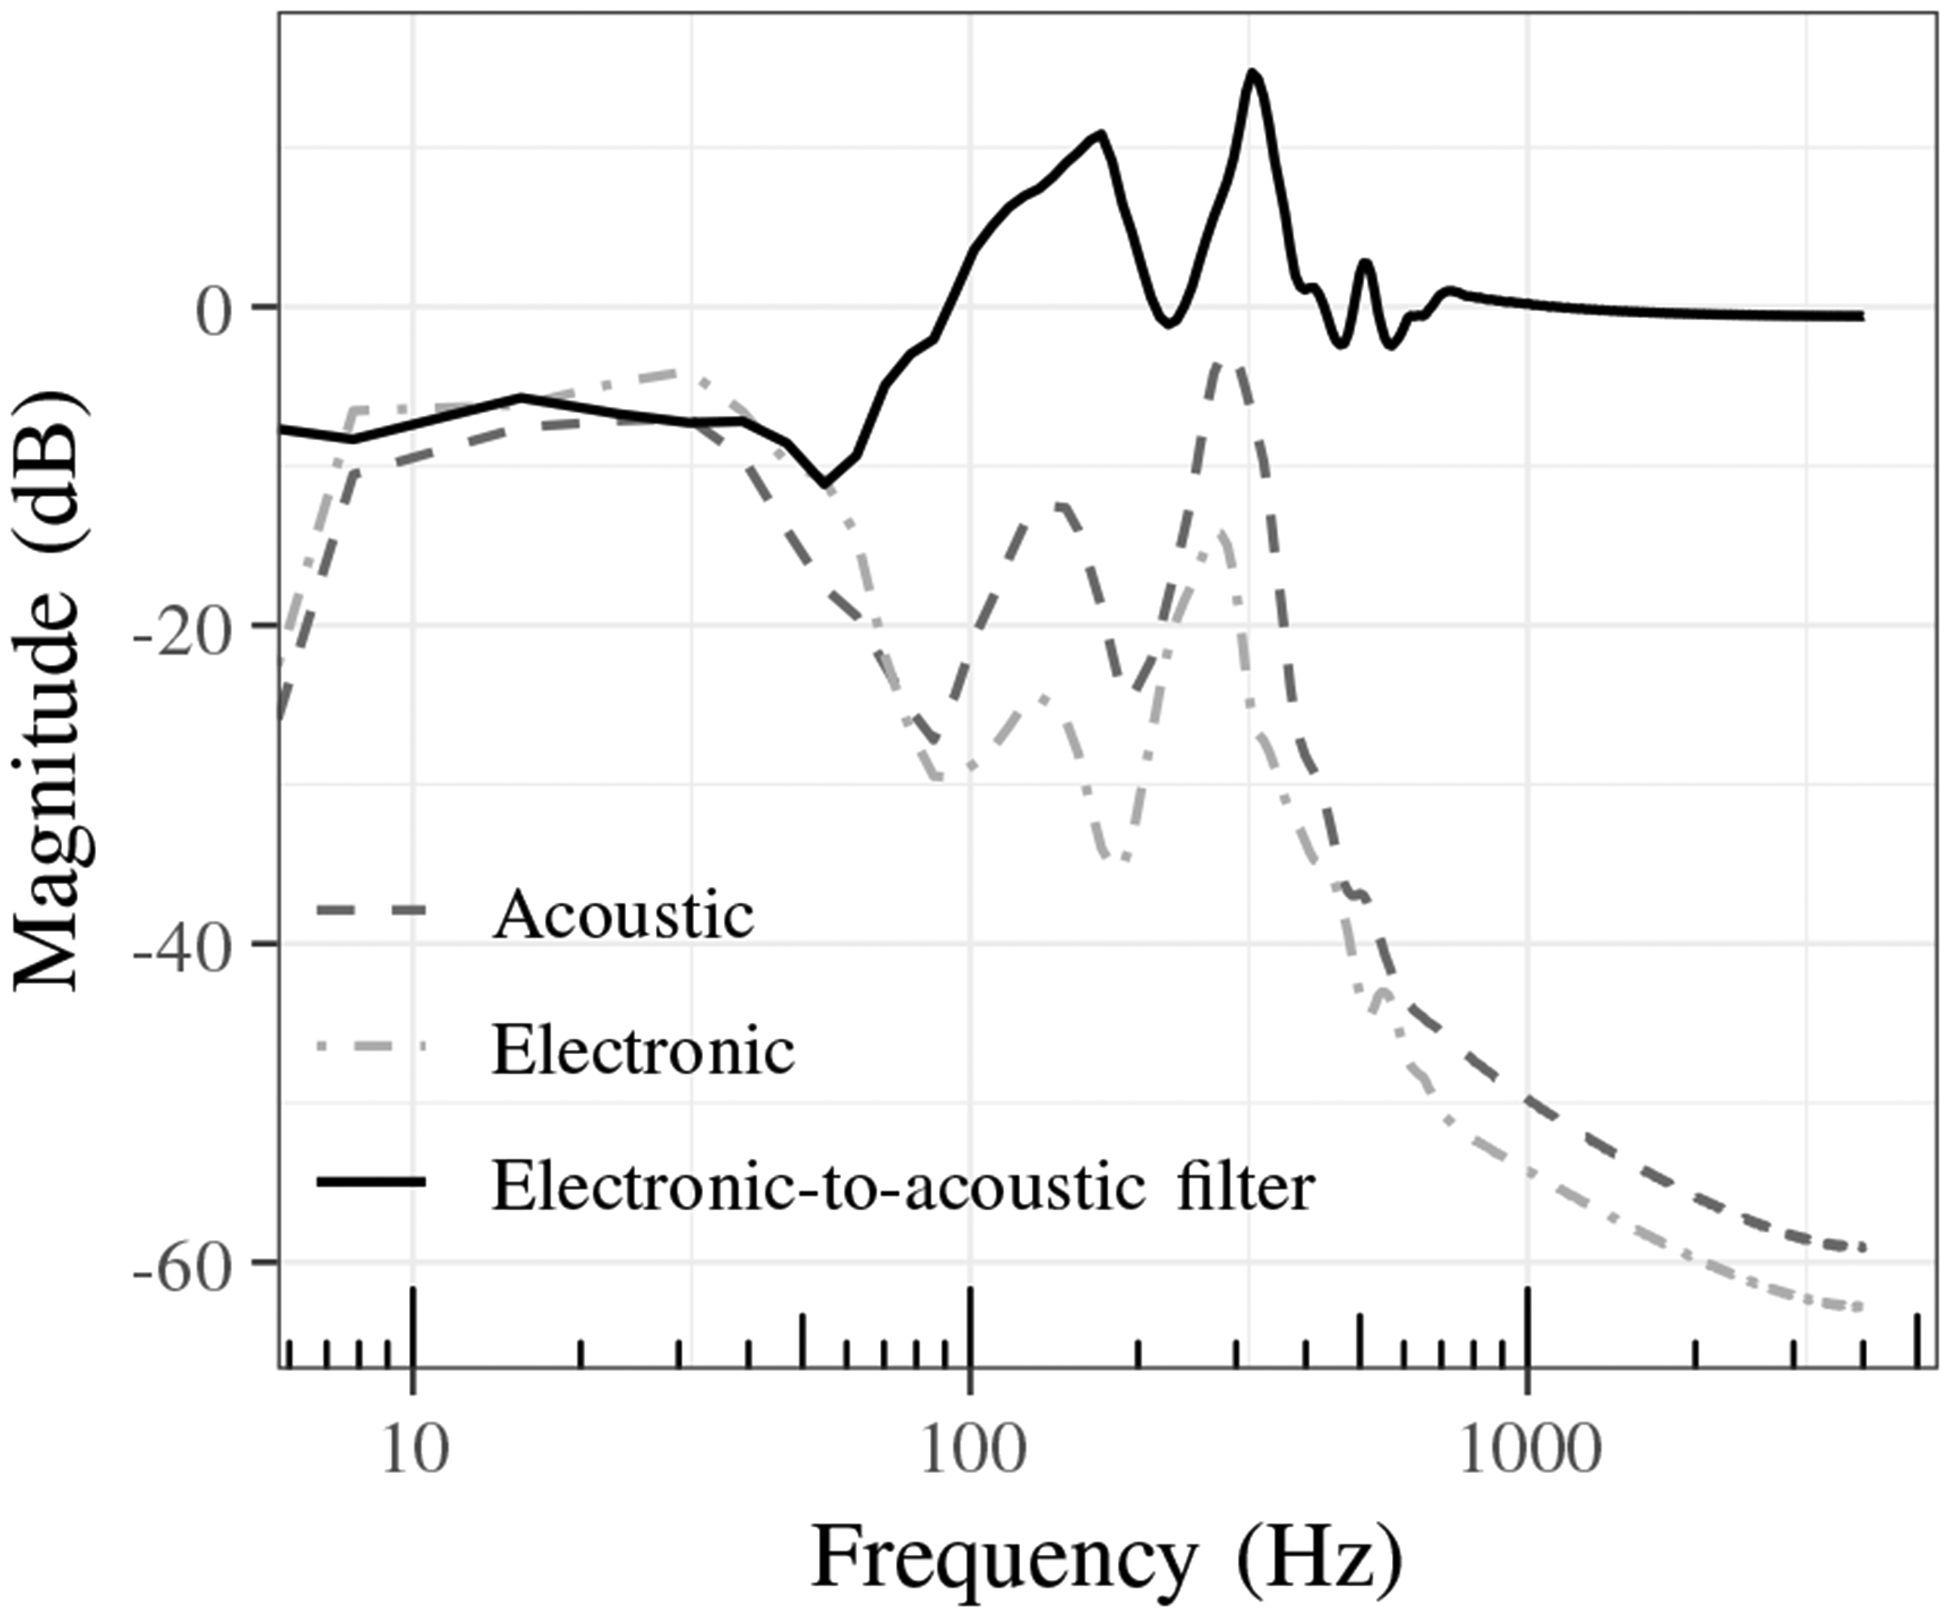
Average magnitude spectra of lung sounds recorded by acoustic and electronic stethoscopes and electronic-to-acoustic stethoscope filter.
The effects of the filter can be seen in Fig. 5, which compares the power spectra for a single normal lung sound from the electronic, acoustic, and filtered stethoscopes. Compared to the acoustic stethoscope, the electronic stethoscope sound has higher power between 225 and 275 Hz and lower power from 300 to 350 Hz. The effectiveness of the filtering can be seen by comparing the acoustic and filtered power spectra which are much more similar in comparison to the electronic power spectrum. Fig. 6 shows the cross power spectral density of the same normal lung sound for each pair of stethoscope combinations.
Fig. 5:
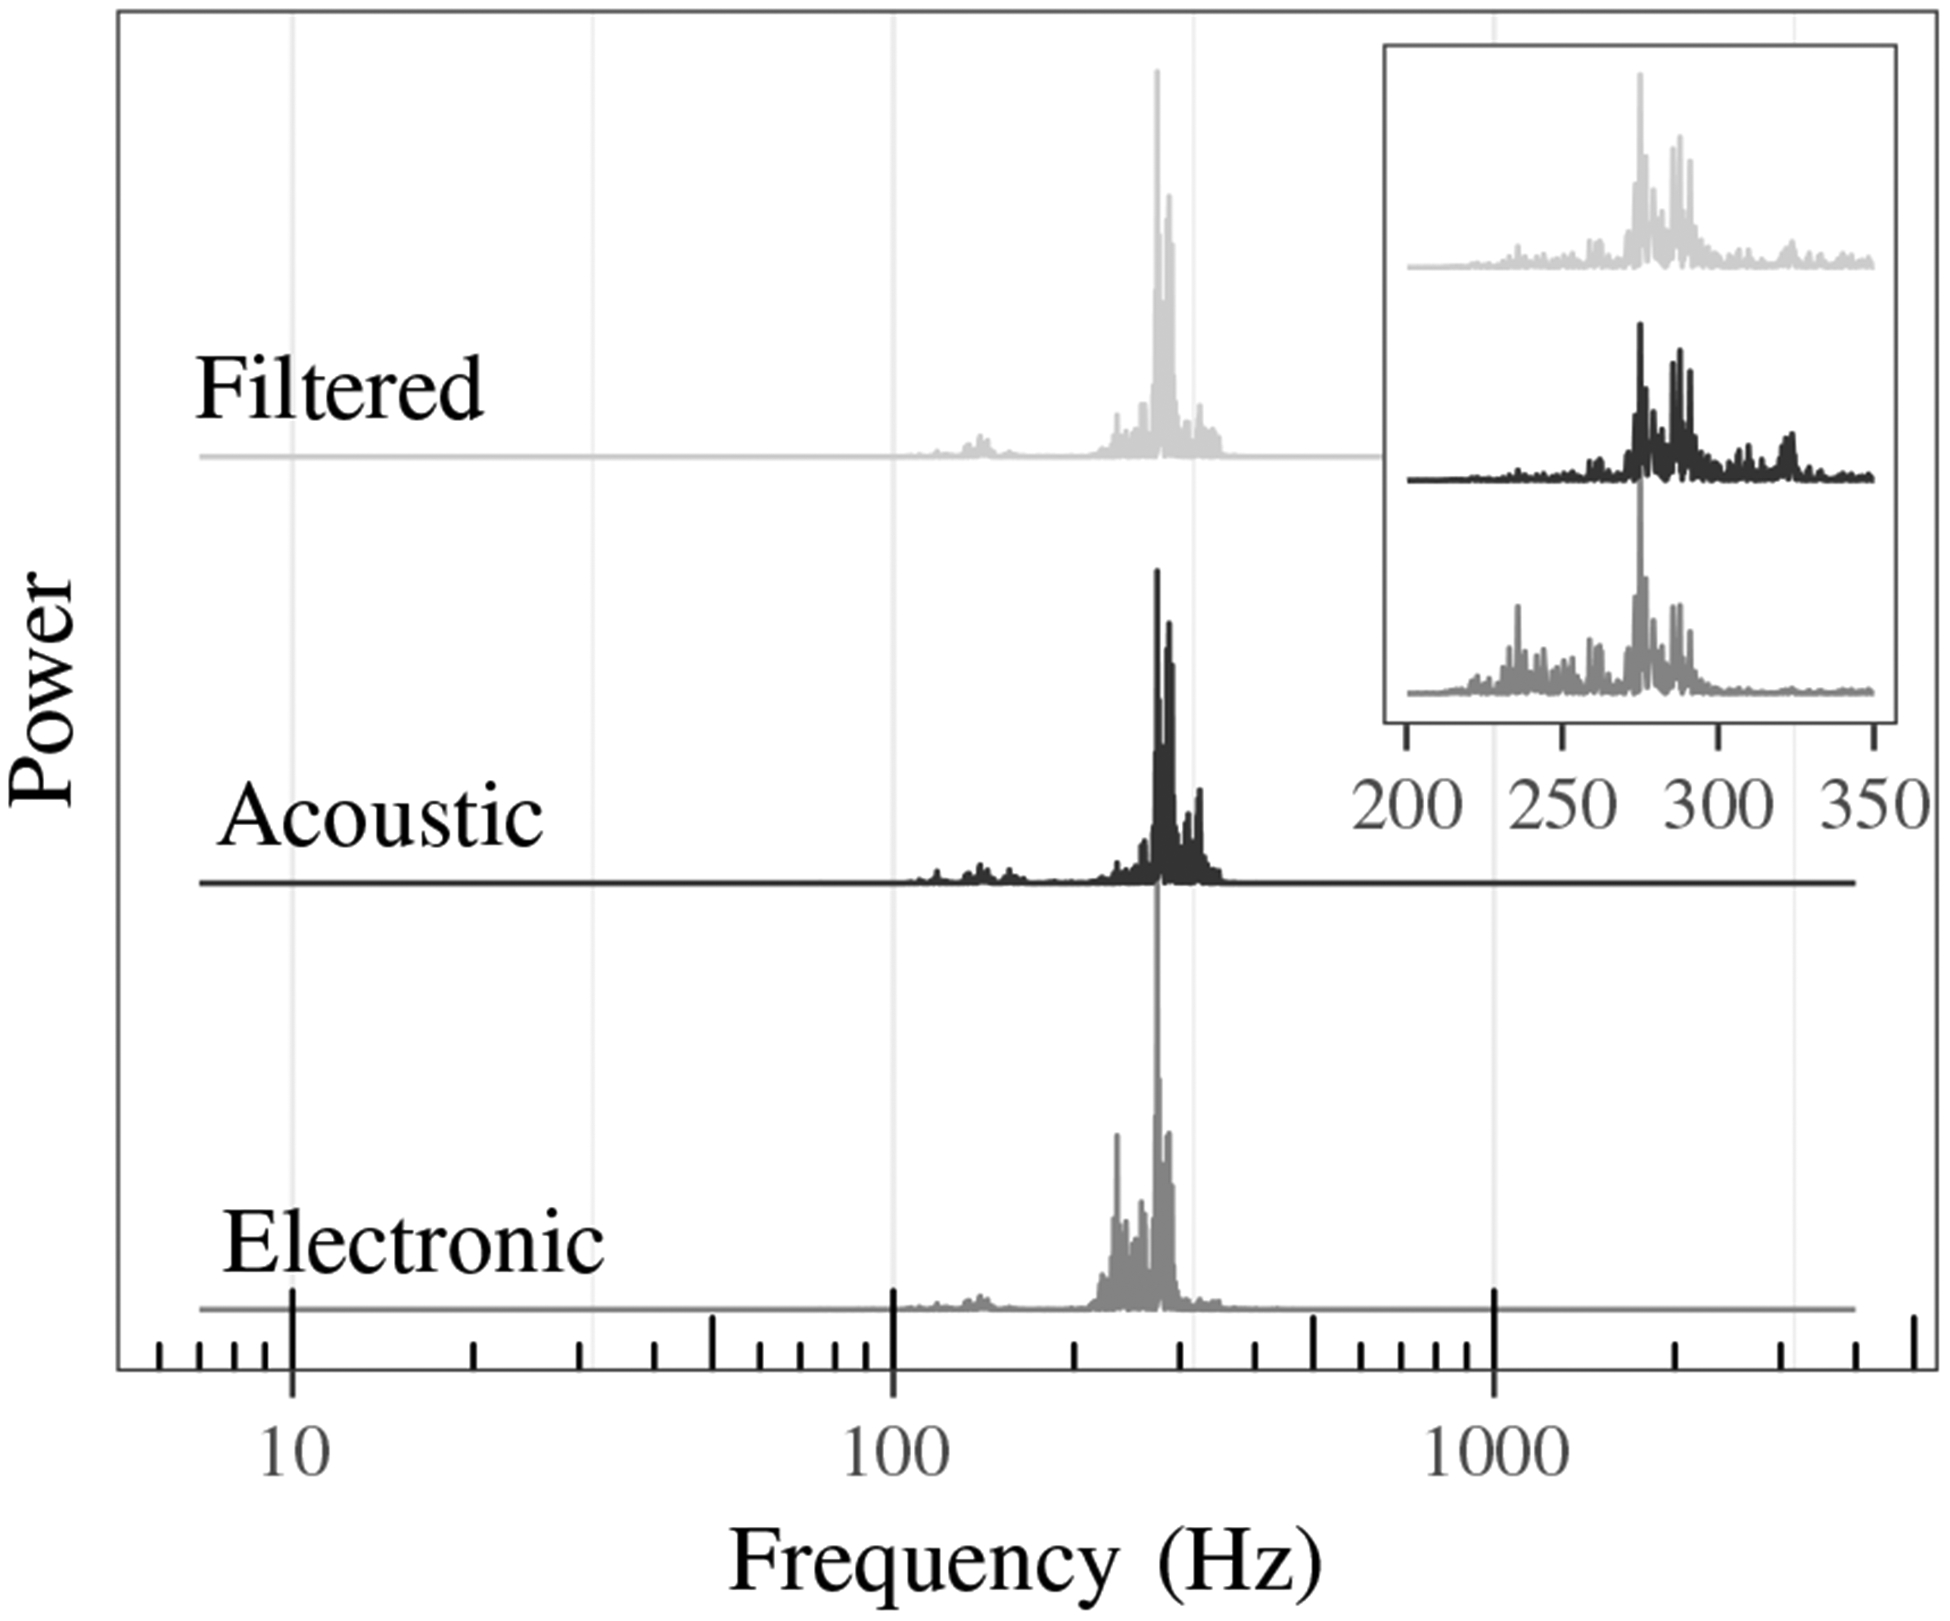
Power spectra comparison of electronic, acoustic, and filtered stethoscope sound.
Fig. 6:
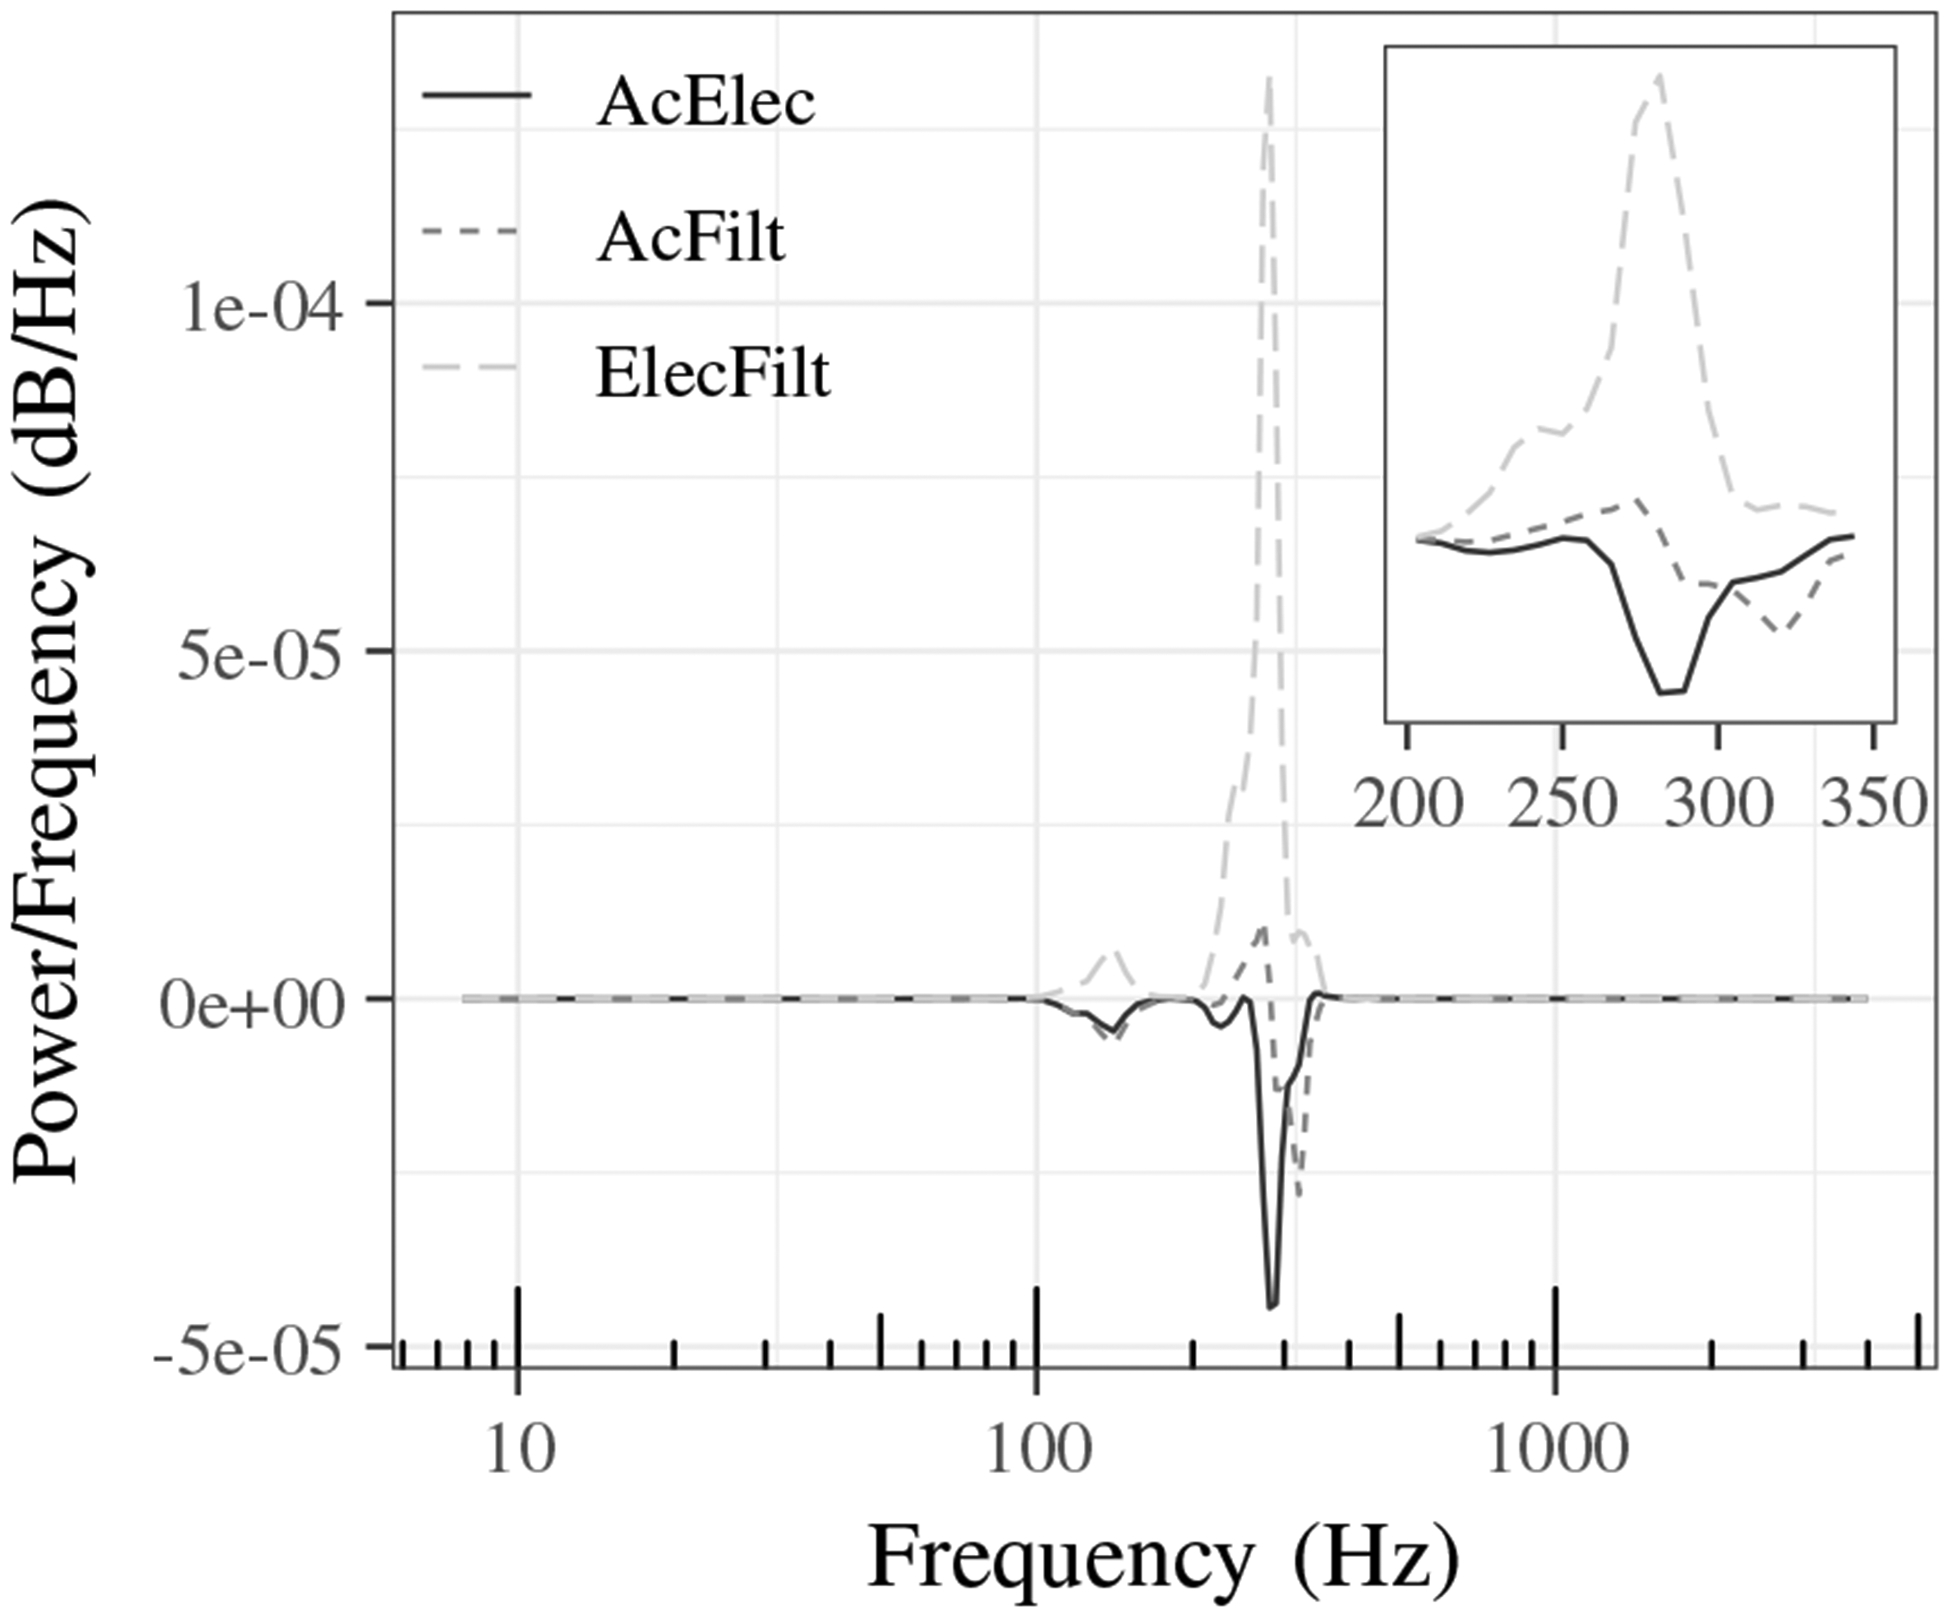
Cross power spectral density of normal lung sound from acoustic and electronic (AcElec), acoustic and filtered (AcFilt) and electronic and filtered (ElecFilt) stethoscope combinations.
B. Listening experiment
The calculated sensitivity indices (d’) for each transition type are shown in Fig. 7. A high d’ value indicates that the participant is more sensitive to changes in the quality of the sound and better able to recognize transitions. A d’ value equal to zero indicates that the hit and false alarm rates are equal and a person is likely detecting transitions by chance.
Fig. 7:
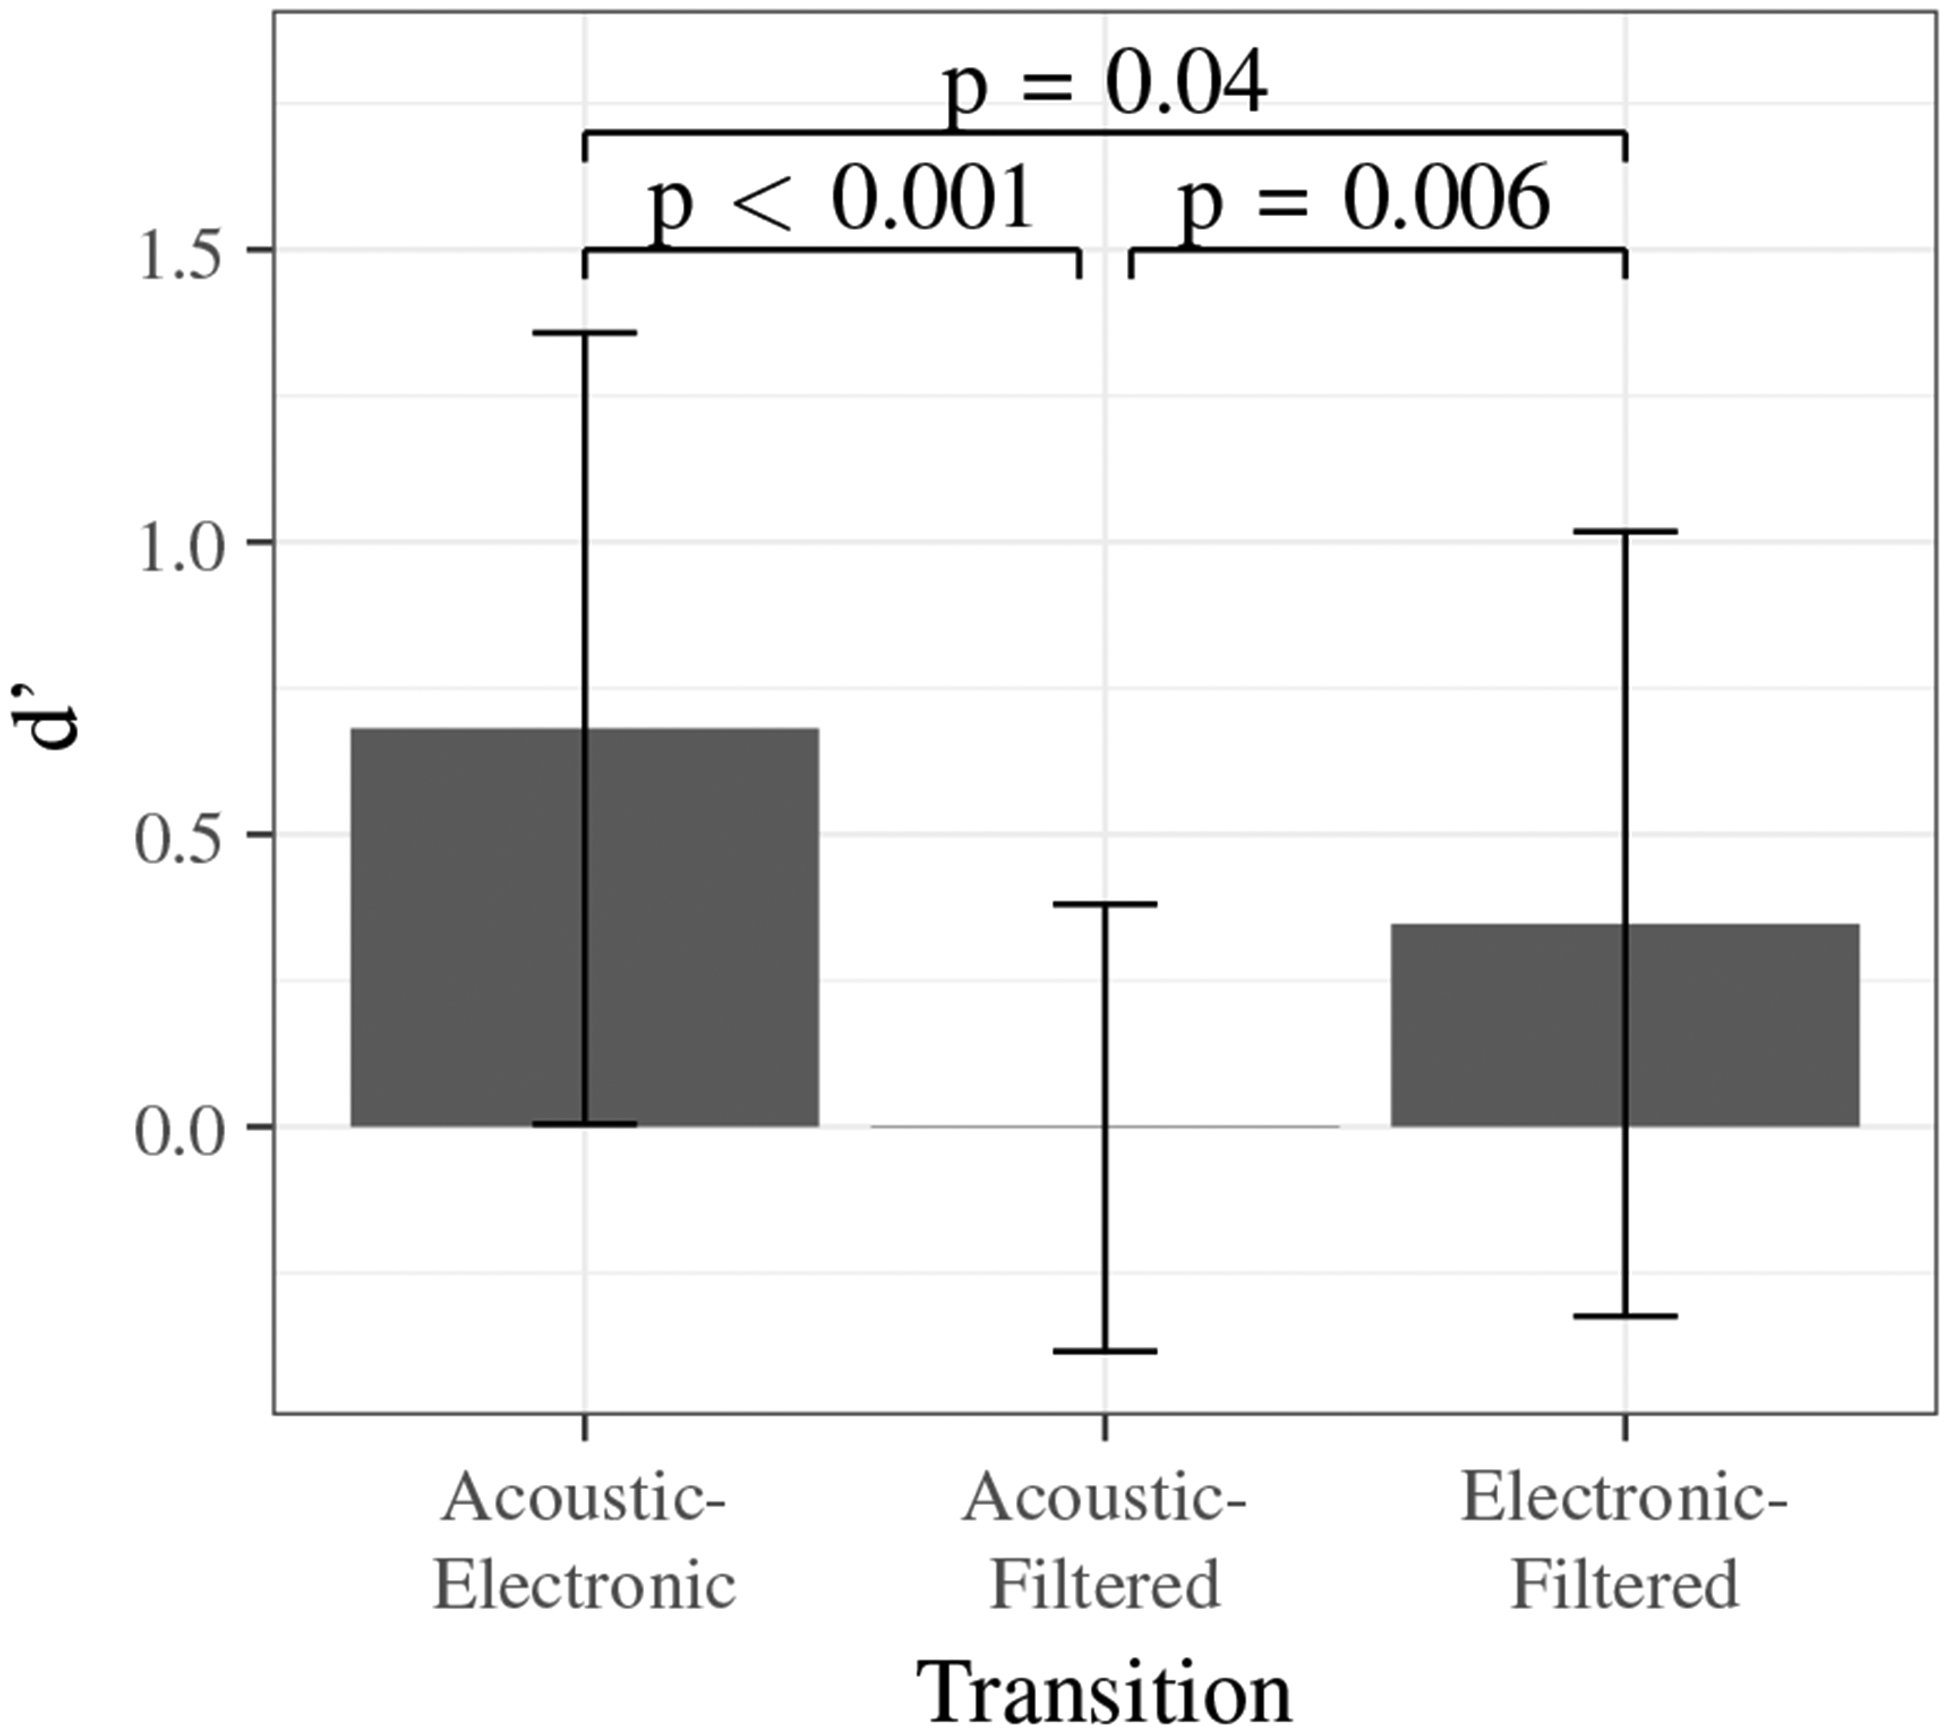
Sensitivity indices for each stethoscope transition type presented in the listening experiment.
Transitions between acoustic and electronic stethoscope sounds were detected most frequently with the highest average d’ value. This clearly indicates that clinicians differentiate between the sound quality of these two stethoscopes. Transitions between the acoustic and filtered stethoscope recordings had the lowest average d’ value indicating a lower number of true transition detections.
To determine if significant differences existed between the d’ values for each transition, a pairwise t-test with the Bonferroni correction was performed. ANOVA was not used because the dataset demonstrated non-homogeneous variance by Levene’s test (p < 0.001). The p-values, shown in Fig. 7, indicate a significant difference between all groups at a significance level of 0.05.
A one sample t-test with the d’ values for acoustic to filtered transitions demonstrated that the group mean was equal to zero (p > 0.9). This indicates that acoustic to filtered transitions were detected by chance and, on average, listeners could not differentiate between acoustic and filtered stethoscope recordings. Similar results were obtained when resets were taken into account to verify that no learning effect was linked to the volunteers, indicating a significant difference between acoustic-electronic and acoustic-filtered transition groups (p < 0.001) and between electronic-filtered and acoustic-filtered transition groups (p = 0.01).
Ideally, if the filtered stethoscope perfectly mimics an acoustic stethoscope, then the sensitivity indices for acoustic-electronic and electronic-filtered would be equal. However, the pairwise t-test demonstrates a borderline significant difference (p = 0.04). We attribute this small difference between the groups to: (1) the large variability due to human subjects and their unique perceptions and (2) imperfections in the electronic-to-acoustic stethoscope filter that bias the filtered signal to contain both electronic and acoustic components. However, the overall trend does favor the filtering to mimic an acoustic stethoscope.
Fig. 8 shows the d’ values for acoustic to filtered transitions based on experience level. While there is an increasing average sensitivity index with greater experience, a pairwise t-test (no correction) between the groups shows no significant differences (p > 0.2).
Fig. 8:
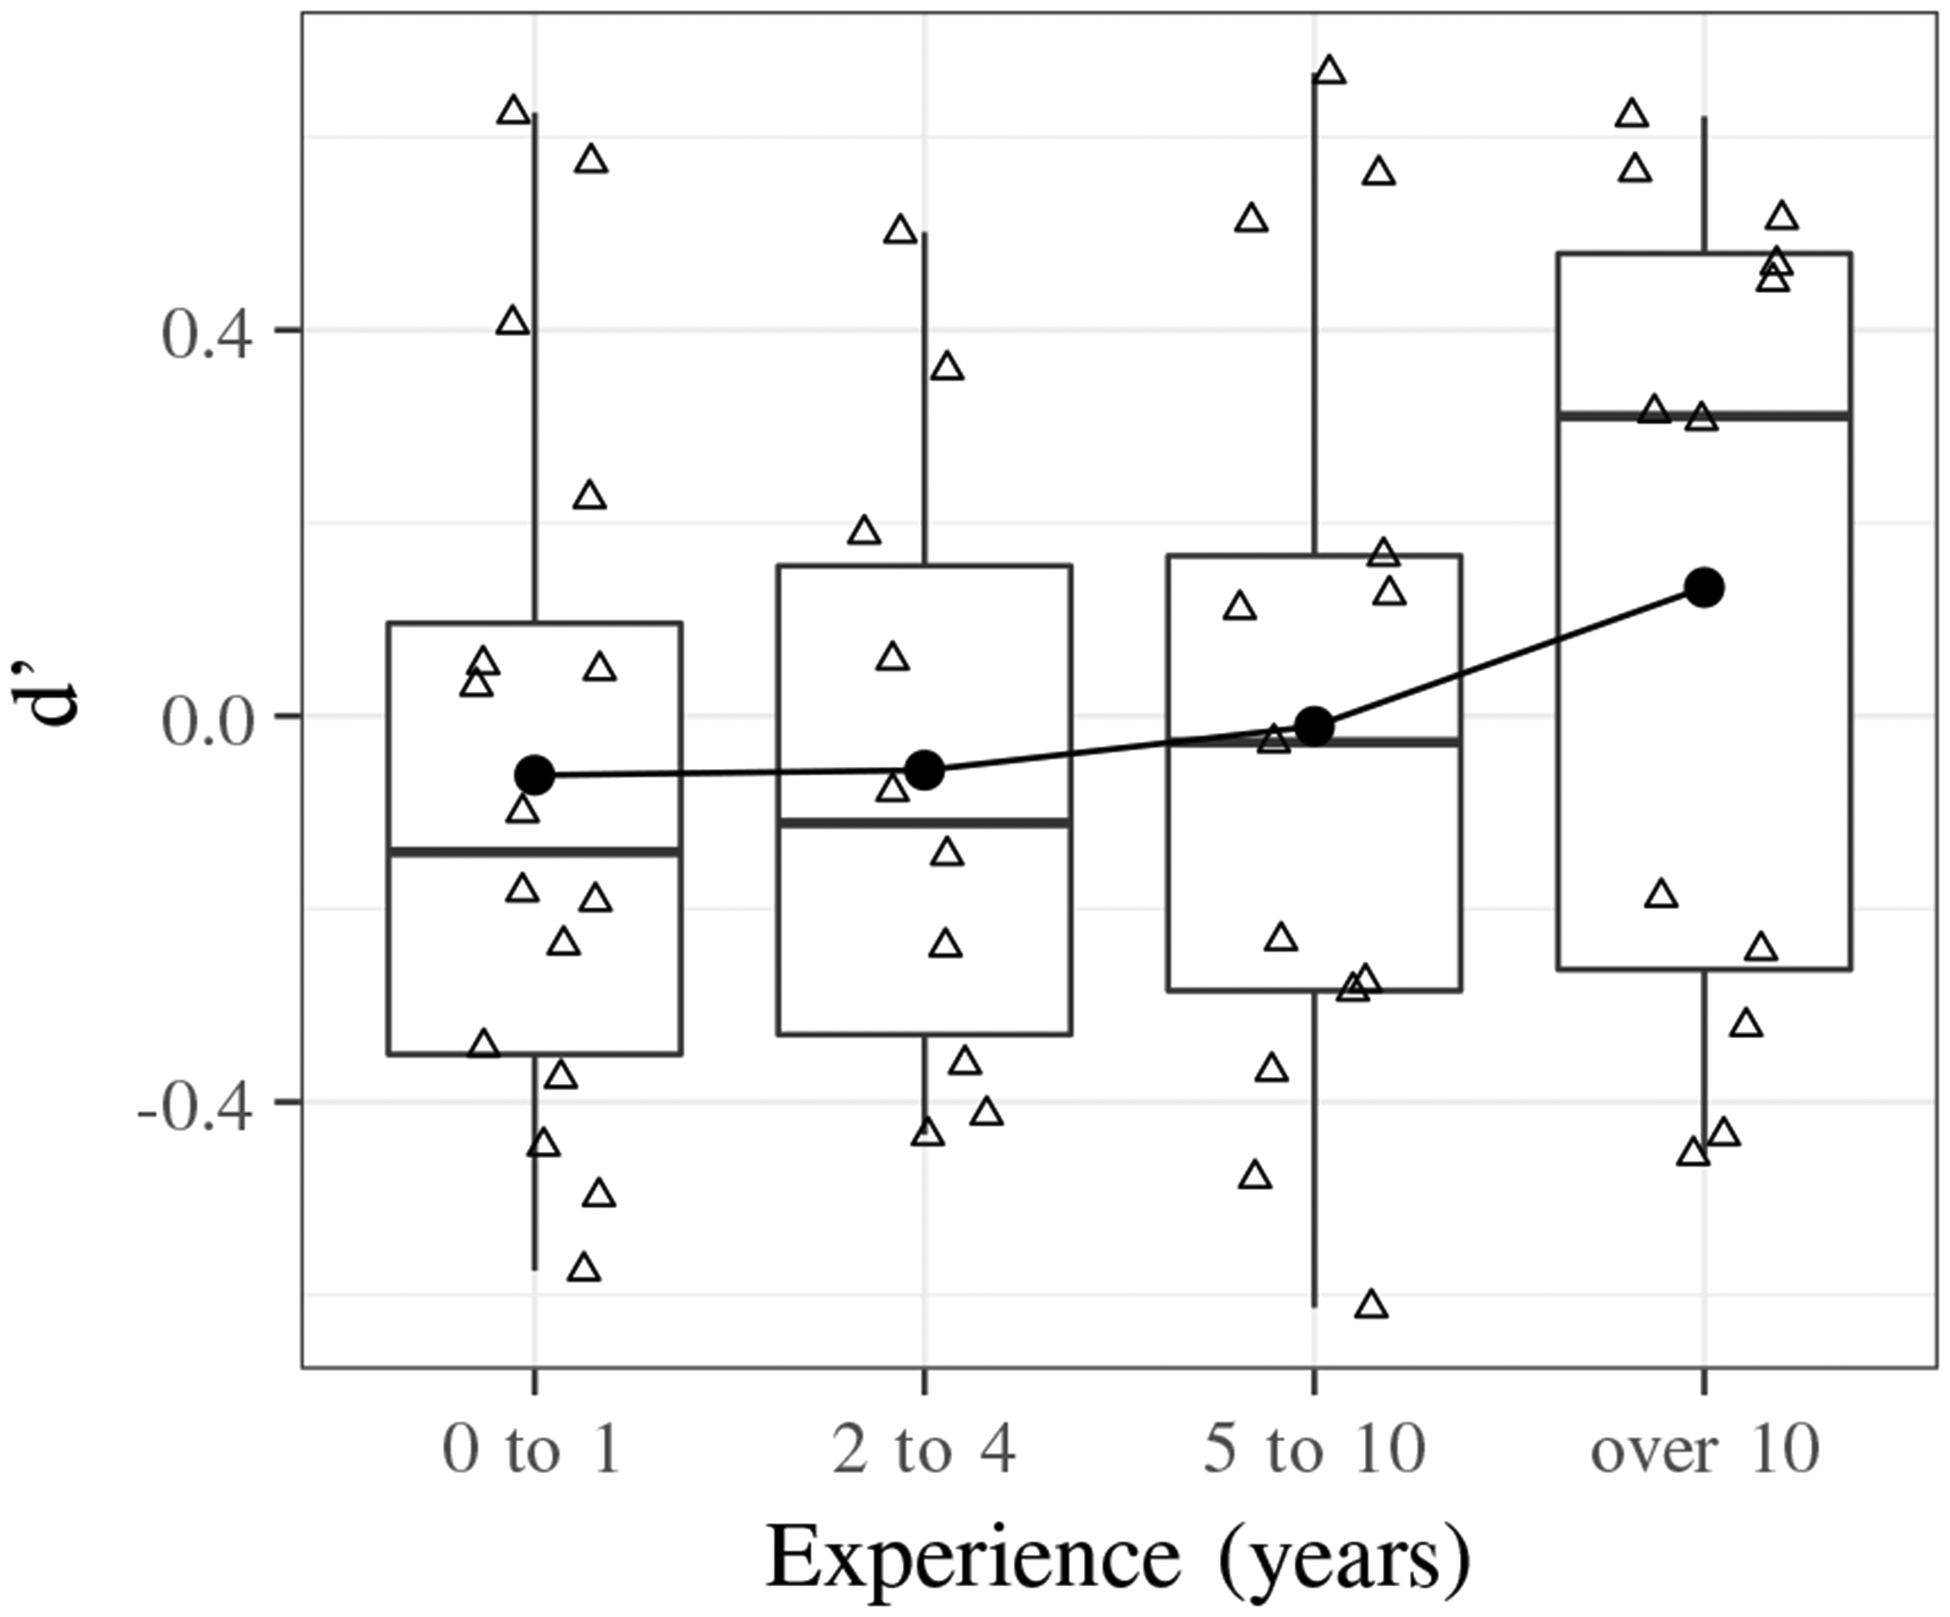
Boxplot that shows increasing average sensitivity index with years of experience using a stethoscope for acoustic to filtered transitions.
Fig. 9 shows the d’ values for each transition with change window lengths of 1.5, 1.6, and 1.7 seconds. Pairwise t-tests with the Bonferroni correction between the d’ values for each change window length for acoustic to electronic, acoustic to filtered, and electronic to filtered transitions show that there is no significant difference between the groups based on change window length (p > 0.19). This demonstrates the robustness of the analysis method and results with small changes around the chosen change window length of 1.6 seconds.
Fig. 9:
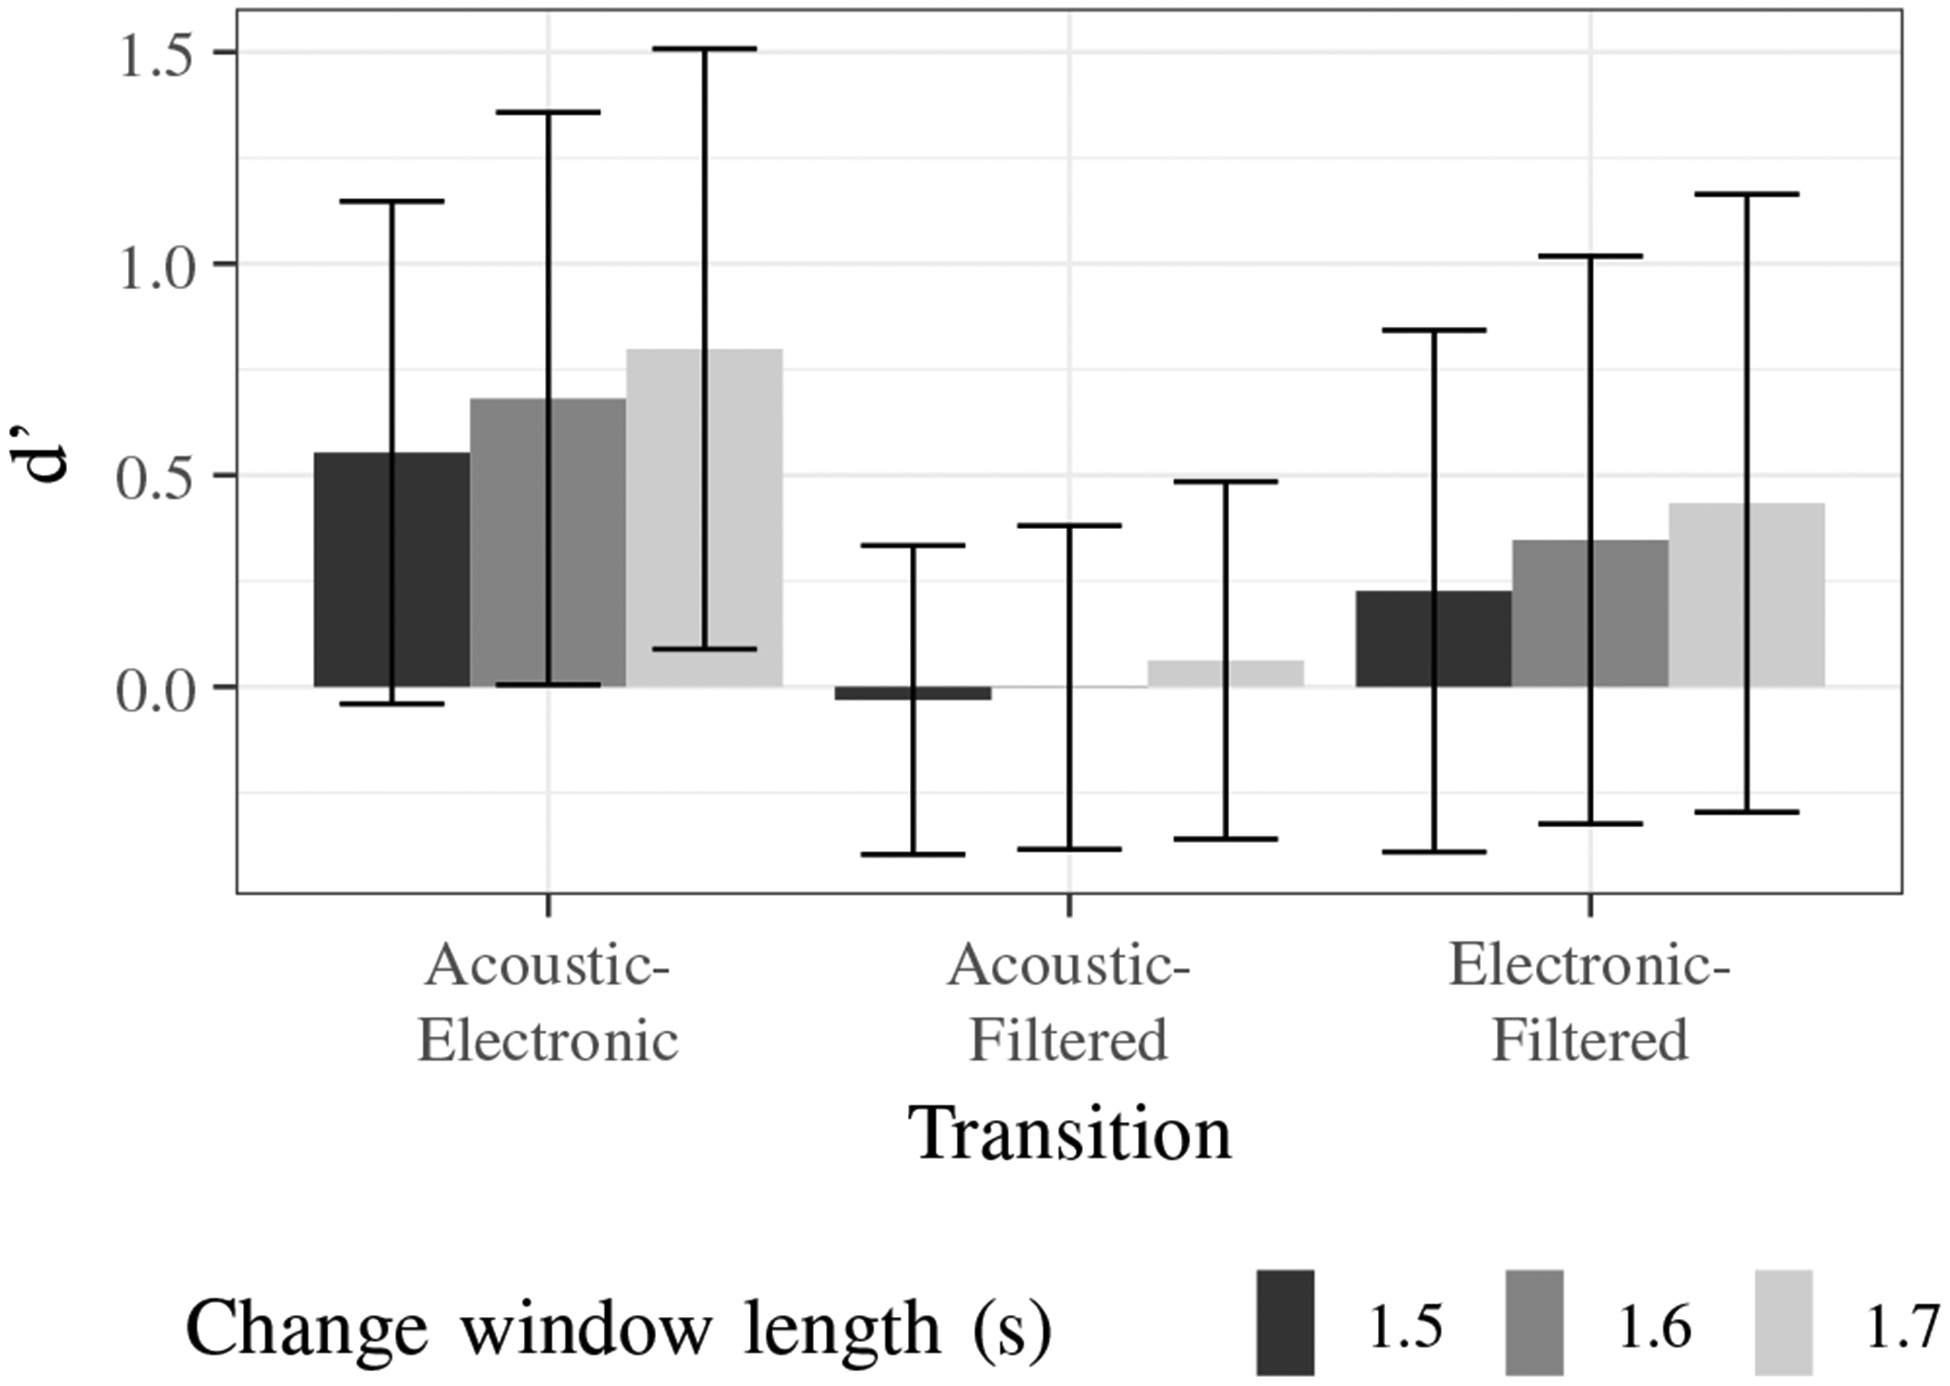
Sensitivity indices for each transition based on length of change window.
Overall, the statistical analysis demonstrates the effectiveness of the electronic stethoscope filtering to mimic an acoustic stethoscope by demonstrating that: (1) acoustic to filtered transitions are detected significantly less than acoustic to electronic or electronic to filtered transitions; (2) acoustic to filtered transitions are detected, on average, by chance; and (3) acoustic to filtered transition detections are not dependent on experience level.
V. Discussion
The calculated electronic-to-acoustic stethoscope filter was demonstrated to increase the perceived similarity between recorded acoustic and electronic stethoscope lung sounds for a panel of physicians. The sensitivity index of transitions between acoustic and filtered stethoscope sounds was significantly less than the sensitivity indices for other transitions and also had a mean value near zero. This indicates that, in general, clinicians did not differentiate between filtered and acoustic stethoscope sounds.
It is important to note the following when considering the results of the experiment described in this paper: (1) the use of preprocessing techniques to reduce background and electronic noise may affect the overall spectral shape of the recorded lung sounds; (2) the calculation of an average filter may not capture small differences between the acoustic and electronic stethoscopes; (3) it is unclear how the filtering impacts disease diagnosis since no data was collected from medical professionals on this point; and (4) the use of recordings of recordings for the listening experiment is non-ideal, but necessary for consistency with the listening experiment design.
In order to further validate the electronic-to-acoustic stethoscope filter calculation with an additional dataset, the filter was recomputed using recordings from [37] and [38]. Statistical analysis shows that the calculated electronic-to-acoustic stethoscope filter from a different dataset obtains quantitatively similar results for 501 of the 512 frequency points (p > 0.05). The 11 frequency points with statistically significant differences were concentrated in the frequency range of heart sounds, which were present in the additional clinical databases used, but not present in the original database used for the study presented in this work. This analysis indicates that the method is not sensitive to the choice of data used to calculate the filter in the frequency range of lung sounds. Details on additional processing can be found in the supplementary material.
Although a number of challenges remain, it is envisioned that this method could be applied to electronic stethoscopes in the future to allow physicians to switch between the sound characteristics of multiple acoustic and electronic stethoscopes in a single device. While the filtering may not be necessary in the long-term, it will be an invaluable tool to help physicians trained to use an acoustic stethoscope to adapt to the characteristics of electronic stethoscopes. The question that remains is how the improved subjective acoustic parameters translate to diagnosis from auscultation examination and adoption.
A number of follow-up studies would need to be conducted to validate this method for use in clinical practice and determine how it impacts overall adoption in the medical field. These studies would need to address: (1) real-time filtering for direct comparisons of the acoustic stethoscope and electronic stethoscope on real patients; (2) evaluation and optimization of the filter in the presence of background noise; (3) use of a larger variety of driving signals to obtain a stable approximation of the stethoscope filter; and (4) comparison against a larger selection of stethoscopes. The calculated filter is not meant to be generalized to be applied to any electronic stethoscope, such that it mimics an acoustic stethoscope. The filter was developed with a specific stethoscope pair (JHUscope with Littmann Cardiology II) to validate the equalization matching approach and new filters should be calculated for other stethoscope pairs. The results presented in this study form a strong foundation in improving the similarities between acoustic and electronic stethoscopes to perform these future investigations.
VI. Conclusion
With improvements in sound quality, the rise of telehealth, and capabilities to provide computer-aided auscultations, the stethoscope is currently amid a period of modernization after decades with the same basic design. Despite the electronic stethoscope’s technological advantages, the transition is moving slowly in practice and the device does not have widespread adoption among clinicians. The differences in sound characteristics are one barrier that deter physicians from moving from an acoustic to electronic stethoscope.
The presented method addresses the sound differences by calculating an electronic-to-acoustic stethoscope filter. Validated with a panel of clinicians, the electronic-to-acoustic stethoscope filter has been demonstrated to significantly increase the perceived similarity between recorded acoustic and electronic stethoscope lung sounds. The filtering method can provide a means to transition physicians from acoustic to digital stethoscopes and also be used as a training tool to assess the perceived auditory differences between the stethoscopes.
Supplementary Material
ACKNOWLEDGMENT
The authors would like to acknowledge support from R01HL133043 and R43MD014104 and also thank the listening experiment participants who volunteered their time and expertise for this study.
References
- [1].Laennec R and Osler W, De l’ auscultation mediate: Traite du diagnostic des maladies des poumons et du coeur. Paris, France: Brosson et Chaude, 1819, vol. 1. [Google Scholar]
- [2].Leng S, Tan RS, Chai KTC, Wang C, Ghista D, and Zhong L, “The electronic stethoscope,” BioMedical Engineering OnLine, vol. 14, no. 1, p. 66, July 2015. [DOI] [PMC free article] [PubMed] [Google Scholar]
- [3].Swarup S and Makaryus AN, “Digital stethoscope: technology update,” Medical Devices: Evidence and Research, vol. 11, pp. 29–36, 2018. [DOI] [PMC free article] [PubMed] [Google Scholar]
- [4].Silverman B and Balk M, “Digital stethoscope—improved auscultation at the bedside,” The American Journal of Cardiology, vol. 123, no. 6, pp. 984–985, 2019. [DOI] [PubMed] [Google Scholar]
- [5].Ramanathan A, Zhou L, Marzbanrad F, Roseby R, Tan K, Kevat A, and Malhotra A, “Digital stethoscopes in paediatric medicine,” Acta Paediatrica, vol. 108, no. 5, pp. 814–822, 2019. [DOI] [PubMed] [Google Scholar]
- [6].Lee K, Ni X, Lee JY, Arafa H, Pe DJ, Xu S, Avila R, Irie M, Lee JH, Easterlin RL, Kim DH, Chung HU, Olabisi OO, Getaneh S, Chung E, Hill M, Bell J, Jang H, Liu C, Park JB, Kim J, Kim SB, Mehta S, Pharr M, Tzavelis A, Reeder JT, Huang I, Deng Y, Xie Z, Davies CR, Huang Y, and Rogers JA, “Mechano-acoustic sensing of physiological processes and body motions via a soft wireless device placed at the suprasternal notch,” Nature Biomedical Engineering, vol. 4, no. 2, pp. 148–158, 2020. [DOI] [PMC free article] [PubMed] [Google Scholar]
- [7].Gupta P, Moghimi MJ, Jeong Y, Gupta D, Inan OT, and Ayazi F, “Precision wearable accelerometer contact microphones for longitu-dinal monitoring of mechano-acoustic cardiopulmonary signals,” npj Digital Medicine, vol. 3, no. 1, p. 19, 2020. [DOI] [PMC free article] [PubMed] [Google Scholar]
- [8].Klum M, Leib F, Oberschelp C, Martens D, Pielmus A, Tigges T, Penzel T, and Orglmeister R, “Wearable multimodal stethoscope patch for wireless biosignal acquisition and long-term auscultation,” in 2019 41st Annual International Conference of the IEEE Engineering in Medicine and Biology Society (EMBC), 2019, pp. 5781–5785. [DOI] [PubMed] [Google Scholar]
- [9].Chételat O, Wacker J, Rapin M, Porchet J, Meier C, Fahli A, Haenni E, Caldani L, Mancuso C, Paradiso R, and Arneth L, “New biosensors and wearables for cardiorespiratory telemonitoring,” in 2016 IEEE-EMBS International Conference on Biomedical and Health Informatics (BHI), 2016, pp. 481–484. [Google Scholar]
- [10].Krebs S and Van Drie M, “The art of stethoscope use: Diagnostic listening practices of medical physicians and ‘auto-doctors’,” ICON: Journal of the International Committee for the History of Technology, vol. 20, no. 2, pp. 92–114, 2014. [Google Scholar]
- [11].Huang M, Liu H, Pi X, Ao Y, and Wang Z, “Computer-aided diagnosis and new electronic stethoscope,” Chinese Journal of Medical Instrumentation, vol. 41, no. 3, pp. 161—165, May 2017. [DOI] [PubMed] [Google Scholar]
- [12].Makaryus AN, Makaryus JN, Figgatt A, Mulholland D, Kushner H, Semmlow JL, Mieres J, and Taylor AJ, “Utility of an advanced digital electronic stethoscope in the diagnosis of coronary artery disease compared with coronary computed tomographic angiography,” The American Journal of Cardiology, vol. 111, no. 6, pp. 786–792, March 2013. [DOI] [PubMed] [Google Scholar]
- [13].Grzywalski T, Piecuch M, Szajek M, Breborowicz A, Hafke-Dys H, Kocinski J, Pastusiak A, and Belluzzo R, “Practical implementation of artificial intelligence algorithms in pulmonary auscultation examination,” European Journal of Pediatrics, vol. 178, no. 6, pp. 883–890, 2019. [DOI] [PMC free article] [PubMed] [Google Scholar]
- [14].Barrett MJ, Mackie AS, and Finley JP, “Cardiac auscultation in the modern era: Premature requiem or phoenix rising,” Cardiology in Review, vol. 25, no. 5, 2017. [DOI] [PubMed] [Google Scholar]
- [15].Thompson WR, “In defence of auscultation: a glorious future?” Heart Asia, vol. 9, no. 1, pp. 44–47, 2017. [DOI] [PMC free article] [PubMed] [Google Scholar]
- [16].Frishman WH, “Is the stethoscope becoming an outdated diagnostic tool?” The American Journal of Medicine, vol. 128, no. 7, pp. 668–669, 2015. [DOI] [PubMed] [Google Scholar]
- [17].van der Wall EE, “The stethoscope: celebration or cremation after 200 years?” Netherlands Heart Journal, vol. 24, no. 5, pp. 303–305, 2016. [DOI] [PMC free article] [PubMed] [Google Scholar]
- [18].Weiss D, Erie C, Butera J, Copt R, Yeaw G, Harpster M, Hughes J, and Salem DN, “An in vitro acoustic analysis and comparison of popular stethoscopes,” Medical Devices: Evidence and Research, vol. 12, pp. 41–52, 2019. [DOI] [PMC free article] [PubMed] [Google Scholar]
- [19].Nowak LJ and Nowak KM, “Sound differences between electronic and acoustic stethoscopes,” BioMedical Engineering OnLine, vol. 17, no. 1, p. 104, 2018. [DOI] [PMC free article] [PubMed] [Google Scholar]
- [20].Kindig JR, Beeson TP, Campbell RW, Andries F, and Tavel ME, “Acoustical performance of the stethoscope: A comparative analysis,” American Heart Journal, vol. 104, no. 2, Part 1, pp. 269–275, 1982. [DOI] [PubMed] [Google Scholar]
- [21].Abella M, Formolo J, and Penney DG, “Comparison of the acoustic properties of six popular stethoscopes,” The Journal of the Acoustical Society of America, vol. 91, no. 4, pp. 2224–2228, 1992. [DOI] [PubMed] [Google Scholar]
- [22].Watrous RL, Grove DM, and Bowen DL, “Methods and results in characterizing electronic stethoscopes,” in Computers in Cardiology, 2002, pp. 653–656. [Google Scholar]
- [23].Drzewiecki G, Katta H, Pfahnl A, Bello D, and Dicken D, “Active and passive stethoscope frequency transfer functions: Electronic stethoscope frequency response,” in 2014 IEEE Signal Processing in Medicine and Biology Symposium (SPMB), 2014, pp. 1–4. [Google Scholar]
- [24].Grenier M-C, Gagnon K, Genest J, Durand J, and Durand L-G, “Clinical comparison of acoustic and electronic stethoscopes and design of a new electronic stethoscope,” The American Journal of Cardiology, vol. 81, no. 5, pp. 653–656, March 1998. [DOI] [PubMed] [Google Scholar]
- [25].Bank I, Vliegen HW, and Bruschke AVG, “The 200th anniversary of the stethoscope: Can this low-tech device survive in the high-tech 21st century?” European Heart Journal, vol. 37, no. 47, pp. 3536–3543, 2016. [DOI] [PubMed] [Google Scholar]
- [26].Soroush L, Hafeez-Baig A, and Gururajan R, “Clinicians’ perception of using digital stethoscopes in telehealth platform: Queensland telehealth preliminary study,” ACIS 2010 Proceedings - 21st Australasian Conference on Information Systems, December 2010. [Google Scholar]
- [27].Gururajan R, Tsai H-S, and Chen H, “Using digital stethoscopes in remote patient assessment via wireless networks: the user’s perspective,” International Journal of Advanced Networking and Applications, vol. 3, no. 3, pp. 1140–1146, 2011. [Google Scholar]
- [28].Wilkins L, Evaluating Heart and Breath Sounds, ser. Nursing Know-How. Lippincott Williams & Wilkins, 2009. [Google Scholar]
- [29].Kraman SS, Pressler GA, Pasterkamp H, and Wodicka GR, “Design, construction, and evaluation of a bioacoustic transducer testing (BATT) system for respiratory sounds,” IEEE Transactions on Biomedical Engineering, vol. 53, no. 8, pp. 1711–1715, 2006. [DOI] [PubMed] [Google Scholar]
- [30].Mansy HA, Grahe J, Royston TJ, and Sandler RH, “Investigating a compact phantom and setup for testing body sound transducers,” Computers in biology and medicine, vol. 41, no. 6, pp. 361–366, 2011. [DOI] [PMC free article] [PubMed] [Google Scholar]
- [31].Elhilali M and West JE, “The stethoscope gets smart: Engineers from Johns Hopkins are giving the humble stethoscope an AI upgrade,” IEEE Spectrum, vol. 56, no. 2, pp. 36–41, February 2019. [DOI] [PMC free article] [PubMed] [Google Scholar]
- [32].Gross V, Dittmar A, Penzel T, Schuttler F, and vonWichert P, “The relationship between normal lung sounds, age, and gender,” American Journal of Respiratory and Critical Care Medicine, vol. 162, no. 3, pp. 905–909, 2000. [DOI] [PubMed] [Google Scholar]
- [33].Loizou PC, Speech Enhancement: Theory and Practice, 2nd ed. Boca Raton, Florida, USA: CRC Press, 2013. [Google Scholar]
- [34].R 128 - Loudness Normalisation and Permitted Maximum Level of Audio Signals. European Broadcasting Union, 2014. [Google Scholar]
- [35].Boubenec Y, Lawlor J, Shamma S, and Englitz B, “Change detection in auditory textures,” in Physiology, Psychoacoustics and Cognition in Normal and Impaired Hearing, van Dijk P, Başkent D, Gaudrain E, de Kleine E, Wagner A, and Lanting C, Eds. Cham: Springer International Publishing, 2016, pp. 229–239. [Google Scholar]
- [36].Gallun FJ and Kampel SD, “Using detection theory to analyze human decision making and sensory processing,” Proceedings of Meetings on Acoustics, vol. 26, no. 1, p. 050004, 2016. [Google Scholar]
- [37].Rocha BM, Filos D, Mendes L, Serbes G, Ulukaya S, Kahya YP, Jakovljevic N, Turukalo TL, Vogiatzis IM, Perantoni E, Kaimakamis E, Natsiavas P, Oliveira A, Jácome C, Marques A, Maglaveras N, Pedro Paiva R, Chouvarda I, and de Carvalho P, “An open access database for the evaluation of respiratory sound classification algorithms,” vol. 40, no. 3, p. 035001, 2019. [DOI] [PubMed] [Google Scholar]
- [38].Graceffo S, Hussain A, Ahmed S, McCollum ED, and Elhilali M, “Validation of auscultation technologies using objective and clinical comparisons,” Proceedings of the annual conference of the Engineering in Medicine and Biology Society, to appear, 2020. [DOI] [PubMed] [Google Scholar]
Associated Data
This section collects any data citations, data availability statements, or supplementary materials included in this article.


