Abstract
The fatty acid desaturase 1 (FADS1), also known as delta‐5 desaturase (D5D), is one of the rate‐limiting enzymes involved in the desaturation and elongation cascade of polyunsaturated fatty acids (PUFAs) to generate long‐chain PUFAs (LC‐PUFAs). Reduced function of D5D and decreased hepatic FADS1 expression, as well as low levels of LC‐PUFAs, were associated with nonalcoholic fatty liver disease. However, the causal role of D5D in hepatic lipid homeostasis remains unclear. In this study, we hypothesized that down‐regulation of FADS1 increases susceptibility to hepatic lipid accumulation. We used in vitro and in vivo models to test this hypothesis and to delineate the molecular mechanisms mediating the effect of reduced FADS1 function. Our study demonstrated that FADS1 knockdown significantly reduced cellular levels of LC‐PUFAs and increased lipid accumulation and lipid droplet formation in HepG2 cells. The lipid accumulation was associated with significant alterations in multiple pathways involved in lipid homeostasis, especially fatty acid oxidation. These effects were demonstrated to be mediated by the reduced function of the peroxisome proliferator–activated receptor alpha (PPARα)–fibroblast growth factor 21 (FGF21) axis, which can be reversed by treatment with docosahexaenoic acid, PPARα agonist, or FGF21. In vivo, FADS1‐knockout mice fed with high‐fat diet developed increased hepatic steatosis as compared with their wild‐type littermates. Molecular analyses of the mouse liver tissue largely corroborated the observations in vitro, especially along with reduced protein expression of PPARα and FGF21. Conclusion: Collectively, these results suggest that dysregulation in FADS1 alters liver lipid homeostasis in the liver by down‐regulating the PPARα‐FGF21 signaling axis.
Abbreviations
- AA
arachidonic acid
- CoA
coenzyme A
- Cont.
control
- CPT
carnitine palmitoyltransferase
- D5D
delta‐5 desaturase
- DAPI
4′,6‐diamidino‐2‐phenylindole
- DGAT1
diacylglycerol O‐acyltransferase 1
- DGLA
dihomo‐gamma‐linolenic acid
- DHA
docosahexaenoic acid
- DNL
de novo lipogenesis
- ELISA
enzyme‐linked immunosorbent assay
- EMSA
electrophoretic mobility shift assay
- EPA
eicosapentaenoic acid
- ER
endoplasmic reticulum
- FADS1
fatty acid desaturase 1
- FASN
fatty acid synthase
- FF
fenofibrate
- FGF21
fibroblast growth factor 21
- Het
heterozygous
- HFD
high‐fat diet
- IACUC
Institutional Animal Care and Use Committee
- IL
interleukin
- KD
knockdown
- KO
knockout
- LC‐PUFA
long‐chain PUFA
- MDA
malondialdehyde
- mRNA
messenger RNA
- NAFLD
nonalcoholic fatty liver disease
- NASH
nonalcoholic steatohepatitis
- NT
vehicle
- OA
oleic acid
- ORO
Oil Red O
- OverExp
overexpression
- PA
palmitic acid
- PBS
phosphate‐buffered saline
- PCR
polymerase chain reaction
- PLIN2
perilipin 2
- PPARα
peroxisome proliferator–activated receptor alpha
- PPRE
peroxisome proliferator response element
- PUFA
polyunsaturated fatty acid
- ROS
reactive oxygen species
- shRNA
short hairpin RNA
- siRNA
small interfering RNA
- SREBF1
sterol regulatory element–binding transcription factor 1
- TG
triglyceride
- WT
wild‐type
Delta‐5 desaturase (D5D), or fatty acid desaturase 1 (FADS1), is one of the rate‐limiting enzymes in the polyunsaturated fatty acid (PUFA) desaturation pathway and is specifically involved in catalyzing the conversion of dihomo‐gamma‐linolenic acid (DGLA) (20:3n‐6) to arachidonic acid (AA) (20:4n‐6) and eicosatetraenoic acid (20:4n‐3) to eicosapentaenoic acid (EPA) (20:5n‐3) and docosahexaenoic acid (DHA) (22:6n‐3).( 1 ) A large number of genome‐wide association studies (GWASs) have documented an association between the FADS gene cluster (FADS1, FADS2, and FADS3) polymorphisms with hepatic function, endogenous long‐chain PUFA (LC‐PUFA) levels, the D5D/D6D activity that is indexed by the ratio of metabolites/substrates as well as other metabolic profiles.( 1 , 2 , 3 , 4 ) Our previous study revealed that the GWAS‐identified single‐nucleotide polymorphisms within the FADS gene cluster were significantly associated with FADS1 messenger RNA (mRNA) and protein expression, and reduced FADS1 expression was associated with increased total hepatic lipid content.( 4 ) Other human studies have frequently reported the association between decreased FADS1 expression and/or enzymatic activity with obese, nonalcoholic fatty liver disease (NAFLD) and other metabolic perturbations.( 5 , 6 , 7 ) However, the causal relationship between FADS1 function and these perturbations remains elusive.
Hepatic fat accumulation is the key step leading to NAFLD and a risk factor for cardiometabolic perturbations, including hyperlipidemia, hyperglycemia, and hypertension. Lipidomic studies conducted in both human and animal models of NAFLD have reported an elevation of saturated and monounsaturated fatty acids among the total fat, triglyceride (TG), and phospholipid pools in the liver, but a significant decrease in the levels of PUFAs, especially LC‐PUFAs, such as AA, EPA, and DHA.( 8 , 9 , 10 , 11 , 12 ) Furthermore, studies with mouse models with deficient n‐3 PUFA levels showed an exacerbated level of liver TGs and elevated macrovesicular lipid droplets in the liver histology.( 12 , 13 ) Fatty acid desaturation pathways are involved in generating essential PUFAs, such as DHA, EPA, and AA. Dysregulation of the involved enzymes in these pathways would shift the cellular lipid compositional balance. Unfortunately, the role of the FADS1 function in this biology has not yet been completely elucidated thus far.
In this study, we explore the role of FADS1 in hepatic lipid accumulation using both in vitro and in vivo models. Our study corroborates the hypothesis that down‐regulation of FADS1 increases susceptibility to hepatic steatosis. We also provide evidence that this process is mediated, at least in part, by the peroxisome proliferator–activated receptor alpha (PPARα)–fibroblast growth factor 21 (FGF21) signaling axis.
Materials and Methods
Detailed materials and methods are included in the Supporting Information.
Ethics Statement
The study was conducted in accordance with the Declaration of Helsinki. The animal experiments were approved by the Institutional Animal Care and Use Committee (IACUC) of both Texas A&M University (IACUC‐2014‐0335) and Wayne State University (IACUC‐18‐08‐0759).
Cell Lines and Treatments
Cell lines HepG2 and HuH7, as well as primary human hepatocytes, were used in this study. Cells were authenticated with microsatellite marker genotyping before the experiments. Primary hepatocytes (Thermo Fisher Scientific, Waltham, MA) were used once after thawing. Stable HepG2 cells with FADS1 knockdown (KD) were constructed as described in the Supporting Methods. To investigate the impact of FADS1 status on lipid accumulation and cell injuries, the stable FADS1‐KD cells were also transiently transfected with an adenovirus vector expressing FADS1 or control adenovirus. Cells were treated with a mixed palmitic acid (PA) and oleic acid (OA), DHA, FGF21, and/or PPARα agonist in different experiments (Supporting Methods).
Lipidomic Analysis of PUFAs in HepG2 Cells
To validate the impact of FADS1‐KD on PUFA metabolism in culture, HepG2 cells (control, KD, and overexpression) were expanded by incubating in regular media (Roswell Park Memorial Institute 1640 medium supplemented with 10% fetal bovine serum) for 72 hours. Cells were then washed twice with phosphate‐buffered saline (PBS) and collected with a rubber policeman. Total lipids were extracted according to the method of Folch et al.( 14 ) Briefly, total phospholipids were separated using 1‐dimensional thin‐layer chromatography on silica gel (60 gypsum) plates using chloroform/methanol/acetic acid/water (90:8:1:0.8 vol/vol/vol/vol) as the developing solvent. Isolated total phospholipids were then transesterified in 6% methanolic hydrochloric acid overnight at 76°C to 80°C, followed by gas chromatography–mass spectrometry analysis as previously established in our team.( 15 ) The experiment was conducted with four replicates.
BODIPY Staining of Neutral Lipids and Quantification
HepG2 stable cells (2 × 10⁴) (control, FADS1‐KD, and overexpression) were seeded into 35‐mm glass‐bottom cell culture dishes. After 24 hours of incubation, the media was removed and replaced with fresh media containing vehicle (bovine serum albumin), PA + OA (PA 0.3 mM, OA 0.4 mM), or PA + OA + DHA 25 μM for an additional 24‐hour incubation. Cells were then washed twice with PBS and fixed with 4% paraformaldehyde for 10 minutes. Cells were further washed twice with PBS and stained with a solution containing 5 μg/mL BODIPY and 1 μg/mL Hoechst 33342 (for nucleus staining). After 30 minutes of incubation at 37°C, cells were washed twice with PBS. Images were taken using a ZEISS laser scanning microscope 800 confocal microscopy (Carl Zeiss, Germany). ImageJ software was used for the quantification of fluorescent signals by analyzing six fields.
Oil Red O Staining for Lipid Accumulation
Cultured cells were fixed with formalin and stained with freshly prepared Oil Red O (ORO) stain, followed by extraction with isopropanol, and read at 492 nm. Cells were then stained with 4′,6‐diamidino‐2‐phenylindole (DAPI). The ORO read was then normalized to that of DAPI.
Quantification of TGs and Total Cholesterol
Total lipids were extracted with modified isopropanol:hexane extraction method.( 16 ) TG content in the dried lipids was quantified using the Infinity TG reagent (Thermo Fisher Scientific). For cholesterol, lipids were extracted from liver homogenates with chloroform:isopropanol:NP‐40 (7:11:0.1). The dried lipids were dissolved with assay buffer. The levels of total cholesterol were measured using a cholesterol assay kit according to the manufacturer’s instructions (Abcam, Cambridge, MA). The TG and cholesterol levels in cells or liver tissue were expressed as the ratio of total TG or cholesterol content in the cell lysate/tissue homogenate to the total protein levels in the lysate/homogenate.
Total Antioxidant Assay, Reactive Oxygen Species Production, and Lipid Peroxidation Analysis
The total antioxidant level in each sample was determined using a colorimetric assay by conversion of Cu2+ to Cu+ ( 17 ) (Abcam). Reactive oxygen species (ROS) production was assessed with CM‐H2DCFDA, Hoechst 33342, and MitoSOX Red (Thermo Fisher Scientific) staining followed by quantification with ImageJ.
Gene Expression, Western Blotting, and Enzyme‐Linked Immunosorbent Assay
The mRNA levels of key marker genes were quantified with real‐time polymerase chain reaction (PCR). Primer sequences are listed in Supporting Tables S1 and S2. Protein levels were demonstrated with western blotting using standard protocols established in the laboratory (see details in Supporting Methods). All primary antibodies, anti‐FADS1 (ab126706), anti‐PPARα (ab97609), anti‐β‐actin (ab6276), and anti‐FGF21 (ab171941) were purchased from Abcam. The FGF21 level in cell culture medium was measured with enzyme‐linked immunosorbent assay (ELISA) according to the manufacturer’s protocol (#DF2100; R&D Systems, Minneapolis, MN).
Electrophoretic Mobility Shift Assay
Electrophoretic mobility shift assay (EMSA) was used to verify the binding of PPARα onto the promoter of FGF21 under different conditions. Briefly, nuclear proteins were extracted using reagents from the Thermo Scientific NE‐PER Nuclear and Cytoplasmic Extraction kit. Binding reactions were prepared using the reagent components provided in the LightShift Chemiluminescent EMSA kit (Thermo Fisher Scientific) and synthesized probes (Supporting Table S3).
Data and Statistical Analysis
Statistical analyses were performed using GraphPad Prism 8.0. Data were analyzed using one‐way analysis of variance and Student t tests where appropriate. Unless further specified in the legend or noted in the figure, data are described as the mean ± SD of representative experiments, which were typically repeated three times independently. P values represent three significance levels (P ≤ 0.05, P ≤ 0.01, and P ≤ 0.001), with different labels indicating comparisons among different groups.
Results
FADS1 Expression Modulates Lipid and TG Accumulation In Vitro
We first aimed to explore the role of FADS1 in lipid homeostasis in vitro in human liver cells. To select the best cell model, we explored the protein expression levels of FADS1 in HepG2 and Huh7 cells by western blotting. The endogenous FADS1 expression level was higher in HepG2 than Huh7 cells (Fig. 1A). Subsequently, we manipulated FADS1 expression by knocking down and overexpressing FADS1 in HepG2 and Huh7, respectively (Fig. 1A).
FIG. 1.
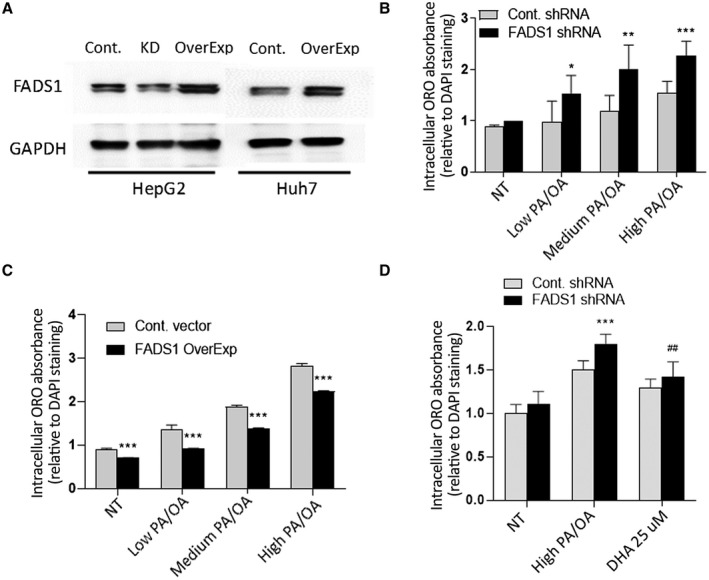
In vitro models for FADS1‐KD and overexpression by lentiviral vectors (*P < 0.05; **P < 0.01; ***P < 0.001). (A) Western blotting of FADS1 protein level in HepG2 (before and after short hairpin RNA treatment) and Huh7. (B) ORO extract absorbance normalized with mean DAPI measurement in control and FADS1‐KD HepG2 cells in medium supplemented with vehicle, low, medium, and high PA/OA for 24 hours. Statistical analysis is used to compare the ORO reading between FADS1‐KD cells and control cells. (C) ORO reading of Huh7 cells with or without FADS1 overexpression. (D) ORO reading of human primary hepatocytes with or without FADS1‐KD or FADS1‐KD with high PA/OA + 25 μM DHA treatment for 36 hours. Data of a representative experiment (in triplicates) of three independent performances are shown. Abbreviations: Cont., control; GAPDH, glyceraldehyde‐3‐phosphate dehydrogenase; NT, vehicle; OverExp, overexpression; shRNA, short hairpin RNA.
With these two cell lines, we initially explored the effect of FADS1 expression on lipid accumulation using ORO staining. Control and FADS1‐KD HepG2 cells treated with different PA/OA concentrations for 24 hours exhibited a dose‐dependent increase in neutral lipid staining compared with untreated cells (Fig. 1B). The PA/OA‐treated groups of the FADS1‐KD cells had significantly higher absorbance than the control cells. The measured neutral lipid levels in the FADS1‐KD cells were significantly higher compared with the control cells, which was observed primarily in the PA/OA‐treated groups (P < 0.01) (Fig. 1B). We next explored the effect of FADS1 overexpression on lipid accumulation in HuH7 cells. The levels of ORO absorbance were significantly lower in the FADS1 overexpressing cells relative to the control cells, and this was observed in both the untreated and PA/OA‐treated cells in a dose‐dependent manner (Fig. 1C). Taken together, FADS1 down‐regulation increased intracellular neutral lipids, whereas FADS1 up‐regulation reversed this process.
Given that both HepG2 and Huh7 are not typical hepatocytes, we also examined human primary hepatocytes to elucidate the role of FADS1 in lipid accumulation. FADS1‐KD and control primary hepatocytes incubated with two different concentrations of PA/OA for 36 hours exhibited dose‐dependent increased neutral lipid staining compared with the untreated cells (Fig. 1D). The stain extract absorbance was significantly higher in the FADS1‐KD cells (P < 0.001) compared with control cells (Fig. 1D).
To validate whether FADS1‐KD alters PUFA metabolism in the HepG2 cells, we conducted a lipidomic analysis to quantify the LC‐PUFAs incorporated into the phospholipid fraction. FADS1‐KD resulted in significantly reduced cellular levels of AA, EPA, DHA, the conversion rate of DGLA to AA (AA/DGLA), and the omega‐3 index (EPA/AA) (Table 1). Restoring the expression of FADS1 in the FADS1‐KD cells also restored the levels of AA and the AA/DGLA ratio, but not the levels of EPA, DHA, or EPA/AA ratio (Table 1).
TABLE 1.
Integrated PUFA Lipid Levels in Phospholipids* and Key Lipid Ratios in Control, FADS1‐KD (shRNA), and FADS1 Overexpressing Cells
| Lipid/Ratio | Cont. shRNA | FADS1 shRNA | FADS1 OverExp | P Value | ||||
|---|---|---|---|---|---|---|---|---|
| Mean | SD | Mean | SD | Mean | SD | Cont. vs. FADS1 shRNA | FADS1 shRNA vs. OverExp | |
| DGLA | 0.69 | 0.04 | 0.74 | 0.02 | 0.23 | 0.05 | 0.03 | <0.001 |
| AA | 4.14 | 0.22 | 2.56 | 0.06 | 3.11 | 0.08 | <0.001 | <0.001 |
| EPA | 0.49 | 0.04 | 0.27 | 0.02 | 0.25 | 0.01 | <0.001 | 0.03 |
| DHA | 2.43 | 0.25 | 1.88 | 0.06 | 1.81 | 0.04 | <0.01 | NS |
| AA/DGLA | 6.03 | 0.03 | 3.43 | 0.03 | 14.19 | 2.47 | <0.001 | <0.001 |
| EPA/AA | 0.12 | 0.00 | 0.10 | 0.00 | 0.08 | 0.00 | <0.01 | <0.001 |
Data are presented as mean ± SD of four replicates.
Mol percentage of total phospholipid.
Abbreviation: NS, not significant.
We further examined whether FADS1‐KD promoted the formation of lipid droplets. Indeed, KD of FADS1 significantly enhanced lipid droplet formation, even without incubation with free fatty acids (PA + OA). This process was reversed by restoring the expression of FADS1 or DHA supplementation (Fig. 2).
FIG. 2.
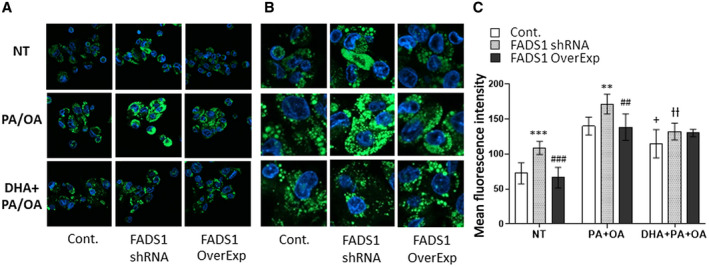
BODIPY staining of neutral lipids in HepG2 stable cells (control, KD, and overexpression in KD). Cells were treated with vehicle, including bovine serum albumin (NT group), PA + OA, or PA + OA + DHA. Images show lipid droplets in cells (green) and the cell nuclei (blue) under ×40 magnification (A), digitally amplified view of the images (B), and quantified mean fluorescent intensity (C) of the BODIPY signal based on six independent fields of view for each group. *P < 0.05, **P < 0.01, or ***P < 0.001 as compared with the control cells in each group; # P < 0.05, ## P < 0.01, or ### P < 0.001 as compared with the control cells in each group; + P < 0.05 as compared with the FADS1‐KD cells treated with PA + OA; ƚƚ P < 0.01 as compared with the FADS1‐KD cells treated with PA + OA. Data of a representative experiment (in triplicates) of two independent performances are shown.
Changes in Gene Expression Underlying FADS1‐KD‐Induced Lipid Accumulation
To delineate the molecular mechanisms driving lipid accumulation following FADS1 down‐regulation in HepG2 cells, we quantified the expression of key genes involved in fatty acid uptake, de novo lipogenesis (DNL), fatty acid oxidation, and TG synthesis and secretion (Fig. 3A). Comparable expression levels of the DNL master transcription factor sterol regulatory element–binding transcription factor 1 (SREBF1) were observed between FADS1‐KD and control cells. In comparison, the expression of fatty acid synthase (FASN) gene (P < 0.01) was significantly up‐regulated in the FADS1‐KD cells. More remarkably, the expression of the fatty acid oxidation markers, including PPARα gene carnitine palmitoyltransferases (CPT1A and CPT2), hydroxyacyl‐coenzyme A (CoA) dehydrogenase trifunctional multienzyme complex subunit alpha (HADHA) gene, and enoyl‐CoA hydratase (ECH1) gene (P < 0.001), were significantly down‐regulated in the FADS1‐KD cells. The expression of fatty acid uptake transporters was comparable between the FADS1‐KD and control cells, except for the significant down‐regulation of the scavenger receptor CD36 (P < 0.001) and significant up‐regulation of long‐chain fatty acid transporter solute carrier family 27 member 1 (SLC27A1) (P < 0.001) in FADS1‐KD cells when compared with the control cells. Gene encoding enzymes involved in TG synthesis, diacylglycerol O‐acyltransferase 1 (DGAT1) gene (P < 0.001) and lipid droplet coating protein, perilipin 2 (PLIN2) gene (P < 0.001), were both significantly up‐regulated in the FADS1‐KD cells, whereas markers involved in TG secretion, including apolipoprotein B (APOB) gene (P < 0.001) and transmembrane 6 superfamily member 2 (TM6SF2) gene (P < 0.001), were both significantly down‐regulated. On the other hand, we investigated the effects of FADS1 overexpression and DHA treatment on the levels of genes involved in lipid homeostasis and other liver cell injuries associated with FADS1‐KD. Transient re‐expression of FADS1 in the FADS1‐KD HepG2 cells did not change the expression of SREBF1 and FASN. However, when FADS1‐KD cells were treated with DHA, both markers—SREBF1 (P < 0.01) and FASN (P < 0.01)—were significantly down‐regulated. Both overexpression of FADS1 and DHA treatment were efficient in normalizing the expression of genes associated with fatty acid oxidation (e.g., PPARα, CPT1A, CPT2, HADHA, ECH1). We also observed significant down‐regulation of SLC27A1 (P < 0.05) and up‐regulation of CD36 (P < 0.001) in the FADS1‐KD cells when the FADS1 gene was overexpressed or when the cells were treated with DHA. Both overexpression of FADS1 and DHA treatment were effective in down‐regulating the DGAT1 expression. However, PLIN2, APOB, and TM6SF2 expression was only down‐regulated when FADS1 was re‐expressed but not when treated with DHA (Fig. 3A). Taken together, FADS1‐KD may increase lipid accumulation by regulating key genes involved in fatty acid oxidation and TG synthesis and secretion. This effect can be largely normalized by restoring the expression of FADS1 or DHA supplementation.
FIG. 3.
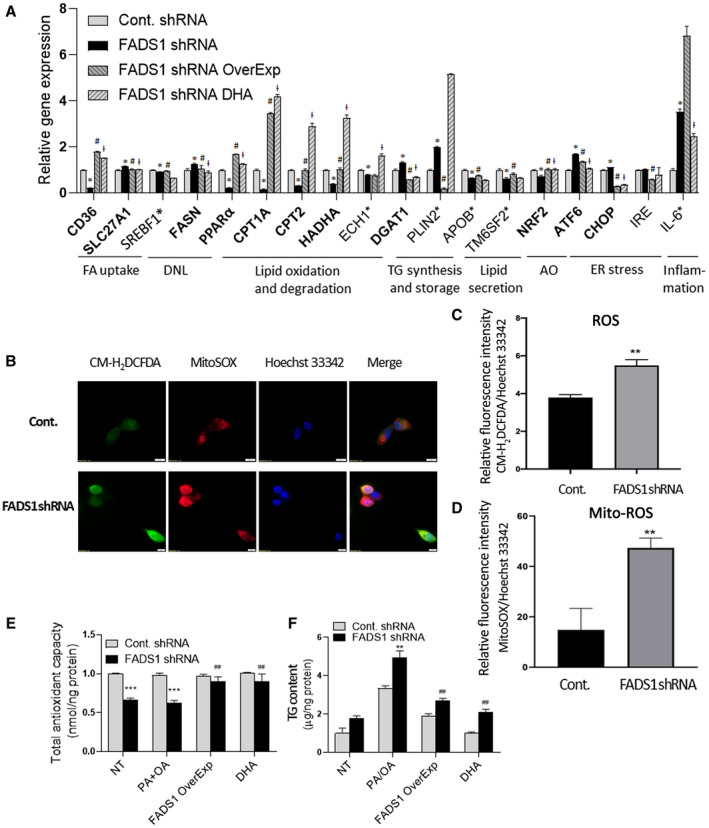
Reversal of the effects of FADS1‐KD by FADS1 OverExp or DHA treatment in HepG2 cells. (A) mRNA expression of marker genes in control cells, FADS1‐KD cells, FADS1‐KD cells with FADS1 overexpression, and FADS1‐KD cells treated with DHA (25 μM). Cells were incubated in regular media with vehicle or DHA treatment for 24 hours. Shown here are genes significantly (*P < 0.05) altered in the FADS1‐KD cells as compared with the control cells, which are also reversed by both FADS1 overexpression and DHA treatment (gene names in bold), significantly altered in FADS1‐KD but reversed by either FADS1 overexpression (# P < 0.05) or DHA treatment (ƚ P < 0.05) (gene names labeled with asterisk). (B) Assessment of ROS production in HepG2 control and FADS1‐KD cells with CM‐H2DCFDA (general oxidative stress indicator) and MitoSOX Red (mitochondrial ROS indicator). Hoechst 33342 was used for staining the nuclei. (C,D) Quantification of cellular ROS and mitochondrial ROS level. (E) Total antioxidant levels measured by a colorimetric assay indexed by the conversion of Cu2+ to Cu+ in FADS1‐KD and control HepG2 cells treated with vehicle (NT) or medium containing PA/OA (all other three groups) for 24 hours. (F) Total TG levels in FADS1‐KD and control HepG2 cells in vehicle (NT) and medium level of PA/OA supplemented medium (other three groups) for 24 hours. *P < 0.05, **P < 0.01, or ***P < 0.001 as compared with the control shRNA cells; # P < 0.05, ## P < 0.01, or ### P < 0.001 as compared with the FADS1‐KD cells treated with PA/OA. Data of a representative experiment (in triplicates) of three independent performances are shown. Abbreviations: AO, antioxidant; FA, fatty acid; IRE, inositol requiring enzyme; mito‐ROS, mitochondrial ROS.
FADS1 KD and Other Cellular Challenges
We set out to further explore the potential impact of FADS1 down‐regulation on other cellular changes underlying hepatocyte injuries, including lipid peroxidation, inflammatory cytokine levels, antioxidant capacity, and markers of endoplasmic reticulum (ER) stress. There was no significant difference in total malondialdehyde (MDA) (a PUFA peroxidation and oxidative stress marker) levels in the FADS1‐KD cells when compared with control cells (data not shown). However, both the intercellular and mitochondrial ROS levels in the FADS1‐KD cells were significantly higher than in the control cells (Fig. 3B‐D). In addition, the total antioxidant level in the FADS1‐KD cells was significantly lower than in the control cells in both untreated and PA/OA‐treated cells (Fig. 3E). This is consistent with the significant down‐regulation of antioxidant mediator nuclear erythroid 2 p45‐related factor 2 (NRF2) gene (P < 0.001) in the FADS1‐KD cells (Fig. 3A). Meanwhile, we observed a significant up‐regulation of ER stress markers, activating transcription factor 6 (ATF6) gene (P < 0.001), and C/EBP homologous protein (CHOP) gene (P < 0.05) (Fig. 3A). There was a substantial increase in the expression of the inflammatory marker interleukin‐6 (IL‐6) (P < 0.001) (Fig. 3A) in the FADS1‐KD cells. Again, the altered total antioxidant level and the transcription of most of the marker genes in the FADS1‐KD cells were normalized by either FADS1 overexpression or DHA treatment (Fig. 3). Together, these data indicate that FADS1‐KD significantly reduced cellular antioxidant levels, increasing susceptibility to ER stress and hepatic inflammation.
FADS1‐KD Leads to Alteration in the PPARα‐FGF21 Axis
We further set out to investigate the molecular mechanism driving the increased susceptibility of FADS1‐deficient cells to lipid accumulation. Given the significant regulation of PPARα expression by FADS1 in our model, we hypothesized that PPARα is a key mediator for FADS1‐dependent lipid accumulation. PPARα is a ligand‐activated factor that plays an important role in regulating fatty acid and lipid metabolism. EPA, DHA, and docosapentaenoic acid have been identified as natural ligand inducers of PPARα.( 18 , 19 ) PPARα regulates numerous genes, among which FGF21 is one of the most important effectors.( 20 , 21 , 22 , 23 ) Both PPARα (P < 0.001) and FGF21 (P < 0.001) mRNA expression were significantly down‐regulated in the FADS1‐KD HepG2 cells compared with the control cells (Fig. 4). The expression of both genes was significantly up‐regulated when the FADS1 gene was overexpressed in FADS1‐KD cells and when the FADS1‐KD cells were treated with DHA (Fig. 4A). Similar results were observed when PPARα and secreted FGF21 protein expression were analyzed using western blot (Fig. 4B) and ELISA (Fig. 4C), respectively. These results suggest that FADS1 deficiency modulates both PPARα and FGF21 mRNA and protein expression levels. Thus, the PPARα‐FGF21 axis may be essential to maintaining the protective effects of FADS1 against lipid accumulation.
FIG. 4.
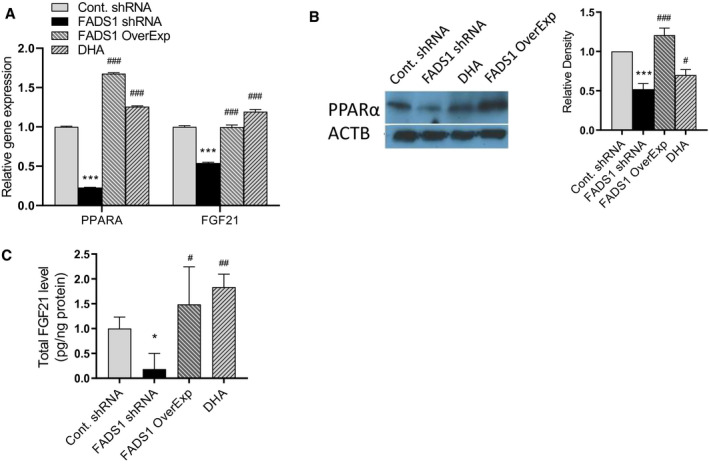
Expression of PPAR‐α and FGF21 following manipulations of FADS1 function. (A) Quantitative PCR mRNA expression of PPAR‐α and FGF21 in control, FADS1‐KD, FADS1‐KD with FADS1 overexpression, and FADS1‐KD with DHA‐treated HepG2 cells. Cells were treated with medium level of PA/OA for 24 hours. Protein level of PPAR‐α (western blot) in the cells (B) and secreted FGF21 (ELISA) (C) in collected medium after treated under the same condition as in (A). *P < 0.05, **P < 0.01, or ***P < 0.001 as compared with the control group; # P < 0.05, ## P < 0.01, or ### P < 0.001 as compared with the FADS1‐KD cells treated with PA/OA. Data of a representative experiment (in triplicates) of three independent performances are shown. Abbreviation: ACTB, actin beta.
PPARα is known as a master transcription factor regulating FGF21 transcription.( 21 , 22 , 23 , 24 ) To further illustrate the regulation and transcription activity of FGF21 by PPARα, we examined the binding activity of peroxisome proliferator response elements (PPREs) in the FGF21 promoter region in our FADS1‐KD and control cells using an EMSA. For this purpose, the FGF21 promoter oligonucleotide probe containing the previously identified( 21 , 22 , 23 , 24 ) PPRE binding sequence was used. Binding activities of the nuclear extract from FADS1‐KD cells were significantly decreased when compared with the nuclear extract from the control (Fig. 5A). Following FADS1 gene overexpression in the FADS1‐KD cells or when the FADS1‐KD cells were treated with DHA, the binding activity of the FGF21 promoter probe with their nuclear extracts was significantly enhanced as compared with the FADS1‐KD cells (Fig. 5A). This finding suggests that reduced function of FADS1 decreased the amount of LC‐PUFAs, such as DHA, which further reduced the binding activity of PPARα toward the FGF21 promoter, which in turn down‐regulated FGF21 expression.
FIG. 5.
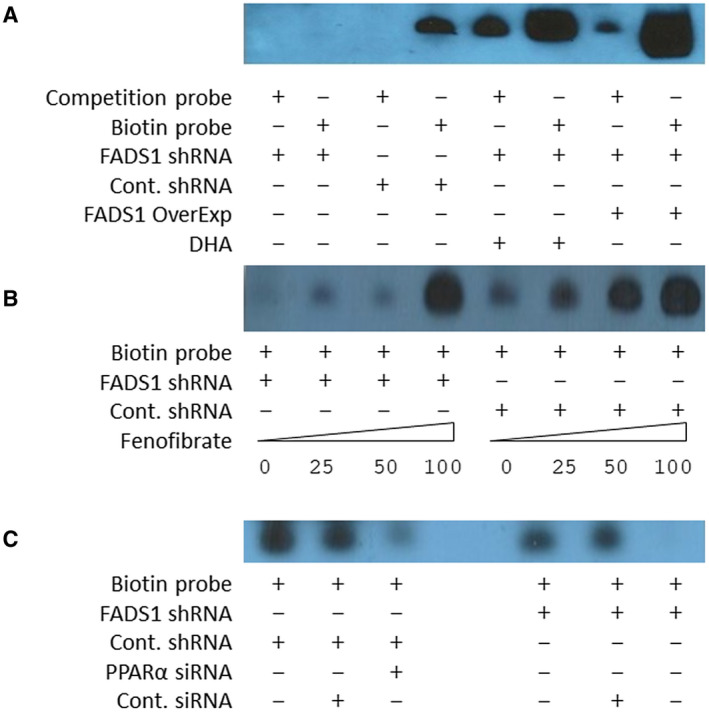
FADS1 regulates the binding affinity of PPAR‐α to the FGF21 promoter. (A) Binding activities of nuclear extract from control, FADS1‐KD, FADS1‐KD + overexpression, and FADS1‐KD + DHA‐treated HepG2 cells with respect to the FGF21 promoter probe containing the PPRE motif. Competition was performed using excessive unlabeled probe. (B) Binding activities of nuclear extract from control and FADS1‐KD HepG2 cells treated with FF (PPARα agonist) with different concentration to the FGF21 promoter PPRE probe. (C) Binding activities of nuclear extract from control and FADS1‐KD cells treated with control and PPAR‐α siRNA with respect to the FGF21 promoter PPRE probe. Data of a representative experiment (in triplicates) of two independent performances are shown.
To further confirm that PPARα mediates the FGF21 promoter binding differences observed in the nuclear extracts from the FADS1‐KD cells, both FADS1‐KD and control cells were treated with fenofibrate (FF), a PPARα agonist (Fig. 5B), or transfected with PPARα small interfering RNA (siRNA) (Fig. 5C). In the presence of serial concentrations of FF, nuclear extracts from both FADS1‐KD and control cells exhibited a dose‐dependent increase of FGF21 promoter binding with increasing concentrations of FF, confirming an elevated binding of PPARα to the FGF21 promoter. In contrast, when FADS1‐KD and control cells were transfected with PPARα siRNA, the FGF21 promoter binding activity was significantly reduced in both FADS1‐KD and control cells, confirming the reduction in FGF21 promoter binding due to the reduced expression of PPARα. These results collectively suggest that decreased FADS1 reduced FGF21 promoter binding activity by down‐regulation of both PPARα expression and activity. However, following FADS1 reintroduction into the FADS1‐KD cells or when the FADS1‐KD cells were treated with DHA, the altered FGF21 promoter binding activity was restored.
Treating Cells With PPARα Agonist or FGF21 Protein Attenuates FADS1‐KD‐Dependent Lipid Accumulation
To investigate whether the up‐regulation of PPARα‐FGF21 in FADS1‐KD cells protects against lipid accumulation, we examined the effects of FF and FGF21 protein in ameliorating lipid accumulation in the FADS1‐KD cells. Co‐administration of FF (50 nM) with PA/OA reduced and normalized lipid accumulation in FADS1‐KD cells (P < 0.01) to the level of the control group (Fig. 6A). This suggests that increasing PPARα expression and activity in the FADS1‐KD cells rescues cells from elevated lipid accumulation. Similarly, when the FADS1‐KD cells were treated with PA/OA and FGF21 protein at two different concentrations, the lipid accumulation level in the FADS1‐KD cells was significantly reduced (P < 0.001) and normalized to control levels (Fig. 6B). This further confirms that the reduced PPARα and FGF21 expression and activity in FADS1‐KD cells increase the susceptibility of the cells to lipid accumulation. Enhancing the PPARα‐FGF21 axis in the FADS1‐deficient cells plays a protective role against lipid accumulation.
FIG. 6.
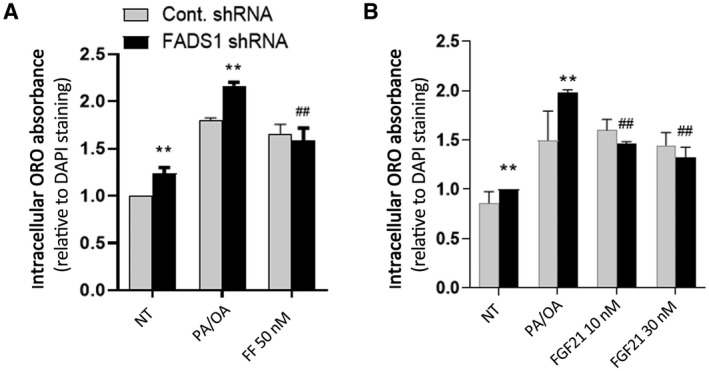
Reversal of the FADS1‐KD effects with FF (A) or FGF21 (B) treatment. Control or FADS1‐KD HepG2 cells were treated with vehicle (NT), medium PA/OA, medium PA/OA + FF (50 nM), or medium PA/OA + FGF21 protein (10 nM and 30 nM) for 24 hours. *P < 0.05, **P < 0.01, or ***P < 0.001 as compared with the control shRNA cells; # P < 0.05, ## P < 0.01, or ### P < 0.001 as compared with the FADS1‐KD cells treated with PA/OA. Data of a representative experiment (in triplicates) of independent performances are shown.
Fads1 Null Mice Displayed Increased Hepatic Steatosis and Hypertriglyceridemia After Exposure to a High‐Fat Diet
After feeding a high‐fat diet (HFD) for up to 8 weeks, wild‐type (WT), heterozygous (Het), and null mice showed similar body weight (Supporting Fig. S1A). There was no significant difference in the liver weight or liver‐to–body weight ratios among the null, Het, and WT mice at 0, 4, or 8 weeks of HFD (Supporting Fig. S1B,C). Histologic evaluation was used to compare the development of steatosis in Fads1 null and WT mice. The hematoxylin and eosin–stained liver sections showed no presence of inflammation, ballooning, or fibrosis in mice at both 4 and 8 weeks of HFD feeding (Fig. 7A). Fads1 null mice showed increased hepatic lipid droplets staining (ORO), consistent with elevated hepatic TG levels compared with the WT mice at 4 weeks of HFD feeding (Fig. 7B). Similarly, changes in hepatic TG levels were consistent with histological evaluation, showing a linear trend of hepatic TG increase at both 4 and 8 weeks from WT to null mice (linear trend P = 0.0001 and P = 0.045, respectively) (Fig. 7C). Interestingly, hepatic total cholesterol levels also showed an increasing linear trend from WT to null mice at both 4 and 8 weeks (linear trend P = 0.014 and P = 0.05, respectively) (Fig. 7D) of HFD feeding, with the null mice having a significantly higher hepatic total cholesterol level as compared with the WT mice.
FIG. 7.
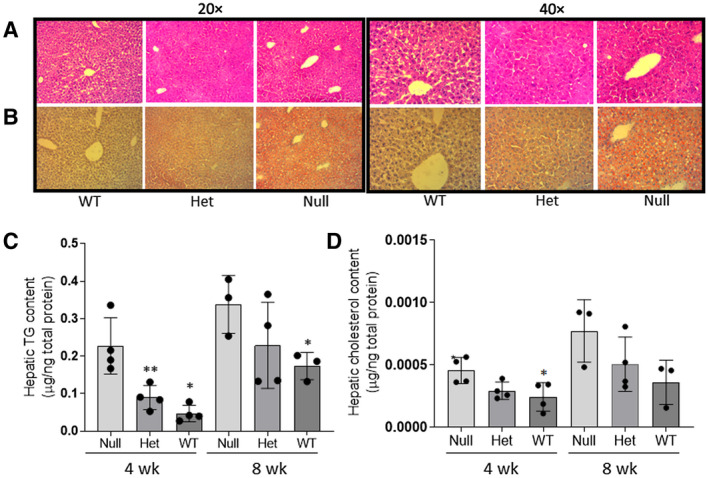
Effect of Fads1‐KO on liver histology (A), lipid droplet formation (B), total hepatic TG (C), and total cholesterol levels (D). Liver histology was demonstrated with hematoxylin and eosin staining, and lipids droplets are shown with ORO staining. Both were from mice fed with HFD for 4 weeks, and the tissue section was visualized at ×20 magnification for total TG levels in FADS1 null, Het, and WT mice fed with HFD for 4 and 8 weeks. *P < 0.05 or **P < 0.01 as compared with the WT mice. (C,D) Data were generated through a single experiment in triplicates. Abbreviation: wk, weeks.
To further analyze other potential liver injuries in the Fads1 null mice, we measured total MDA and total antioxidant levels in WT, Het, and null mice. There were no significant differences in the total MDA levels among WT, Het, and null mice, and this was observed across all time points of HFD feeding. Similarly, there were no significant differences in the total antioxidant levels among WT, Het, and null mice at both 4 and 8 weeks of HFD feeding (data not shown).
Fads1 Null Mice Exhibit Increased Gene Expression Involved in Lipid Metabolism
In complementary liver assays, we analyzed key genes involved in fatty acid oxidation, lipogenesis, and TG synthesis and secretion in the 4‐week‐treated mouse cohort. The expression of Srebf1 (P < 0.05) and Fasn (P < 0.05) were significantly up‐regulated in the Fads1 null mice when compared with the WT mice. Similar to our in vitro findings, a key transcription factor Pparα (P < 0.001) and fatty acid oxidation transporter Cpt2 (P < 0.01) were down‐regulated in the Fads1 null mice. The expression of Dgat1 (P < 0.05), Plin2 (P < 0.05), and Plin4 (P < 0.05) was also significantly up‐regulated in the Fads1 null mice when compared with WT mice, suggesting increased TG synthesis and lipid droplet formation. However, the markers involved in TG secretion did not show any significant changes. Taken together, these results indicate that Fads1 knockout (KO) in mice leads to increased TG accumulation by altering the function of genes involved in lipogenesis, fatty acid oxidation, and TG synthesis and storage. Furthermore, the expression of two inflammatory markers, Cd68 (P < 0.001) and Il‐6 (P < 0.01), was significantly up‐regulated in the Fads1 null mice when compared with the WT mice, despite the fact that inflammatory histological changes in the liver sections were not observed. In addition, there was no significant difference in the expression of ER stress marker Atf6 expression level between the Fads1 null and WT mice (Fig. 8A).
FIG. 8.
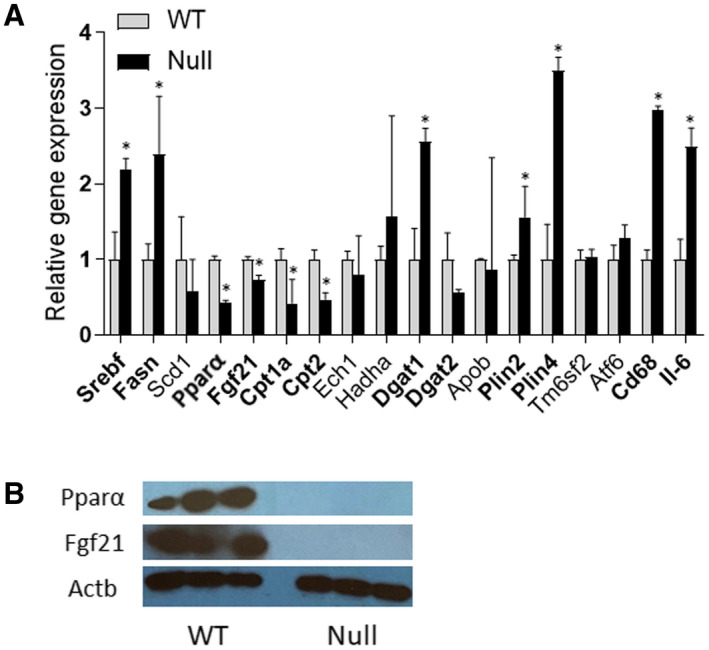
Effect of Fads1‐KO on marker gene expression (quantitative PCR mRNA levels) (A) and Ppar‐α and Fgf21 protein levels in the liver tissue of null and WT mice (4‐week feeding with HFD) (B). *P < 0.05 as compared with the WT. Data were generated through a single experiment in triplicates. Abbreviations: Abbreviation: Actb, actin beta; Scd1, stearoyl‐CoA desaturase.
Pparα‐Fgf21 Axis Is Associated With Fads1 Status In Vivo
We next sought to investigate whether the PPARα‐FGF21 axis is perturbed in the 4‐week HFD‐fed Fads1 null mouse model. Interestingly, the mRNA (Fig. 8A) and protein (Fig. 8B) expression levels of both Pparα (P < 0.001) and Fgf21 (P < 0.01) were significantly down‐regulated in the Fads1 null mice when compared with the WT mice, suggesting that Fads1‐dependent alteration of the Pparα‐Fgf21 axis is one of the primary effectors in inducing steatosis and TG accumulation in the liver.
Discussion
Our study demonstrates that the D5D plays a role in hepatic lipid accumulation, suggesting that LC‐PUFA biosynthesis is important for hepatic lipid homeostasis, which may be underlying other hepatic injuries (e.g., oxidative and ER stress). We also showed that this effect is, at least in part, mediated by the PPARα‐FGF21 axis (Fig. 9). Hepatic lipid accumulation is central to NAFLD and nonalcoholic steatohepatitis (NASH) and is a risk factor for many other chronic metabolic perturbations. Given the incomplete understanding in the role of PUFA in mediating these perturbations, our findings provide a mechanistic framework to help elucidate the interplay among genetics, PUFA metabolism, and metabolic disorders.
FIG. 9.
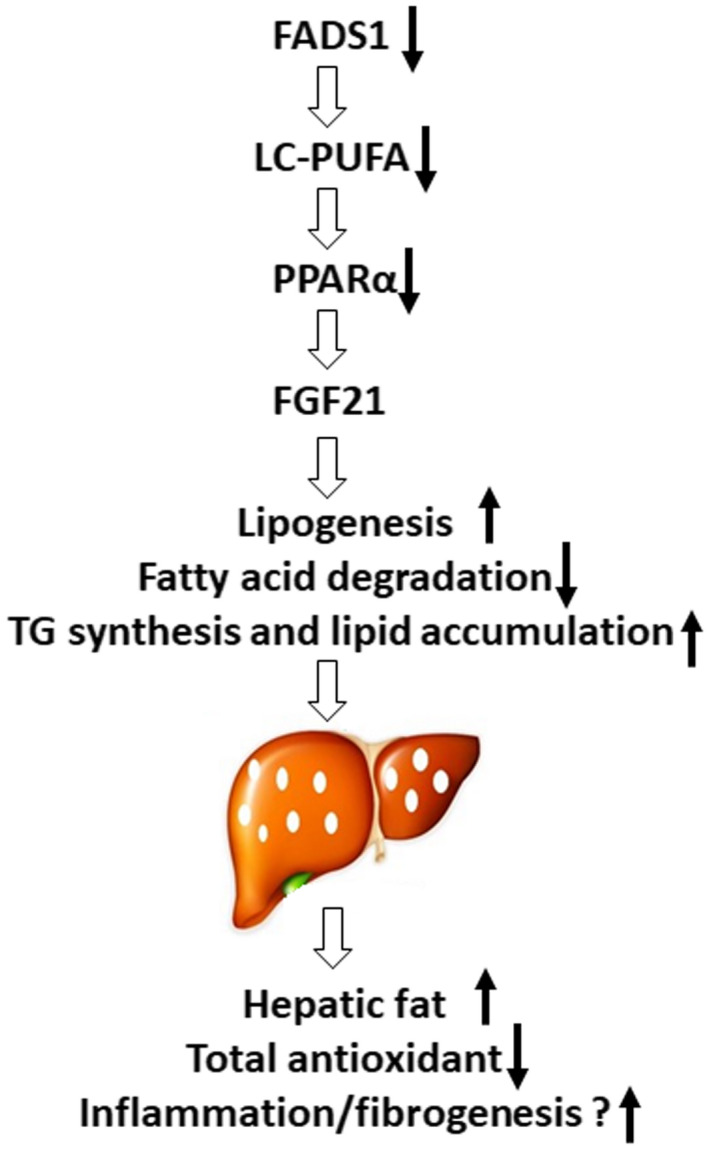
Summary schematic of the findings of the current study. Reduced FADS1 expression alters the endogenous production of LC‐PUFA and further suppresses the PPARα‐FGF21 axis signaling, resulting in the altered fatty acid oxidation and homeostasis. This ultimately drives TG and cholesterol accumulation in the liver.
Using an in vitro HepG2 cell model, we showed that reduced FADS1 expression is associated with intracellular lipid accumulation, and this phenotype is exacerbated when cells were treated with free fatty acids. Furthermore, FADS1‐KD cells were phenotypically rescued following FADS1 gene overexpression or treatment with DHA. Consistent with these findings, Fads1 null mice consuming HFD exhibited an increased hepatic steatosis characterized by accumulated hepatic TG and cholesterol levels compared with the Het and WT mice. These complementary in vitro and in vivo data confirmed that down‐regulation of the FADS1 gene increases the susceptibility to hepatic lipid accumulation, whereas higher expression of FADS1 protects cells from lipid accumulation. Our findings are consistent with studies reporting decreased FADS1 activity in patients with NAFLD.( 6 , 7 ) However, none of these studies deciphered the molecular mechanism by which dysregulation of FADS1 exacerbates fatty acid–induced hepatic steatosis. Thus, it is noteworthy that our findings provide direct evidence that fills this knowledge gap. Meanwhile, the beneficial effect of DHA in ameliorating TG accumulation as seen in the FADS1‐KD cells is consistent with studies reporting the benefits of omega‐3 PUFA treatments for reducing steatosis and liver fat in animal models( 25 , 26 , 27 , 28 , 29 ) and clinical trials,( 30 , 31 ) including our recent study in a pediatric population in which children with NAFLD carrying the low‐function FADS1 alleles possessed a better response to DHA supplementation in terms of their liver histology.( 32 )
Mechanistically, our study indicates that FADS1 down‐regulation significantly alters multiple canonical pathways involved in lipid homeostasis. More specifically, FADS1‐KD enhances the expression of genes modulating lipogenesis as well as TG synthesis and storage, while decreasing transcription of genes involved in fatty acid oxidation and TG secretion. This pattern was largely consistent between in vitro and in vivo models, suggesting that FADS1 plays a broad role in lipid metabolism homeostasis. Importantly, the deviation of these fatty acid metabolism pathways was reversed when the FADS1 gene expression was restored and/or when FADS1‐KD cells were treated with DHA.
We further found that the impact of FADS1 on hepatic lipid metabolism may be mediated by the PPARα‐FGF21 axis signals. PPARα is a ligand‐activated factor that plays an important role in regulating fatty acid and lipid metabolism. LC‐PUFAs (e.g., DHA) are one of the most important natural ligands of PPARα.( 18 , 19 , 33 ) Studies conducted in animals have consistently reported the significance of PPARα expression in steatosis and NASH. PPARα null mice develop aggressive steatohepatitis when fed with HFD or methionine‐choline–deficient diet.( 34 , 35 , 36 , 37 ) Severe steatosis formation was observed in both whole‐body PPARα null mice as well as in mouse models with hepatocyte‐specific deletion of PPARα.( 38 ) Interestingly, depletion of n‐3 PUFAs in obese patients with NAFLD caused a significant decrease in the PPARα expression, further elevating the SREBF1‐to‐PPARα ratio balance.( 39 ) Our results are consistent with these findings and demonstrated a D5D‐DHA‐PPARα connection.
FGF21 is a metabolic regulator that strongly affects both lipid and glucose homeostasis. FGF21 mRNA and protein expression were significantly down‐regulated in FADS1‐KD cells and Fads1 null mouse liver. Overexpressing FADS1 in the FADS1‐KD cells or treatment with DHA restored both PPARα and FGF21 mRNA and protein expression. This closely linked co‐regulation of these two genes to FADS1, which was further verified by the EMSA examining the PPARα binding efficiency to the FGF21 promoter PPRE. Meanwhile, treatment of FADS1‐KD cells with FF and FGF21 protein normalized lipid accumulation levels to control cells. These results collectively suggested the involvement of the PPARα‐FGF21 axis signaling in the FADS1‐dependent lipid accumulation. These findings are also congruent with a few studies in which PPARα null mice are deficient in FGF21, and treating these mice with FGF21 improves hypertriglyceridemia and hypoketonemia.( 40 , 41 ) Likewise, other studies have shown that activation of the PPARα‐FGF21 pathway is protective against lipid accumulation and development of fatty liver.( 42 , 43 ) Our data also demonstrate that Fads1‐deficient cells are refractive to the anti‐TG accumulation effects of DHA when compared with the control cells, and treatment of the cells with DHA also increased the PPARα‐FGF21 axis activity, which is also consistent with studies reporting that DHA acts as an FGF21 inducer primarily through activation of PPARα.( 44 ) Collectively, these data suggest that FADS1 expression or genotype may be a marker to evaluate the efficiency of omega‐3 PUFA or PPARα agonist treatment. This hypothesis merits further investigation.
Our findings also indicate that FADS1 down‐regulation not only affects lipid accumulation but also cholesterol metabolism, ROS production, cellular antioxidant content, and ER stress, suggesting that D5D may play a central role in rescuing cells from stresses. However, our animal study did not show significant histologic alterations in liver fibrosis and inflammation. This may be because the HFD is known to have limited effects on inducing severe liver injury, and the feeding time was relatively short. A high‐fat (including the high level of trans fat), high‐fructose, and high‐cholesterol diet (Amylin liver NASH [AMLN] diet) have been demonstrated to induce a typical NASH phenotype characterized by severe inflammation and fibrosis, which also takes approximately 6 months of feeding to induce.( 45 ) Ongoing studies in our laboratories are designed to test the AMLN diet in the Fads1‐KO mouse model, to examine the role of Fads1 in NASH. It should be noted, however, that a recent study using a Fads1 antisense oligo (ASO) to treat mice induced severe hepatic inflammation, especially when the mice were fed with a Fads1 substrate‐enriched diet.( 46 ) However, this study demonstrated that Fads1‐ASO treatment led to an inhibition of hepatic lipogenesis, which is likely attributed to the model differences, as we used a systemic KO mouse model. Because Fads1 is broadly expressed in many tissues/organs, research in this area needs to assess its pleiotropic effects.
Although D5D is directly involved in LC‐PUFA metabolism, it has been demonstrated that reduced D5D function can indirectly affect a wide variety of lipid metabolites of LC‐PUFAs. This has been documented in our previous lipidomic studies involving the Fads1‐KO model.( 47 , 48 ) LC‐PUFAs (e.g., AA, EPA, and DHA) are precursors of numerous bioactive lipids (e.g., leukotrienes, prostaglandins, protectins, resolvins). Thus, it is very likely that these bioactive lipids may also contribute to the modulation of hepatic lipid metabolism and other liver functions. In this framework, signaling pathways in addition to the PPARα‐FGF21 axis could be involved. It is also notable that our lipidomic analysis suggested that altering the FADS1 function by KD and re‐expression leads to the reversible metabolism of omega‐6 PUFA (i.e., DGLA to AA), but a lesser extent for the omega‐3 PUFAs (i.e., EPA and DHA levels and the omega‐3 index). This suggests that the elevation of the FADS1 activity may not be able to increase the levels of omega‐3 LC‐PUFAs. The reason underlying this phenomenon remains unclear and may be in part due to the competition of the omega‐6/3 substrates for the D5D enzyme.( 49 , 50 ) Further studies are warranted to address this question.
In conclusion, our findings demonstrate that reduced FADS1 function in hepatocytes suppresses the PPARα‐FGF21 signaling axis, which increases the total hepatic fat deposition and susceptibility to steatosis and other liver injuries. Furthermore, we demonstrate that DHA, PPARα agonist, and FGF21 are effective treatments for reversing these effects in the FADS1‐deficient condition. Future studies investigating the role of FADS1 in liver fibrosis, inflammation, and progression of NAFLD to NASH are required to further elucidate how pathogenesis‐related pathways are affected by FADS1 deficiency.
Supporting information
Fig S1
Supplementary Material
Supported by Wayne State University Offices of Vice President for Research, National Institutes of Health (P30‐ES029067, R01‐DK106540, and R35‐CA197707), Allen Endowed Chair in Nutrition & Chronic Disease Prevention–Texas A&M, and Purdue University Offices of Vice President for Research.
Potential conflict of interest: Nothing to report.
REFERENCES
Author names in bold designate shared co‐first authorship.
- 1. Martinelli N, Girelli D, Malerba G, Guarini P, Illig T, Trabetti E, et al. FADS genotypes and desaturase activity estimated by the ratio of arachidonic acid to linoleic acid are associated with inflammation and coronary artery disease. Am J Clin Nutr 2008;88:941‐949. [DOI] [PubMed] [Google Scholar]
- 2. Lemaitre RN, Tanaka T, Tang W, Manichaikul A, Foy M, Kabagambe EK, et al. Genetic loci associated with plasma phospholipid n‐3 fatty acids: a meta‐analysis of genome‐wide association studies from the CHARGE Consortium. PLoS Genet 2011;7:e1002193. [DOI] [PMC free article] [PubMed] [Google Scholar]
- 3. Chambers JC, Zhang W, Sehmi J, Li X, Wass MN, Van der Harst P, et al. Genome‐wide association study identifies loci influencing concentrations of liver enzymes in plasma. Nat Genet 2011;43:1131‐1138. [DOI] [PMC free article] [PubMed] [Google Scholar]
- 4. Wang L, Athinarayanan S, Jiang G, Chalasani N, Zhang M, Liu W. Fatty acid desaturase 1 gene polymorphisms control human hepatic lipid composition. Hepatology 2015;61:119‐128. [DOI] [PMC free article] [PubMed] [Google Scholar]
- 5. Murakami K, Sasaki S, Takahashi Y, Uenishi K, Watanabe T, Kohri T, et al. Lower estimates of delta‐5 desaturase and elongase activity are related to adverse profiles for several metabolic risk factors in young Japanese women. Nutr Res 2008;28:816‐824. [DOI] [PubMed] [Google Scholar]
- 6. Araya J, Rodrigo R, Pettinelli P, Araya AV, Poniachik J, Videla LA. Decreased liver fatty acid delta‐6 and delta‐5 desaturase activity in obese patients. Obesity (Silver Spring) 2010;18:1460‐1463. [DOI] [PubMed] [Google Scholar]
- 7. Walle P, Takkunen M, Mannisto V, Vaittinen M, Lankinen M, Karja V, et al. Fatty acid metabolism is altered in non‐alcoholic steatohepatitis independent of obesity. Metabolism 2016;65:655‐666. [DOI] [PubMed] [Google Scholar]
- 8. Puri P, Wiest MM, Cheung O, Mirshahi F, Sargeant C, Min HK, et al. The plasma lipidomic signature of nonalcoholic steatohepatitis. Hepatology 2009;50:1827‐1838. [DOI] [PMC free article] [PubMed] [Google Scholar]
- 9. Allard JP, Aghdassi E, Mohammed S, Raman M, Avand G, Arendt BM, et al. Nutritional assessment and hepatic fatty acid composition in non‐alcoholic fatty liver disease (NAFLD): a cross‐sectional study. J Hepatol 2008;48:300‐307. [DOI] [PubMed] [Google Scholar]
- 10. Arendt BM, Mohammed SS, Ma DW, Aghdassi E, Salit IE, Wong DK, et al. Non‐alcoholic fatty liver disease in HIV infection associated with altered hepatic fatty acid composition. Curr HIV Res 2011;9:128‐135. [DOI] [PubMed] [Google Scholar]
- 11. Arendt BM, Comelli EM, Ma DW, Lou W, Teterina A, Kim T, et al. Altered hepatic gene expression in nonalcoholic fatty liver disease is associated with lower hepatic n‐3 and n‐6 polyunsaturated fatty acids. Hepatology 2015;61:1565‐1578. [DOI] [PubMed] [Google Scholar]
- 12. Pachikian BD, Neyrinck AM, Cani PD, Portois L, Deldicque L, De Backer FC, et al. Hepatic steatosis in n‐3 fatty acid depleted mice: focus on metabolic alterations related to tissue fatty acid composition. BMC Physiol 2008;8:21. [DOI] [PMC free article] [PubMed] [Google Scholar]
- 13. Pachikian BD, Essaghir A, Demoulin JB, Neyrinck AM, Catry E, De Backer FC, et al. Hepatic n‐3 polyunsaturated fatty acid depletion promotes steatosis and insulin resistance in mice: genomic analysis of cellular targets. PLoS One 2011;6:e23365. [DOI] [PMC free article] [PubMed] [Google Scholar]
- 14. Folch J, Lees M, Sloane Stanley GH. A simple method for the isolation and purification of total lipides from animal tissues. J Biol Chem 1957;226:497‐509. [PubMed] [Google Scholar]
- 15. Chapkin RS, Somers SD, Erickson KL. Inability of murine peritoneal macrophages to convert linoleic acid into arachidonic acid: evidence of chain elongation. J Immunol 1988;140:2350‐2355. [PubMed] [Google Scholar]
- 16. Schwartz DM, Wolins NE. A simple and rapid method to assay triacylglycerol in cells and tissues. J Lipid Res 2007;48:2514‐2520. [DOI] [PubMed] [Google Scholar]
- 17. Apak R, Ozyurek M, Guclu K, Capanoglu E. Antioxidant activity/capacity measurement. 1. Classification, physicochemical principles, mechanisms, and electron transfer (ET)‐based assays. J Agric Food Chem 2016;64:997‐1027. [DOI] [PubMed] [Google Scholar]
- 18. Jump DB, Tripathy S, Depner CM. Fatty acid‐regulated transcription factors in the liver. Annu Rev Nutr 2013;33:249‐269. [DOI] [PMC free article] [PubMed] [Google Scholar]
- 19. Nakamura MT, Cheon Y, Li Y, Nara TY. Mechanisms of regulation of gene expression by fatty acids. Lipids 2004;39:1077‐1083. [DOI] [PubMed] [Google Scholar]
- 20. Huang Z, Xu A, Cheung BMY. The potential role of fibroblast growth factor 21 in lipid metabolism and hypertension. Curr Hypertens Rep 2017;19:28. [DOI] [PubMed] [Google Scholar]
- 21. Vernia S, Cavanagh‐Kyros J, Garcia‐Haro L, Sabio G, Barrett T, Jung DY, et al. The PPARalpha‐FGF21 hormone axis contributes to metabolic regulation by the hepatic JNK signaling pathway. Cell Metab 2014;20:512‐525. [DOI] [PMC free article] [PubMed] [Google Scholar]
- 22. Zhao Z, Xu D, Wang Z, Wang L, Han R, Wang Z, et al. Hepatic PPARalpha function is controlled by polyubiquitination and proteasome‐mediated degradation through the coordinated actions of PAQR3 and HUWE1. Hepatology 2018;68:289‐303. [DOI] [PMC free article] [PubMed] [Google Scholar]
- 23. Inagaki T, Dutchak P, Zhao G, Ding X, Gautron L, Parameswara V, et al. Endocrine regulation of the fasting response by PPARalpha‐mediated induction of fibroblast growth factor 21. Cell Metab 2007;5:415‐425. [DOI] [PubMed] [Google Scholar]
- 24. Kim H, Mendez R, Zheng Z, Chang L, Cai J, Zhang R, et al. Liver‐enriched transcription factor CREBH interacts with peroxisome proliferator‐activated receptor alpha to regulate metabolic hormone FGF21. Endocrinology 2014;155:769‐782. [DOI] [PMC free article] [PubMed] [Google Scholar]
- 25. Svegliati‐Baroni G, Candelaresi C, Saccomanno S, Ferretti G, Bachetti T, Marzioni M, et al. A model of insulin resistance and nonalcoholic steatohepatitis in rats: role of peroxisome proliferator‐activated receptor‐alpha and n‐3 polyunsaturated fatty acid treatment on liver injury. Am J Pathol 2006;169:846‐860. [DOI] [PMC free article] [PubMed] [Google Scholar]
- 26. Yamazaki T, Nakamori A, Sasaki E, Wada S, Ezaki O. Fish oil prevents sucrose‐induced fatty liver but exacerbates high‐safflower oil‐induced fatty liver in ddy mice. Hepatology 2007;46:1779‐1790. [DOI] [PubMed] [Google Scholar]
- 27. Larter CZ, Yeh MM, Cheng J, Williams J, Brown S, dela Pena A, et al. Activation of peroxisome proliferator‐activated receptor alpha by dietary fish oil attenuates steatosis, but does not prevent experimental steatohepatitis because of hepatic lipoperoxide accumulation. J Gastroenterol Hepatol 2008;23:267‐275. [DOI] [PubMed] [Google Scholar]
- 28. Alwayn IP, Gura K, Nose V, Zausche B, Javid P, Garza J, et al. Omega‐3 fatty acid supplementation prevents hepatic steatosis in a murine model of nonalcoholic fatty liver disease. Pediatr Res 2005;57:445‐452. [DOI] [PubMed] [Google Scholar]
- 29. Alwayn IP, Andersson C, Zauscher B, Gura K, Nose V, Puder M. Omega‐3 fatty acids improve hepatic steatosis in a murine model: potential implications for the marginal steatotic liver donor. Transplantation 2005;79:606‐608. [DOI] [PubMed] [Google Scholar]
- 30. Zhu FS, Liu S, Chen XM, Huang ZG, Zhang DW. Effects of n‐3 polyunsaturated fatty acids from seal oils on nonalcoholic fatty liver disease associated with hyperlipidemia. World J Gastroenterol 2008;14:6395‐6400. [DOI] [PMC free article] [PubMed] [Google Scholar]
- 31. Parker HM, Johnson NA, Burdon CA, Cohn JS, O’Connor HT, George J. Omega‐3 supplementation and non‐alcoholic fatty liver disease: a systematic review and meta‐analysis. J Hepatol 2012;56:944‐951. [DOI] [PubMed] [Google Scholar]
- 32. Nobili V, Alisi A, Liu Z, Liang T, Crudele A, Raponi M, et al. In a pilot study, reduced fatty acid desaturase 1 function was associated with nonalcoholic fatty liver disease and response to treatment in children. Pediatr Res 2018;84:696‐703. [DOI] [PMC free article] [PubMed] [Google Scholar]
- 33. Jump DB, Botolin D, Wang Y, Xu J, Christian B, Demeure O. Fatty acid regulation of hepatic gene transcription. J Nutr 2005;135:2503‐2506. [DOI] [PubMed] [Google Scholar]
- 34. Kashireddy PV, Rao MS. Lack of peroxisome proliferator‐activated receptor alpha in mice enhances methionine and choline deficient diet‐induced steatohepatitis. Hepatol Res 2004;30:104‐110. [DOI] [PubMed] [Google Scholar]
- 35. Ip E, Farrell GC, Robertson G, Hall P, Kirsch R, Leclercq I. Central role of PPARalpha‐dependent hepatic lipid turnover in dietary steatohepatitis in mice. Hepatology 2003;38:123‐132. [DOI] [PubMed] [Google Scholar]
- 36. Lee SS, Pineau T, Drago J, Lee EJ, Owens JW, Kroetz DL, et al. Targeted disruption of the alpha isoform of the peroxisome proliferator‐activated receptor gene in mice results in abolishment of the pleiotropic effects of peroxisome proliferators. Mol Cell Biol 1995;15:3012‐3022. [DOI] [PMC free article] [PubMed] [Google Scholar]
- 37. Rao MS, Papreddy K, Musunuri S, Okonkwo A. Prevention/reversal of choline deficiency‐induced steatohepatitis by a peroxisome proliferator‐activated receptor alpha ligand in rats. Vivo 2002;16:145‐152. [PubMed] [Google Scholar]
- 38. Montagner A, Polizzi A, Fouche E, Ducheix S, Lippi Y, Lasserre F, et al. Liver PPARalpha is crucial for whole‐body fatty acid homeostasis and is protective against NAFLD. Gut 2016;65:1202‐1214. [DOI] [PMC free article] [PubMed] [Google Scholar]
- 39. Pettinelli P, Del Pozo T, Araya J, Rodrigo R, Araya AV, Smok G, et al. Enhancement in liver SREBP‐1c/PPAR‐alpha ratio and steatosis in obese patients: correlations with insulin resistance and n‐3 long‐chain polyunsaturated fatty acid depletion. Biochim Biophys Acta 2009;1792:1080‐1086. [DOI] [PubMed] [Google Scholar]
- 40. Badman MK, Pissios P, Kennedy AR, Koukos G, Flier JS, Maratos‐Flier E. Hepatic fibroblast growth factor 21 is regulated by PPARalpha and is a key mediator of hepatic lipid metabolism in ketotic states. Cell Metab 2007;5:426‐437. [DOI] [PubMed] [Google Scholar]
- 41. Lundasen T, Hunt MC, Nilsson LM, Sanyal S, Angelin B, Alexson SE, et al. PPARalpha is a key regulator of hepatic FGF21. Biochem Biophys Res Commun 2007;360:437‐440. [DOI] [PubMed] [Google Scholar]
- 42. Marino JS, Stechschulte LA, Stec DE, Nestor‐Kalinoski A, Coleman S, Hinds TD Jr. Glucocorticoid receptor beta induces hepatic steatosis by augmenting inflammation and inhibition of the peroxisome proliferator‐activated receptor (PPAR) alpha. J Biol Chem 2016;291:25776‐25788. [DOI] [PMC free article] [PubMed] [Google Scholar]
- 43. Zeng K, Tian L, Patel R, Shao W, Song Z, Liu L, et al. Diet polyphenol curcumin stimulates hepatic Fgf21 production and restores its sensitivity in high‐fat‐diet‐fed male mice. Endocrinology 2017;158:277‐292. [DOI] [PubMed] [Google Scholar]
- 44. Videla LA, Fernandez V, Vargas R, Cornejo P, Tapia G, Varela N, et al. Upregulation of rat liver PPARalpha‐FGF21 signaling by a docosahexaenoic acid and thyroid hormone combined protocol. BioFactors 2016;42:638‐646. [DOI] [PubMed] [Google Scholar]
- 45. Clapper JR, Hendricks MD, Gu G, Wittmer C, Dolman CS, Herich J, et al. Diet‐induced mouse model of fatty liver disease and nonalcoholic steatohepatitis reflecting clinical disease progression and methods of assessment. Am J Physiol Gastrointest Liver Physiol 2013;305:G483‐G495. [DOI] [PubMed] [Google Scholar]
- 46. Gromovsky AD, Schugar RC, Brown AL, Helsley RN, Burrows AC, Ferguson D, et al. Delta‐5 fatty acid desaturase FADS1 impacts metabolic disease by balancing proinflammatory and proresolving lipid mediators. Arterioscler Thromb Vasc Biol 2018;38:218‐231. [DOI] [PMC free article] [PubMed] [Google Scholar]
- 47. Fan YY, Monk JM, Hou TY, Callway E, Vincent L, Weeks B, et al. Characterization of an arachidonic acid‐deficient (Fads1 knockout) mouse model. J Lipid Res 2012;53:1287‐1295. [DOI] [PMC free article] [PubMed] [Google Scholar]
- 48. Monk JM, Turk HF, Fan YY, Callaway E, Weeks B, Yang P, et al. Antagonizing arachidonic acid‐derived eicosanoids reduces inflammatory Th17 and Th1 cell‐mediated inflammation and colitis severity. Mediators Inflamm 2014;2014:917149. [DOI] [PMC free article] [PubMed] [Google Scholar]
- 49. de Antueno RJ, Knickle LC, Smith H, Elliot ML, Allen SJ, Nwaka S, et al. Activity of human delta5 and delta6 desaturases on multiple n‐3 and n‐6 polyunsaturated fatty acids. FEBS Lett 2001;509:77‐80. [DOI] [PubMed] [Google Scholar]
- 50. Mohrhauer H, Holman RT. Effect of linolenic acid upon the metabolism of linoleic acid. J Nutr 1963;81:67‐74. [DOI] [PubMed] [Google Scholar]
Associated Data
This section collects any data citations, data availability statements, or supplementary materials included in this article.
Supplementary Materials
Fig S1
Supplementary Material


