

Abstract
Impairments in social relationships and awareness are features observed in autism spectrum disorders (ASDs). However, the underlying mechanisms remain poorly understood. Shank2 is a high‐confidence ASD candidate gene and localizes primarily to postsynaptic densities (PSDs) of excitatory synapses in the central nervous system (CNS). We show here that loss of Shank2 in mice leads to a lack of social attachment and bonding behavior towards pubs independent of hormonal, cognitive, or sensitive deficits. Shank2 −/− mice display functional changes in nuclei of the social attachment circuit that were most prominent in the medial preoptic area (MPOA) of the hypothalamus. Selective enhancement of MPOA activity by DREADD technology re‐established social bonding behavior in Shank2 −/− mice, providing evidence that the identified circuit might be crucial for explaining how social deficits in ASD can arise.
Keywords: autism spectrum disorders, bonding, SHANK3, social behavior, synapse
Subject Categories: Neuroscience
Loss of the autism spectrum disorders linked gene Shank2 in mice leads to loss of social bonding due to functional changes in the social attachment circuit including the MPOA.

Introduction
The capacity to establish and maintain social bonds is a primary component of social behavior in mammals (Carter, 1998). Social bonds in mammals may form between a parent and infant, or between two adults, or between individual members of social groups (Broad et al, 2006; Mogi et al, 2011; Lieberwirth & Wang, 2014; Johnson & Young, 2015). The first bond which is formed in the life of social mammals is the bond between a mother and an infant, and it is thought to provide the neuronal template for later forms of pro‐sociality or social relationships (Rilling & Young, 2014; Numan & Young, 2016).
Autism spectrum disorders (ASD) are neurodevelopmental disorders characterized by a chronic impairment in the formation of social relationships (Barak & Feng, 2016). Unraveling the cause of the deficits in establishing affective bonds to other people, resulting in a profoundly disturbed pattern of social development, may be critical to understanding ASD. However, so far, the underlying neuronal mechanism that might account for the inability to form social relationships in ASD remain poorly understood.
Social bonds are the most highly motivated forms of social behavior and are mediated by an evolutionary conserved neurocircuitry (Insel, 2003; Broad et al, 2006). The major components of the circuit have been identified and involve the amygdala (AMY), the medial preoptic area (MPOA) of the hypothalamus, and the dopaminergic neurons in the ventral tegmental area (VTA) which project toward the nucleus accumbens (NAcc) to form a social engaged reward system (Numan & Insel, 2003). Previous studies indicate that the MPOA plays a central role in the control of social bonding behavior. Bilateral lesions or temporary inactivation of the MPOA region disrupt all components of social attachment behavior, whereas the stimulation of the MPOA facilitates its full expression (Numan, 2007; Wu et al, 2014; Kohl et al, 2018). Recently, it has also been demonstrated that activation of neurotensin (Nts)‐expressing neurons in the MPOA promotes social attraction during adult social interactions, suggesting that the MPOA is a central node in the neuronal network that regulates social behavior by connecting social information to the reward system (McHenry et al, 2017).
In this study, we use an ASD mouse model, generated through the deletion of Shank2 (SH3 and multiple ankyrin repeat domains protein 2) (Schmeisser et al, 2012), to investigate impairments in social bond formation on a behavioral level, and to identify the underlying pathology on cellular and circuit level focusing on the aforementioned circuit regulating social bond formation.
SHANK2 (ProSAP1) is one of the major scaffold proteins of excitatory synapses reported to play a key role in the structural assembly and integrity of the postsynaptic density (PSD), navigating proper synaptic function by organizing an impressive excitatory signaling machinery within the glutamatergic spine (Lim et al, 1999; Naisbitt et al, 1999; Boeckers et al, 2002; Grabrucker et al, 2011; Sala et al, 2015). Several genetic variations of the human SHANK2 gene have been identified in patients with ASD, schizophrenia, and developmental delay and intellectual disability (Wischmeijer et al, 2011; Sanders et al, 2012; Rauch et al, 2012; Prasad et al, 2012; Chilian et al, 2013; Schluth‐Bolard et al, 2013; Leblond et al, 2014; Costas, 2015; Peykov et al, 2015a,b; Homann et al, 2016). Heterozygous loss‐of‐function mutations in the human SHANK2 gene are significantly associated with ASD, and dysfunctional social relationships are key symptoms and core characteristics of these loss‐of‐function mutations in humans (Berkel et al, 2010, 2012; Pinto et al, 2010; Leblond et al, 2012; Guilmatre et al, 2014). Previous studies have also demonstrated that Shank2 deletion in mice results in prominent autism‐like social deficits (Schmeisser et al, 2012; Won et al, 2012; Pappas et al, 2017; Kim et al, 2018; Eltokhi et al, 2018). Although the underlying mechanisms are still mostly unknown, it has been suggested that impaired NMDA receptor function might contribute to the development of social interaction deficits in Shank2 −/− mice (Won et al, 2012).
Here, in a series of behavioral experiments specifically designed to evaluate social attachment behavior, we demonstrate that in mice the genetic depletion of Shank2 selectively leads to profound incapability to initiate social bonding. Our data provide the first evidence that this incapability is based on a disrupted neuronal circuit coding for social attachment behavior and cannot be just attributed to a dysfunction of hormones regulating social behavior as previously proposed for ASD patients. Furthermore, our study links the function of SHANK2 to the MPOA, the evolutionary conserved node, and “hot spot” of the social behavioral network, which ties social behavior to the reward system. Notably, chemogenetic activation of MPOA neurons improved social bonding in Shank2 −/− mice, confirming the sufficiency of MPOA activity to restore disrupted social attachment behavior in Shank2 −/− mice. Collectively, our findings highlight a possible new mechanism, how social deficits in ASD might arise, namely through the inability to establish social attachment and bonding behavior.
Results
Shank2 −/− mice are not capable of initiating social bonding behavior
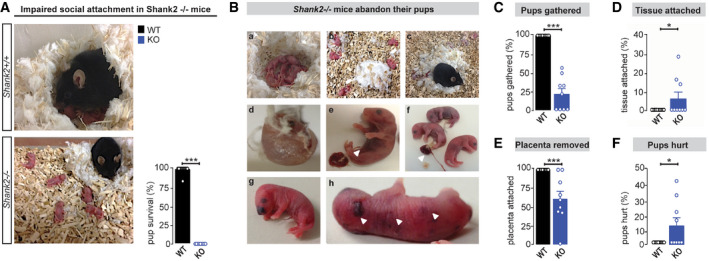
Social attachment behavior in Shank2 −/− mice was assessed by several read‐outs for maternal behavior. Intriguingly, breeding of female Shank2 −/− mice with Shank2 +/+ males resulted in a dramatic decrease in pup survival (Fig 1A). Although Shank2 −/− mice did not display a significant difference in litter‐size and delivered on term (Appendix Fig S1A and B), all pups born from Shank2 −/− mothers died within 24 h after delivery (Appendix Fig S1C). Pups were found scattered within the bedding material, ignored, and neglected by the mother (Fig 1B(a–f) and C). Of particular note was that Shank2 −/− mice displayed impaired placentophagia, a distinctive mammalian behavior, and most litters of Shank2 −/− dams contained at least one pup with its placenta or umbilical cord left intact. Furthermore, some pups of Shank2 −/− mice were still found enclosed in fetal tissue (Fig 1D and E). In addition to being abandoned, pups of Shank2 −/− dams displayed injuries, predominantly in the facial region (Fig 1B(g,h) and F). Shank2 −/− mothers exhibited a similar phenotype in subsequent pregnancies, with pups scattered after birth in the bedding and high pup lethality during the first postnatal days. A comparison of the survival rate of pups from the first and second litter yielded no significant difference (Appendix Fig S2A and B), indicating that the observed phenotype in Shank2 −/− mice cannot be overcome by social experience with the pups.
Figure 1. Shank2 −/− mice ignore and abandon their pups after delivery.
-
AIn contrast to the immediate care of Shank2 +/+ dams shortly after delivery, Shank2 −/− dams neglect the offspring. No proper nest building is observed, and pups are lying randomly scattered within the bedding. Right diagram: Average percentage of pups surviving until weaning per pregnancy. None of the litters of Shank2 −/− mice survived after delivery, Mann–Whitney test, ***P < 0.001, Shank2 +/+ n = 12, Shank2 −/− n = 9.
-
B–F(B, a–h) Series of pictures displaying the neglected appearance of pups delivered by Shank2 −/− dams: (B,a, C), the percentage of pups gathered in the nest location is significantly reduced in Shank2 −/− mice. Mann–Whitney test, ***P < 0.001. (B,d, D) Shank2 −/− mothers fail to remove extra‐embryonical tissue after delivery, Mann–Whitney test, *P = 0.036. (B,e,f, E) Shank2 −/− dams showed impaired placentophagia (arrowheads), Mann–Whitney test, ***P < 0.001. (B,g,h, F) Shank2 −/− dams attack their pups inducing injury in the head and body region (arrowheads), Mann–Whitney test, *P = 0.013, Shank2 +/+, n = 12, Shank2 −/− n = 9.
Data information: All data are presented as mean ± SEM.
The social bonding defect is caused by the phenotype of Shank2 −/− mice and cannot be attributed to general cognitive and olfactory deficits
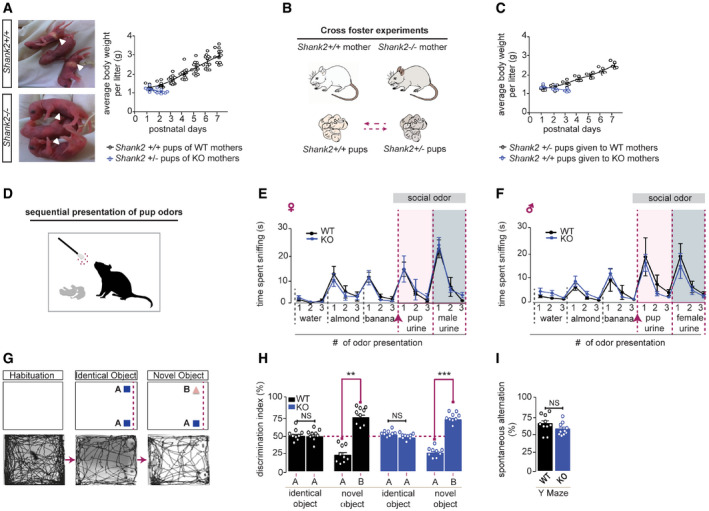
The absence of milk in the stomach of Shank2 +/− pups (Fig 2A, left panel arrowheads) and the reduction of body weight within the first postnatal days indicate that Shank2 −/− mothers fail to nurse their pups. However, an inspection of the mammary glands revealed that Shank2 −/− mice displayed morphologically normal mammary glands that can undergo the transition to the secretory state, characterized by differentiation of the alveolar lobules (Fig EV1A and B). Milk transport and milk secretion from the alveoli in the mammary gland ducts can be induced by myoepithelial contraction triggered through oxytocin treatment (Plante et al, 2011). Upon exposure to oxytocin, the mammary glands of Shank2 −/− mice were able to secrete milk, indicating that Shank2 −/− mothers were in principle able to lactate, and therefore, are physiologically capable of nurturing their pups (Fig EV1B). Since breeding of Shank2 −/− mothers with wild‐type males gives rise to heterozygous pups only, we investigated, whether the decreased survival rate was a consequence of this genotype. To that end, cross‐fostering experiments were performed. Shank2 +/− pups were given to Shank2 +/+ mothers and Shank2 +/+ pups to Shank2 −/− mothers (Fig 2B and C). The results demonstrate that Shank2 +/− pups developed normally upon weaning from Shank2 +/+ mothers, whereas Shank2 −/− mothers failed to raise Shank2 +/+ pups. These results strongly suggest that the high pup mortality was caused by behavioral deficits of Shank2 −/− mothers (Fig 2B and C).
Figure 2. The social bonding defect is caused by the phenotype of Shank2 −/− mice and cannot be attributed to general cognitive and olfactory deficits.
-
AShank2 −/− dams failed to nurture their pups. Pups nurtured by Shank2 +/+ mice display milk in their stomach (arrowheads, upper left panel), while milk was absent in the stomach of Shank2 −/− pups (arrowhead, lower left panel). Pups of Shank2 +/+ mice gradually gained weight (black circles) whereas no weight gain was observed in pups delivered by Shank2 −/− mothers (blue circles), two‐way mixed ANOVA, effect of genotype: ***P < 0.001, effect of day: P = 0.962, day × genotype interaction: ***P < 0.001, Shank2 +/+ n = 12, Shank2 −/− n = 9.
-
B, CPups of Shank2 −/− mice (genotype Shank2 +/−) were cross‐fostered by a Shank2 +/+ female, while pups of the wild‐type mouse (genotype Shank2 +/+) were given to a Shank2 −/− mothers. In contrast to pups (+/−) given to WT mothers (black circles), +/+ pups gradually lost weight if cross‐fostered by Shank2 −/− mothers (blue circles). Two‐way mixed ANOVA effect of genotype: *P = 0.041, effect of day: P = 0.134, day × genotype interaction: ***P < 0.001, Shank2 +/+ n = 5, Shank2 −/− n = 6.
-
DOlfactory habituation/dishabituation ability was evaluated in female and male Shank2 +/+ and Shank2 −/− by the cumulative time spent sniffing a sequential series of nonsocial odors (water, almond, banana) and social odors (unfamiliar pup urine; unfamiliar male or female urine) delivered on cotton swabs.
-
EShank2 −/− female mice showed a clear preference (dishabituation: banana #3 vs. pup odor #1) for pup odor in comparison to Shank2 +/+ mice, two‐way mixed ANOVA, effect of trial: ***P < 0.001, effect of genotype: P = 0.923, trial × genotype interaction: P = 0.892. Additionally, Shank2 −/− female mice displayed normal habituation response (pup odor #1–3) toward pup odor, two‐way mixed ANOVA, effect of trial: **P < 0.006, effect of genotype: P = 0.742, trial × genotype interaction: P = 0.907. Shank2 +/+ n = 8, Shank2 −/− n = 10.
-
FShank2 −/− male mice showed a clear preference (dishabituation: banana #3 vs. pup odor #1) for pup odor in comparison with Shank2 +/+ mice, two‐way mixed ANOVA, effect of trial: ***P < 0.001, effect of genotype: P = 0.787, trial × genotype interaction: P = 0.769. Additionally, Shank2 −/− male mice displayed normal habituation response (pup odor #1–3) toward pup odor, two‐way mixed ANOVA, effect of trial: ***P < 0.001, effect of genotype: P = 0.553, trial × genotype interaction: P = 0.813, Shank2 +/+ n = 10, Shank2 −/− n = 10.
-
GSchematic illustration of the novel object recognition test. After a 30 min habituation phase, Shank2 +/+ and Shank2 −/− mice were allowed to investigate two identical objects in the open field arena (training session). 10 min later, one of the objects was replaced with a novel object (test session). Lower panels show a representative tracking path for a mouse in each test session.
-
HShank2 +/+ and Shank2 −/− mice displayed a significant preference for the novel object vs. the familiar one in the test session, two‐way mixed ANOVA, effect of object: ***P < 0.001, effect of genotype: P = 0.167, object × genotype interaction: P = 0.667, Shank2 +/+ n = 9, Shank2 −/− n = 9.
-
IAdditionally, no significant difference between Shank2 +/+ and Shank2 −/− was evident in the spontaneous alternation behavior during a Y Maze task, unpaired, two‐tailed Student’s t‐test, P = 0.146. Shank2 +/+ n = 10, Shank2 −/− n = 10.
Data information: All graphs are presented as mean ± SEM, NS: not significant.
Figure EV1. Shank2 −/− mice develop functionally and morphologically normal mammary glands.
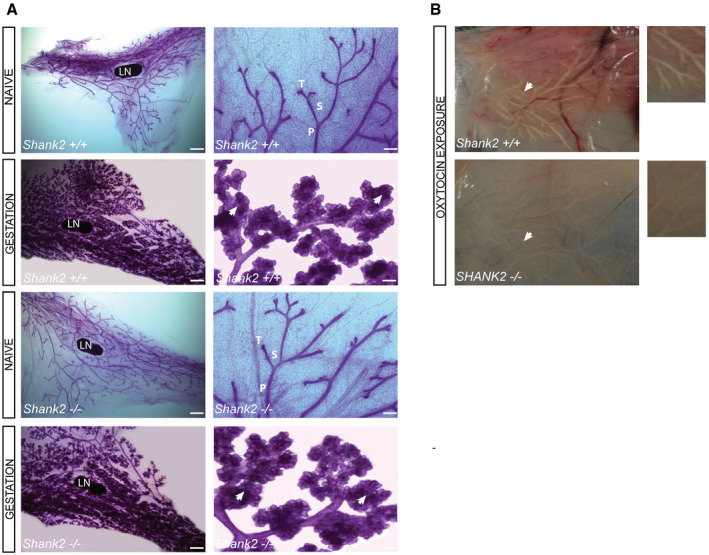
- Carmine‐stained whole‐mount preparations of mammary glands of the fourth inguinal gland isolated from naive and pregnant (1 day before delivery) Shank2 +/+ and Shank2 −/− mice. Images shown are representatives of three mice per genotype at the age of 8 weeks. Scale bars: 2 mm whole mount (left panel); 200 µm in higher magnifications (right panel). Mammary glands of naive Shank2 −/− mice (upper panel) showed no gross abnormalities in ductal morphogenesis in comparison with Shank2 +/+ mice. Additionally, during gestation (lower panel), Shank2 −/− mice developed normal lobuloalveolar structures (arrowheads) intended for milk production. LN, lymph node; P, primary duct; S, secondary branch; T, side branch.
- Functional assessment of the mammary glands in Shank2 +/+ and Shank2 −/− dams. Milk transport and milk secretion from the alveoli into the mammary gland ducts were induced by myoepithelial contraction trigged through treatment with oxytocin. Representative images of thoracic gland #2–3, isolated from Shank2 +/+ (upper panel) and Shank2 −/− mice (lower panel) 1 day before delivery. Mammary glands were incubated for 1 min with (1 mg/ml) oxytocin. After 1 min, images were taken for the visualization of milk ejection in the mammary gland ducts. Both genotypes displayed milk ejection after oxytocin exposure.
Social attachment in mice depends on the detection of pheromones or odorants from the pups (Gandelman et al, 1972; Ehret & Buckenmaier, 1994). In a next step, we performed an olfactory habituation/dishabituation test with a sequential presentation of pup odor, to determine whether Shank2 −/− mice display a preference for the volatile odors of the pups (Fig 2D). We could not detect significant abnormalities in the olfaction of pup odors in Shank2 −/− mice compared to Shank2 +/+ mice (Fig 2E and F). These results are also in line with previous studies (Schmeisser et al, 2012; Won et al, 2012) reporting that Shank2 −/− mice displayed normal olfactory abilities. Although the function of SHANK2 could be very specific to the neuronal circuit regulating social bonding, the data so far do not exclude a global cognitive defect, which might explain the deficits observed in social attachment in Shank2 −/− mice. To address this question, a novel object recognition test for short‐term memory (Fig 2G), as well as a Y maze task, was performed. Our data demonstrate that Shank2 −/− mice display no impairments in the novel object recognition test for short‐term memory (Fig 2H) and no deficits in spontaneous alternation behavior of the Y maze task (Fig 2I) as previously reported (Schmeisser et al, 2012). In addition, it has been demonstrated in a recent study that Shank2 −/− mice display no significant alterations in social recognition, indicating that social memory impairments cannot account for the inability to initiate social bonding behavior in Shank2 −/− mice (Ey et al, 2018).
Shank2 −/− mice fail to display social attachment behavior, but exhibit no gross abnormalities in hormones as well as hormonal receptor expression
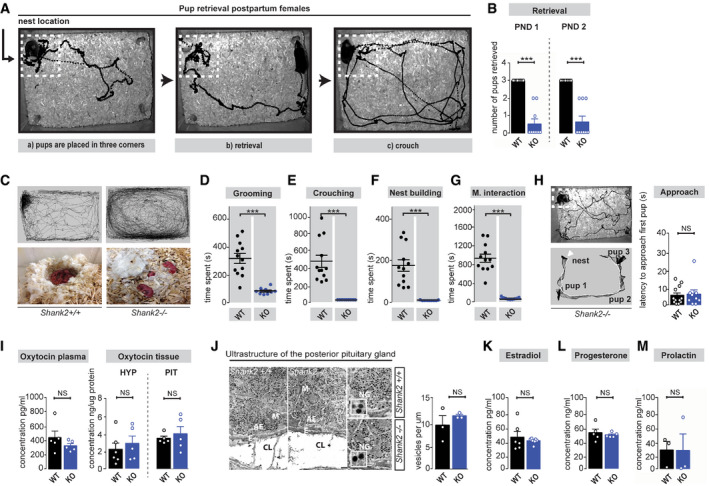
We next assessed the immediate social response of Shank2 −/− dams directed toward pups in a pup retrieval assay (Fig 3A–H). In comparison with Shank2 +/+ dams, which built well‐defined nests, the nest quality of Shank2 −/− mothers was significantly reduced (Fig 3C and F). After 1 h, wild‐type pups were placed in three corners of the home cage, except the corner where the nest was located (Fig 3A). The number of pups retrieved into the nest over a time period of 30 min was measured on postpartum day 1 and 2. In contrast to Shank2 +/+ dams, which displayed immediate social attachment behavior, retrieving pups in a short time frame, crouching over them for nursing, and keeping them warm, the majority of Shank2 −/− mothers displayed profound impairments in all major components of social bonding behavior. Shank2 −/− dams rarely retrieved pups (Fig 3B) and did not spent time grooming, crouching or interacting with the pups at all, (Fig 3D–G), both after the first and second exposure. Interestingly, Shank2 −/− mothers approached and investigated the pups provided. No significant difference was detected in the latency to approach the first pup in comparison with Shank2 +/+ dams (Fig 3H), indicating that Shank2 −/− dams can locate and detect the pups. However, they are incapable of inducing the appropriate social attachment response.
Figure 3. Shank2 −/− mice exhibit impaired pup retrieval and social attachment behavior but unaltered hormone levels.
-
AExperimental setup of the pup retrieval paradigm. After 1‐h pup deprivation, pups were placed in three corners of the home cage that did not contain the nest. The mother retrieved the pups and crouches over them, engaging in maternal care responses (pup grooming, crouching, and nest building).
-
BShank2 −/− mice showed significantly less pup retrieval both on postnatal day 1 and 2, two‐way mixed ANOVA, effect of genotype: ***P < 0.001, effect of day: P = 0.258, day × genotype interaction: P = 0.258, Shank2 +/+ n = 12, Shank2 −/− n = 9.
-
CTracking path of a Shank2 +/+ mother and a Shank2 −/− mother during the pup retrieval assay. Left panel: Shank2 +/+ mothers immediately retrieved the pups and started crouching over them in the nest location. Right panel: Shank2 −/− mothers rarely retrieved the provided pups and failed to crouch over them in the nest location. In addition, Shank2 −/− mothers showed no or impaired nest building.
-
D–GBehavioral analysis of Shank2 +/+ and Shank2 −/− dams demonstrated a significant reduction in all major components of maternal behavior: (D) pup grooming, unpaired, two‐tailed Student’s t‐test, ***P < 0.001 (E) crouching, Mann–Whitney test, ***P < 0.001 (F) nest building, Mann–Whitney test, ***P < 0.001 and (G) Maternal interaction, unpaired, two‐tailed Student’s t‐test, ***P < 0.001. Shank2 +/+ n = 12, Shank2 −/− n = 9.
-
HLeft panel: Example of a tracking trajectory of a Shank2 −/− dams during the pup retrieval test. Shank2 −/− dams investigated the provided pups (upper panel), which was further evident in the nose‐tracking path of a Shank2 −/− dam (lower panel). No significant difference was detected in the latency to approach the provided pups between Shank2 +/+ and Shank2 −/− mothers, Mann–Whitney test, P = 0.943. Shank2 +/+ n = 12, Shank2 −/− n = 9.
-
ILevels of Oxytocin plasma and tissue concentration in Shank2 +/+ and Shank2 −/− mice. Left panel: No significant difference was detected between Oxytocin plasma concentration comparing Shank2 +/+ with Shank2 −/− mice, unpaired, two‐tailed Student’s t‐test, P = 0.276, Shank2 +/+ n = 5, Shank2 −/− n = 5. Right panel: Additionally, Shank2 −/− mice displayed no significant differences in hypothalamic or pituitary Oxytocin concentrations, unpaired, two‐tailed Student’s t‐test, P = 0.536, Shank2 +/+ n = 6, Shank2 −/− n = 5; two‐tailed Student’s t‐test, P = 0.585, Shank2 +/+ n = 5, Shank2 −/− n = 5.
-
JLeft panel: Electron micrographs of the posterior pituitary gland from Shank2 +/+ and Shank2 −/− mice in lower (left panel) and higher magnification. Scale bar (500 nm). Right diagram: No significant difference was detected in the number of vesicles in the posterior pituitary gland between Shank2 +/+ and Shank2 −/− mice, Mann–Whitney test, P = 0.507, Shank2 +/+ n = 3, Shank2 −/− n = 3.
-
K–MAdditionally, Shank2 −/− mice display no significant difference in: (K) Estradiol‐, Mann–Whitney test, P = 0.475, Shank2 +/+ n = 6, Shank2 −/− n = 7, (L) Progesterone, unpaired, two‐tailed Student’s t‐test, P = 0.570, Shank2 +/+ n = 5, Shank2 −/− n = 5 or (M) Prolactin‐plasma concentrations, unpaired, two‐tailed Student’s t‐test, P = 0.980; Shank2 +/+ n = 3, Shank2 −/− n = 3.
Data information: All data are presented as mean ± SEM, NS: not significant. E, endothelium; CL, capillary lumen; M, mitochondria; NG, neurosecretory granule; AE, axonal endings, HYP, Hypothalamus; PIT, Pituitary gland.
Previous studies have demonstrated that hormones such as oxytocin (OT), progesterone, prolactin, and sex steroids are involved in the induction and perinatal facilitation of social bonding behavior (Ehret & Koch, 1989; Bridges et al, 1990; Insel, 1997). Furthermore, plasma OT levels have been reported to be reduced in autistic patients (Modahl et al, 1998). To test for an altered hormonal status, we first evaluated the OT concentration in Shank2 −/− mice. Interestingly, we did not detect significant changes in peripheral OT plasma concentration, nor could we find significant alterations in OT concentrations extracted from neuronal brain tissue of the hypothalamus and pituitary gland in Shank2 −/− mice (Fig 3I). These results were further confirmed by detailed electron microscopic analysis of the axon swellings of the posterior pituitary gland. The amount of dense‐core vesicles harboring oxytocin and vasopressin was indistinguishable in both genotypes (Fig 3J). Additionally, our study revealed no significant change in the plasma levels of estradiol, progesterone, and prolactin in Shank2 −/− dams, which are essential hormones involved in the regulation of social bonding behavior (Fig 3K–M).
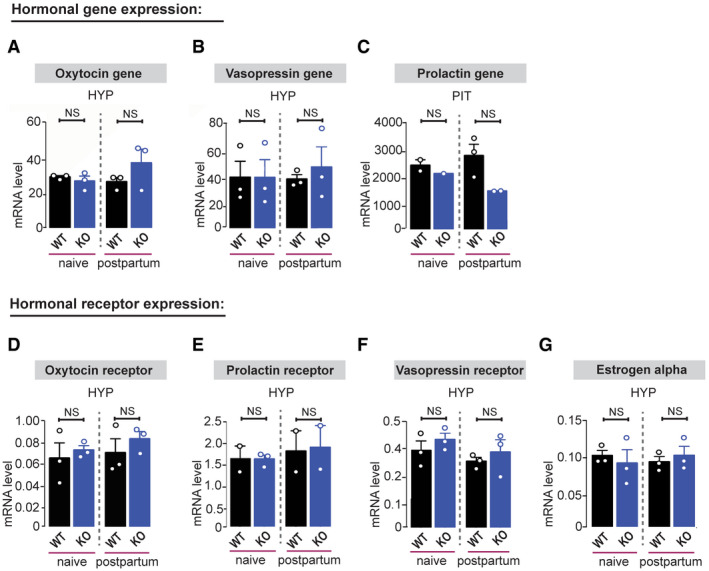
Furthermore, we did not find significant alterations in dominant hormonal gene and receptor expression known to be involved in the regulation of social bonding behavior within the hypothalamus and pituitary gland of Shank2 −/− mice (Fig 4A–G). No significant difference in oxytocin gene and oxytocin receptor mRNA expression before and after parturition was detected within the hypothalamus of Shank2 −/− mice (Fig 4A and D). Thus, our results suggest that both oxytocin synthesis and oxytocin target systems seem to be unaffected in Shank2 −/− mice. Together, these data implicate that deregulation of hormone/receptor expression is not responsible for the disruption of social attachment behavior observed in Shank2 −/− mice.
Figure 4. Shank2 −/− mice display no gross abnormalities in hormonal gene and receptor expression.
-
A–GqRT–PCR analysis of mRNA expression levels of hormonal genes and hormonal receptors normalized to house‐keeping gene HMBS of 9‐ to 10‐week‐old naive and postnatal day 1 Shank2 +/+ and Shank2 −/− mice: (A) Oxytocin gene expression did not differ between Shank2 +/+ and Shank2 −/− mice, one‐way ANOVA, P = 0.335. (B) Vasopressin gene expression did not differ between Shank2 +/+ and Shank2 −/− mice, one‐way ANOVA, P = 0.945. (C) Prolactin gene expression did not differ between Shank2 +/+ and Shank2 −/− mice, one‐way ANOVA, P = 0.202. Additionally, no significant difference was evident in (D) oxytocin receptor, one‐way ANOVA, P = 0.675, (E) prolactin receptor, one‐way ANOVA, P = 0.912, (F) vasopressin receptor, one‐way ANOVA, P = 0.418 and (G) estrogen receptor alpha expression, one‐way ANOVA, P = 0.890 in comparison with Shank2 +/+ mice. All data are presented as mean ± SEM, NS: not significant. Pituitary gland, (n = 3 pituitary glands pooled per value, n = 3 hypothalamus (Oxytocin, Vasopressin, Oxytocin receptor, Vasopressin receptor, estrogen alpha) n = 2–3 hypothalamus (Prolactin receptor)). HYP, hypothalamus; PIT, pituitary gland.
The impaired social bonding in Shank2 −/− mice can be attributed to the neuronal circuit regulating social attachment behavior
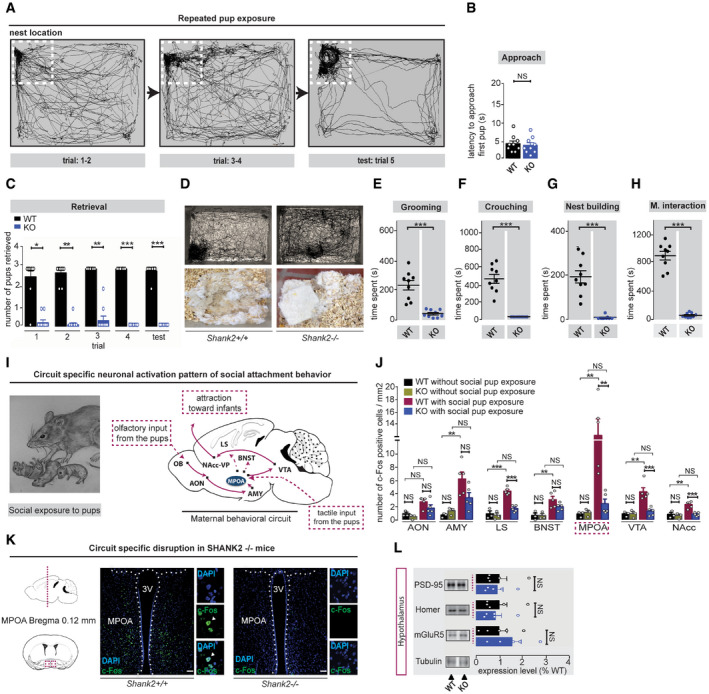
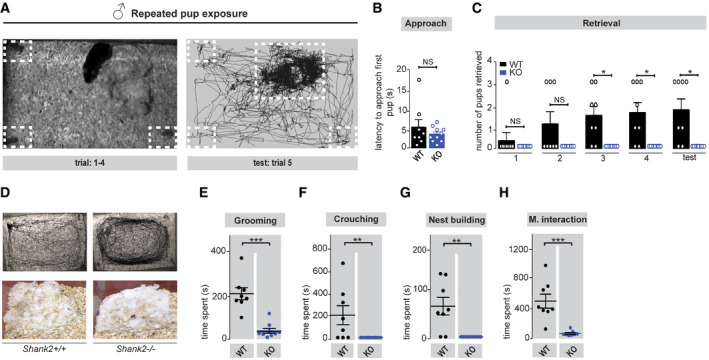
Social attachment toward pups can be initiated via two mechanisms in rodents: (i) hormonal priming during pregnancy or (ii) repeated sensory exposure toward pups. Both components require the same brain regions, harboring the same circuit, although the social response in pup‐inexperienced mice is less immediate (Rosenblatt, 1967; Ehret & Buckenmaier, 1994). To determine, whether the genetic deletion of Shank2 affects social attachment behavior outside the context of pregnancy (and hormonal alterations), we examined the response of naive females (and males) after continuous pup presentation (Fig 5A). Social exposure of WT female mice to pups over five consecutive days significantly improved retrieval of all pups (Fig 5C). In contrast, although Shank2 −/− females approached the pups (Fig 5B), they were not able to initiate social attachment behavior as evident by a failure to induce pup grooming, crouching, and nest‐building behavior (Fig 5D–H). Former studies have shown that Shank2 −/− mice exhibit anxiety‐like behaviors and hyperactivity as co‐morbid ASD features (Schmeisser et al, 2012; Won et al, 2012). In order to test whether pups induce social anxiety in Shank2 −/− mice, we also examined the cumulative time (Fig EV2A and B) and average duration (Fig EV2C) that Shank2 +/+ and Shank2 −/− mice spent in pup interaction zones during the first 2 min of social exposure of the pups (trial 1). However, we did not detect significant differences between genotypes. Further, we detected no significant differences in the time spent freezing (Fig EV2D), implicating that social anxiety is not a substantial factor in eliminating this form of social behavior. We also measured average movement velocity during the pup retrieval test, when Shank2+/+ and Shank2 −/− mice did not engage in maternal behavior. We did not find a significant alteration between both genotypes (Fig EV2F). The failure to induce social bonding behavior was not specific to female mice. Also, Shank2 −/− male mice could not be induced to act paternal after continuous pup presentation (Fig EV3A–H). The results of these behavioral experiments support our previous finding that the impaired social bonding behavior observed in Shank2 −/− mice was independent of hormonal changes associated with parturition and suggest that the genetic deletion of Shank2 impaired the functional properties of the neuronal circuit regulating social attachment behavior (Fig 5I).
Figure 5. Repeated pup presentation does not induce maternal behavior in Shank2 −/− mice that display a circuit‐specific disruption of social attachment behavior.
-
AMaternal behavior can be induced in female mice, which have never been exposed to pups (naive females) by repeated social exposure to pups (trial 1–5). Virgin female mice start to retrieve pups and engage in maternal care responses (pup grooming, crouching, nest building), thereby becoming attached to the nest location as indicated by the tracking path.
-
BNo significant difference was detected for latency to approach the provided pups between Shank2 +/+ and Shank2 −/− naive females, unpaired, two‐tailed Student’s t‐test, P = 0.677. Shank2 +/+ n = 9, Shank2 −/− n = 9.
-
CShank2 −/− naive females fail to become maternal after repeated pup exposure, as demonstrated by the significant reduction of pup retrieval during trial 1–4 and the test session on day 5 compared to Shank2 +/+‐induced females, two‐way mixed ANOVA, effect of genotype: ***P < 0.001, effect of trial: P = 0.282, trial × genotype interaction: P = 0.168, Shank2 +/+ n = 9, Shank2 −/− n = 9.
-
DUpper Panel: Tracking path of Shank2 +/+ and Shank2 −/− mice during social exposure to pups in the 20‐min test session (trial 5). Shank2 +/+ female mice become attracted to the nest location engaging in maternal care responses, Shank2 −/− mice, however, display no preference for the pups, or participate in nest building (lower panel).
-
E–HRepeated pup exposure does not induce major components of social attachment behavior in Shank2 −/− females: (E) pup grooming, unpaired, two‐tailed Student’s t‐test, ***P < 0.001 (F) crouching, Mann–Whitney test, ***P < 0.001 and (G) nest building, Mann–Whitney test, ***P < 0.001, (H) maternal interaction, unpaired, two‐tailed Student’s t‐test, ***P < 0.001 (trial 5), Shank2 +/+ n = 9, Shank2 −/− n = 9.
-
I, JExamination of the neuronal activation pattern after pup presentation in Shank2 +/+ and Shank2 −/− mice using c‐FOS immunocytochemistry. Schematic map of the neuronal pathway regulating social attachment behavior in mice. Activation of the circuit starts via olfactory input (OB‐AON‐Amygdala) or tactile input from the pups to the MPOA of the hypothalamus and proceeds via the VTA‐NA‐VP axis to the output region of the circuit inducing attraction toward infants. After non‐exposure to pups and social exposure to pups (6 h), coronal sections (40 μm) of Shank2 +/+ and Shank2 −/− mice were prepared and the number of c‐FOS‐positive cells in this neuronal pathway analyzed. Shank2 −/− mice displayed major impairment in the neuronal activation pattern of the circuit regulating social attachment behavior in comparison with Shank2+/ + mice. AON, two‐way ANOVA, effect of genotype: P = 0.118, effect of pup exposure: **P = 0.003, pup exposure × genotype interaction: P = 0.561, AMY, two‐way ANOVA, effect of genotype: P = 0.227, effect of pup exposure: ***P < 0.001, genotype × pup exposure interaction: P = 0.073, LS, two‐way ANOVA, effect of genotype: ***P < 0.001, effect of pup exposure: ***P < 0.001, genotype × pup exposure interaction: ***P < 0.001, BNST, two‐way ANOVA, effect of genotype: P = 0.201, effect of pup exposure: ***P < 0.001, genotype × pup exposure interaction: P = 0.205, MPOA, two‐way ANOVA, effect of genotype: *P = 0.013, effect of pup exposure: **P = 0.003, genotype × pup exposure interaction: *P = 0.01. VTA, two‐way ANOVA, effect of genotype: **P = 0.008, effect of pup exposure: **P = 0.002, genotype × pup exposure interaction: **P = 0.007. NAcc, two‐way ANOVA, effect of genotype: **P = 0.003, effect of pup exposure: **P = 0.002, pup exposure × genotype interaction: **P = 0.014. Shank2 +/+ and Shank2 −/− without pup contact n = 3, Shank2 +/+ and Shank2 −/− with pup contact n = 5.
-
KRepresentative coronal brain section (left panel) and example of c‐FOS immunoreactivity in the MPOA (right panel) of Shank2 +/+ and Shank2 −/− pup‐exposed females (scale bar: 200 µm). The dotted line outlines the third ventricle (3V). Arrowheads indicate c‐FOS‐positive cells.
-
LLevels of synaptic proteins in the crude synaptosomes fraction (P2) from the hypothalamus of Shank2 +/+ and Shank2 −/− mice. Shank2 +/+ n = 5 (black bars), Shank2 −/− n = 5 (blue bars). Unpaired, two‐tailed Student’s t‐test.
Data information: All data are presented as mean ± SEM, NS: not significant.
Figure EV2. Shank2 −/− mice display no anxiety‐related behavior or social avoidance during pup presentation.
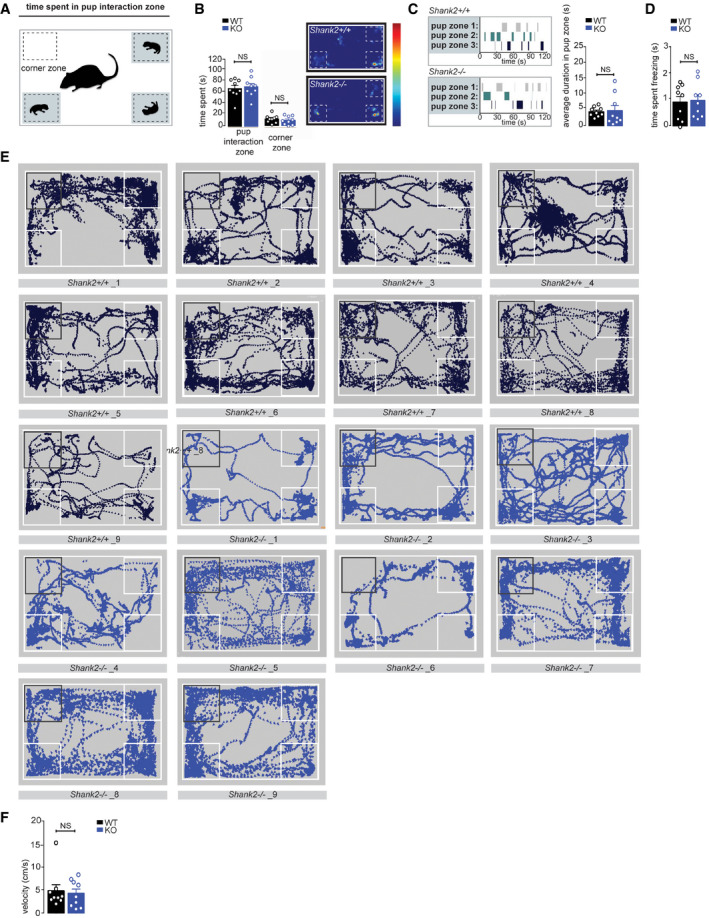
- Representative illustration of the pup interaction zones and corner zones. Time spent in pup interaction zone and corner zone was measured during the first 2 min of social investigation in the pup retrieval test (trial 1) in Shank2 +/+ and Shank2 −/− mice.
- Left diagram: No significant difference was detected comparing time spent in pup interaction zones (unpaired two‐tailed Student’s t‐test, P = 0.7090), and corner zones (unpaired, two‐tailed Student’s t‐test, P = 0.4597). Right diagram: Representative heat map tracings of Shank2 +/+ and Shank2 −/− mice. Hot colors indicate more time spent in a specific area, while cool colors represent less amount of time.
- Left diagram: Sample behavior raster blot showing average duration Shank2 +/+ and Shank2 −/− spent in pup interaction zones. Right diagram: No significant difference was detected comparing the average duration Shank2 +/+ and Shank2 −/− mice spent in the pup interaction zones (Mann–Whitney test, P = 0.3865).
- No significant difference was detected comparing the time spent freezing between Shank2 +/+ and Shank2 −/− mice (two‐tailed Student’s t‐test, P = 0.8329).
- Tracking paths of Shank2 +/+ and Shank2 −/− mice during the first 2 min of social exposure toward the pups.
- No significant difference was detected comparing the average movement velocity when Shank2 +/+ and Shank2 −/− mice did not engage in maternal behavior (trial 5, test day) (Mann–Whitney test, P = 0.8633). All graphs are presented as mean ± SEM, *P < 0.05, **P < 0.01, ***P < 0.001. Shank2 +/+ n = 9, Shank2 −/− n = 9.
Figure EV3. Social bonding behavior of male Shank2 −/− mice cannot be induced by social pup exposure.
-
ALeft panel: Maternal behavior can be induced in male mice through repeated social exposure to pups (trial 1–5). After repeated pup exposure (right panel), male mice started to retrieve pups and displayed maternal behavior by crouching over the pups, thereby becoming more attached to the nest location as displayed in the tracking path (right panel).
-
BNo significant difference was detected in the latency to approach the provided pups between Shank2 +/+ and Shank2 −/− male mice, Mann–Whitney test, P = 0.662.
-
CPup‐exposed male Shank2 −/−mice failed to become attached toward the pups after repeated exposure, as demonstrated by the failure to retrieve pups during trial 1–5 compared to Shank2 +/+ males, two‐way mixed ANOVA, effect of genotype: **P < 0.003, effect of trial: *P = 0.032, trial × genotype interaction: *P = 0.032.
-
D–HUpper panel: Representative tracking path of Shank2 +/+ and Shank2 −/− male mice during exposure to pups in the 20 min test session (trial: 5). Shank2 +/+ males spent the majority of their time on the nest location crouching over the pups; Shank2 −/− males displayed no preference for the nest location, or participate in nest building activity (lower panel). Additionally, all major components of maternal care responses (E) pup grooming, Mann–Whitney test, ***P < 0.001, (F) crouching, Mann–Whitney test, **P = 0.007, (G) nest building, Mann–Whitney test, **P = 0.002, (H) paternal interaction, Mann–Whitney test, ***P < 0.001, were significantly reduced in Shank2 −/− male mice. All graphs are presented as mean ± SEM, *P < 0.05, **P < 0.01, ***P < 0.001. Shank2 +/+ n = 8, Shank2 −/− n = 9.
To assess the functional specificity of SHANK2 within the circuit regulating social bonding, we used in situ hybridization to map the individual expression pattern of Shank2 within core regions of the circuit. We found that Shank2 mRNAs were only moderately expressed throughout the major nuclei of this neuronal pathway (Fig EV4A and B). Since neuroanatomical abnormalities have been reported in autistic patients, we also thoroughly analyzed the neuronal cytoarchitecture of Nissl‐stained coronal sections from adult Shank2 +/+ and Shank2 −/− mice and found no apparent alterations of the respective brain regions (Fig EV5A and B).
Figure EV4. Shank2 mRNA is moderately expressed in the circuit areas regulating social attachment behavior.
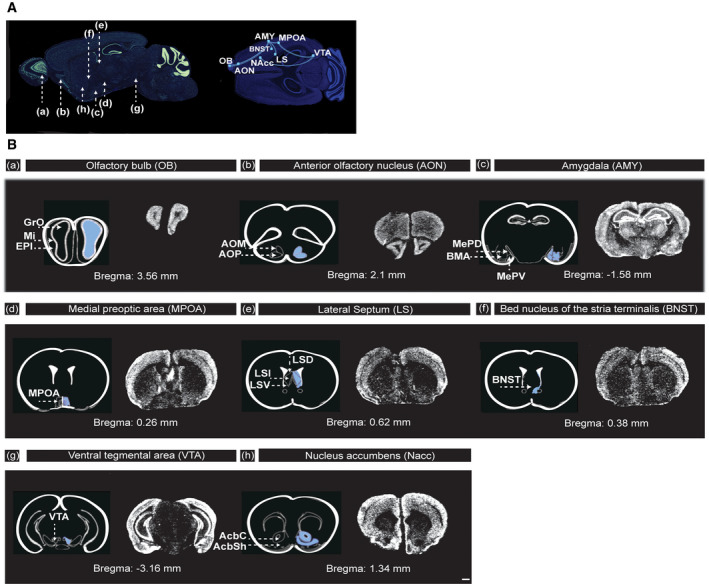
- Representative illustration of the neuronal pathway (a–g) involved in the regulation of social attachment behavior. (a) OB, olfactory bulb; (b) AON, anterior olfactory nucleus; (c) AMY, amygdala; (d) MPOA, medial preoptic area; (e) LS, lateral septum, (f) BNST, bed nucleus of the stria terminalis, (g) VTA, ventral tegmental area; (h) NAcc, nucleus accumbens.
- (a–h) Distribution of Shank2 mRNAs in major core regions of the neuronal circuit responsible for the regulation of social attachment behavior. Images shown are coronal brain sections (16 µm) of 8‐week‐old Shank2 +/+ mice, scale bar: 1 mm. In situ hybridization results indicated the expression levels of Shank2 in the (a) olfactory bulb (c) amygdala and (h) nucleus accumbens. GrO, granular cell layer of the olfactory bulb; Mi, mitral cell layer of the olfactory bulb; EPI, external plexiform layer of the olfactory bulb; AOM, anterior olfactory nucleus medial part; AOP, anterior olfactory nucleus posterior part; MePD, medial amygdaloid nucleus; BMA, basomedial amygdaloid nucleus, anterior part; MPOA, medial preoptic area; LSD, lateral septal nucleus, dorsal part; LSI, lateral septal nucleus, intermediate part; LSV, lateral septal nucleus, ventral part; BNST, bed nucleus of the stria terminalis; VTA, ventral tegmental area; AcbC, accumbens nucleus, core; AcbSh, accumbens nucleus, shell.
Figure EV5. Shank2 −/− mice display no gross abnormalities in the cytoarchitectonic organization of the circuit areas regulating social attachment behavior.
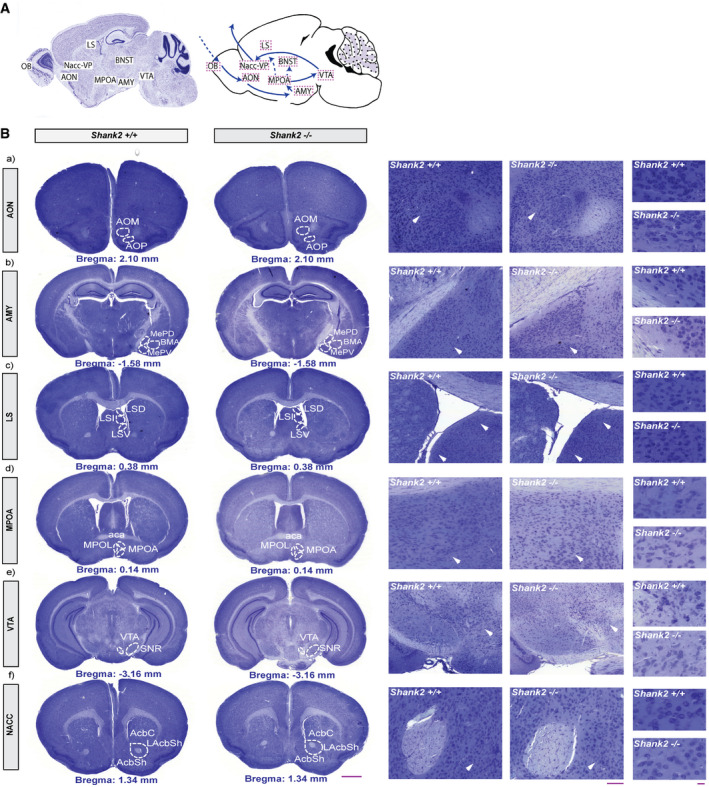
- Representative illustration of the neuronal pathway regulating social attachment behavior in mice. (a) OB, olfactory bulb; (b) AON, anterior olfactory nucleus; (c) AMY, amygdala; (d) MPOA, medial preoptic area; (e) LS, lateral septum, (f) BNST, bed nucleus of the stria terminalis, (g) VTA, ventral tegmental area; (h) NAcc, nucleus accumbens.
- Circuit‐specific comparison of the brain morphology between Shank2 +/+ and Shank2 −/− mice in low (left panel) and high (right panel) magnification view (a–f). Scale bars: 1 mm coronal section, 100 µm left magnification, 20 µm right magnification. Nissl‐stained coronal brain sections (16 µm) show similar brain morphology between Shank2 +/+ and Shank2 −/− mice at the age of 8 weeks. No major differences were evident in the neuroanatomical organization of the (a) AON, (b) Amy, (c) LS, (d) MPOA, (e) VTA, and (d) NAcc. AOM, anterior olfactory nucleus medial part; AOP, anterior olfactory nucleus posterior part; MePD, medial amygdaloid nucleus, posterodorsal part; MePV, medial amygdaloid nucleus, posteroventral part; BMA, basomedial amygdaloid nucleus, anterior part; LSD, lateral septal nucleus, dorsal part; LSI, lateral septal nucleus, intermediate part; LSV, lateral septal nucleus; aca, anterior commissure, anterior part; MPOL, medial preoptic nucleus, lateral part; MPOA, medial preoptic area; SNR, substantia nigra, reticular part; VTA, ventral tegmental area; AcbC, accumbens nucleus, core; AcbSh, accumbens nucleus, shell; LAcbSh, lateral accumbens shell.
Next, we analyzed the functional properties of the circuit regulating social bonding (Fig 5I). We used c‐FOS immunocytochemistry as a quantitative tool to map the neuronal activation pattern. To that end, naive Shank2 +/+ and Shank2 −/− mice were socially exposed to pup stimuli or no pup stimuli, and the expression of c‐FOS proteins was analyzed (Fig 5I and J). Notably, the results of these experiments revealed that the genetic ablation of Shank2 in mice profoundly impaired the neuronal activation pattern of the circuit regulating social bonding behavior (Fig 5J). c‐FOS expression was nearly absent in the MPOA and the associated downstream VTA‐NA axis, a central and evolutionary conserved key node and sensory relay station of social behavioral networks in vertebrates (Fig 5K).
To further elucidate, how the absence of SHANK2 might affect the biochemical synaptic profile of the hypothalamus, we prepared PSD‐enriched fractions of the hypothalamus from Shank2 +/+ and Shank2 −/− mice and performed semi‐quantitative analyses using Western blotting for several scaffold proteins and glutamate receptor subunits (Fig 5L; Appendix Fig S3A–C). Interestingly, we found no significant alterations in the levels of PSD‐95 and Homer1b in PSD‐enriched fractions of the hypothalamus. However, we detected a trend toward an increase in mGluR5 levels in Shank2 −/− mice, suggesting impaired mGluR5‐mediated signaling in the hypothalamus of Shank2 −/− mice (Fig 5L).
Targeted activation of MPOA neurons in the hypothalamus reinforces social bonding behavior in Shank2 −/− mice
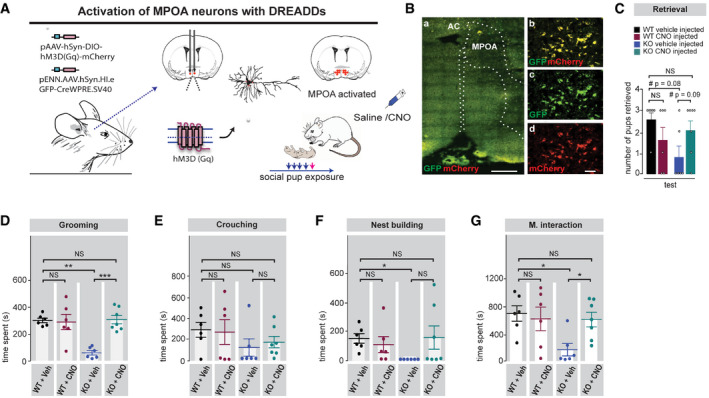
Based on our finding that pup exposure in Shank2 −/− mice induced no neuronal activation in the MPOA‐associated reward pathway (VTA‐NAcc) of the circuit, we followed first the idea that a systemic manipulation of the dopaminergic system might be able to restore social bonding behavior in Shank2 −/− mice. However, chronic treatment with the dopaminergic agonist apomorphine was unable to rescue social bonding behavior in Shank2 −/− mice. Next, we asked whether a direct chemogenetic stimulation of the pathway regulating social attachment behavior might alter the impairments of social bonding in Shank2 −/− mice. Since the MPOA is thought to be one of the critical nodes of the circuit, and Shank2 −/− mice displayed a profound reduction in c‐FOS expression within this area after pup exposure, we decided to target MPOA neurons of the circuit using the Cre‐dependent DREADD (Designer Receptors Exclusively Activated by Designer Drugs) technology (Fig 6A). To this end, naive Shank2 +/+ and Shank2 −/− mice were co‐infected by stereotactic injection of Cre‐inducible DREADD receptors (DREADD(Gq)‐mCherry) and AAV.hSyn.HI.eGFP‐Cre in the MPOA region. This strategy resulted in selective Gq‐DREADD expression within the MPOA, as shown by double labeling for the Gq‐DREADD reporter mCherry and the GFP‐Cre expression (Fig 6B) allowing us to activate neurons in the MPOA. After 4 weeks, Clozapine‐N‐oxide (CNO, 5 mg/kg) was administered subcutaneously to activate hm3Dq in the MPOA during pup exposure in naive Shank2 +/+ and Shank2 −/− mice. Remarkably, Shank2 −/− mice treated with CNO showed substantial recoveries in major components of social attachment behavior such as maternal interaction and pup grooming behavior (Fig 6C–G). These social responses remained impaired in vehicle‐treated Shank2 −/− mice. These results demonstrate that the chemogenetic activation of MPOA neurons alone is sufficient to restore components of social attachment behavior in Shank2 −/− mice (Fig 7).
Figure 6. DREADD‐based activation of MPOA neurons ameliorates social bonding in Shank2 −/− mice.
-
AShank2 +/+ and Shank2 −/− mice were bilaterally injected with a Cre‐dependent DREADD virus (pAAV‐hSyn‐DIO‐hM3D (Gq)‐mCherry) and (pENN.AAV.hSyn.HI.eGFP‐Cre)) into the MPOA region. After 4 weeks, a pup exposure assay was performed once a day for 5 days after intraperitoneal injection of vehicle or 5 mg/kg CNO (30 min before pup exposure). Maternal behavior was analyzed at the final 20 min of pup exposure on day 5 (test day).
-
BConfocal images showing the location and expression of the stereotaxically injected viral constructs in the MPOA region. (a) Merge of GFP(CRE) and mCherry (DREAAD) (scale bar: 500 µm) (b–d) Magnified views of the MPOA region (scale bar: 20 µm), (b) GFP and mCherry merge, (c) GFP, (d) mCherry. The dotted lines outline the MPOA and the third ventricle (middle line).
-
CA significant genotype × treatment interaction was detected for pup retrieval, two‐way ANOVA, effect of genotype: P = 0.187, effect of treatment: P = 0.759, genotype × treatment interaction: *P = 0.031. Shank2 +/+ vehicle injected n = 6, Shank2 −/− vehicle injected n = 6, Shank2 +/+ CNO injected n = 6, Shank2 −/− CNO injected n = 7.
-
D–GDREADD activation by CNO injection selectively rescues major components of social attachment behavior in Shank2 −/− mice: (D) grooming, two‐way ANOVA, effect of genotype: *P = 0.018, effect of treatment: **P = 0.002, genotype × treatment interaction: ***P = 0.001. (E) Crouching, two‐way ANOVA, effect of genotype: P = 0.091, effect of treatment: P = 0.869, genotype × treatment interaction: P = 0.663, (F) nest building, two‐way ANOVA, effect of genotype: P = 0.415, effect of treatment: P = 0.341 genotype × treatment interaction: P = 0.093, (G) Maternal interaction, two‐way ANOVA, effect of genotype: *P = 0.034, effect of treatment: P = 0.149, genotype × treatment interaction: *P = 0.045. Shank2 +/+ vehicle injected n = 6, Shank2 −/− vehicle injected n = 6, Shank2 +/+ CNO injected n = 6, Shank2 −/− CNO injected n = 7.
Data information: All data are presented as mean ± SEM, NS: not significant. AC, anterior commissure and MPOA, medial preoptic area.
Figure 7. Chemogenetic activation of MPOA neurons in the hypothalamus restores impaired social attachment behavior in Shank2 −/− mice.
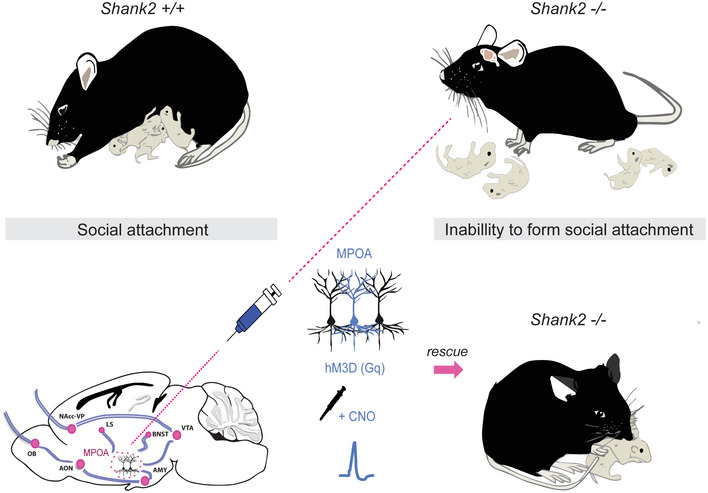
Activation of hM3D (Gq) DREADD receptors expressed within the MPOA by CNO rescues main aspects of maternal behavior in Shank2 −/− mice. in the MPOA by CNO rescues main aspects of maternal behavior in Shank2 −/− mice.
Discussion
Deficits in reciprocal social interactions and affiliation are one of the most prominent core manifestations of ASD (Barak & Feng, 2016). Social impairments are present from very early infancy, and it has been postulated that social capacities involving sharing of emotions, appropriate use of social imitation, the ability to form social bonds, as well as social responsiveness are in particular impaired in human subjects with ASD (Bauminger et al, 2003). However, given that social behavior is uniquely complex and that circuits regulating social behavior are modulated by social experience, internal state and require multi‐sensory integration (Burke et al, 2017) little is known about the underlying mechanisms and the etiology how these social deficits in ASD arise. Neuroimaging studies in human ASD patients provide evidence for hypo‐activation and reduced functional connectivity in brain regions involved in the processing of social information (Hadjikhani et al, 2007; Pinkham et al, 2008; Kron et al, 2012; Sato et al, 2012; Lloyd‐Fox et al, 2013; von dem Hagen et al, 2013). In particular, it has been suggested that deficits of the oxytocin system or a dysfunction of the mesolimbic reward pathway underlie the social interaction impairments in ASD (Neuhaus et al, 2010; Scott‐Van Zeeland et al, 2010; Kohls et al, 2013; Dölen, 2015).
Here, we demonstrate that in the Shank2 −/− ASD mouse model, social attachment, and social bonding are indeed non‐existent. Furthermore, we provide compelling evidence that the chemogenetic activation of MPOA neurons in the hypothalamus is sufficient to restore the expression of social attachment behavior in Shank2 −/− mice. These results underline the importance and overarching control of this brain region in the regulation of social attachment behavior that has also been demonstrated in further recent studies (Wu et al, 2014; Kohl et al, 2018). Based on the findings of our study, we propose that the primary defect in the circuit processing social attachment behavior might arise in brain areas activating MPOA neurons or directly in the MPOA, a subcortical relay station of the hypothalamus, where relevant sensory inputs are interconnected to higher‐order centers of the brain (Numan, 2007; Kohl et al, 2017). MPOA neurons receive social information from virtually every sensory modality and coordinate these sensory inputs to distinct areas of the social network, including the VTA‐associated reward pathway (VTA‐Nacc) (Numan, 2007; Kohl et al, 2018). Therefore, an intervention targeting this area may be a promising therapeutic strategy to modify social deficits of individuals with ASD.
Importantly, as it has been reported for the postpartum situation, a mostly hormone‐independent induction of maternal behavior by repeated pup exposure also shows strong c‐FOS expression in the MPOA region (Flemming et al, 1994; Stack & Numan, 2000). A significant portion of these scattered c‐FOS expressing neurons contains galanin (GAL) and controls parenteral behavior when activated (Wu et al, 2014). In the present study, we could show that pup‐induced c‐Fos expression was strongly reduced in the MPOA region of Shank2 −/− mice. These findings implicate that synaptic SHANK2 signaling‐complexes are indeed directly or indirectly active in GAL and c‐FOS positive neurons of the MPOA, and their intact function is necessary to trigger social attachment behavior. The current finding is also supported by evidence that GAL‐positive neurons within the MPOA are innervated by glutamatergic synaptic terminals coming from the posterior intralaminar complex of the thalamus (Cservenák et al, 2017). Further, since apomorphine, a purely dopaminergic agonist, was not able to rescue social bonding in Shank2 −/− mice, we validate a significant contribution of the glutamatergic system to the observed phenotype.
The notion that activity of MPOA neurons has direct social behavioral relevance is further supported by current studies that have directly or indirectly manipulated MPOA activity, leading to respective changes in social attraction or parenteral care in mice (Geissler et al, 2013; Wu et al, 2014; McHenry et al, 2017; Kohl et al, 2018; Fang et al, 2018). An open question is, how exactly the genetic disruption of Shank2 impairs the neuronal activation of c‐FOS‐positive neurons within the MPOA. Absence of SHANK2 might reduce synapse number or impair the signaling machinery of synapses in GAL‐positive neurons (connectivity defect), or the deletion of SHANK2 might reduce the activation‐capability of neurons impinging on GAL‐positive neurons within the MPOA (Cservenák et al, 2017). Interestingly, GAL‐positive neurons have been identified to constitute a primarily GABAergic neuronal population within the MPOA region of the hypothalamus (Wu et al, 2014; Kohl et al, 2018). Selectively activating GABAergic neurons within the MPOA could provide further insights into the control of the circuit activity in future. In this respect, it is worth mentioning that SHANK2 expression has recently been shown in GAD‐67‐positive GABAergic neurons supporting the idea that SHANK2 may also have a particular function in these inhibitory neurons (Lee et al, 2018).
However, so far, the capability to form social attachment was not explicitly investigated in detail in mouse models with a neuron‐specific Shank2 deletion (Kim et al, 2018; Lee et al, 2018). Our experiments do not entirely rule out the possibility that social attachment deficits might arise secondarily from other ASD‐related co‐morbidities in Shank2 −/− mice that have not been studied well so far. It should also be noted that humans with SHANK2 haploinsufficiency are often diagnosed with autistic disorders in combination with mild to moderate ID, but also poor communication skills and eye contact, and anxious features are frequently observed within the phenotypic spectrum of the condition (Caumes et al, 2020).
The specific role of attachment in the etiology of social impairments in ASD remains poorly understood (Vivanti & Nuske, 2017). For a long time, the inability to form social attachment or relationships has been seen as a primary characteristic of ASD (Kanner, 1968). However, studies have shown that social attachment can form in individuals with ASD (Kahane & El‐Tahir, 2015), although reported data are conflicting (Rutgers et al, 2004; van Ijzendoorn et al, 2007). It has been suggested that attachment may not be as prevalent as in typically developing children (Kahane & El‐Tahir, 2015). Similarly, recent studies have demonstrated that only a minority of adults or children with high functioning autism develops secure attachment behavior (Rutgers et al, 2007; Taylor et al, 2008) or demonstrate avoidant attachment patterns (Lamport & Turner, 2014; Gallitto & Leth‐Steensen, 2015). Supporting the model that impaired attachment behavior is a common feature of ASD behavior, the disruption of the infant to mother attachment has recently also been reported in the Nbea +/− ASD mouse model (Stroobants et al, 2020).
In conclusion, our study suggests that the formation of attachment is impaired in Shank2 −/− mice and can be restored by activation of neurons in the MPOA. Given that abnormal social attachment and bonding may be a critical factor in the development of social impairments in ASD, further investigation of the identified circuit can provide valuable insights into the pathomechanisms of social alterations in ASD.
Materials and Methods
Animals
The generation of Shank2 −/− mice has been reported previously (Schmeisser et al, 2012). All mice were backcrossed to a C57BL/6J background for more than ten generations. Mice were generated by cross‐breeding of Shank2 +/− mice to produce littermate pairs of Shank2 +/+ and Shank2 −/−. Pups were kept with the dam until weaning at postnatal day 21. After weaning, all mice were housed in mixed‐genotype groups of 3–4 per cage and randomly selected for behavioral or biochemical experiments. All mice were bred and housed according to standard laboratory conditions and provided with food and water available ad libitum. The housing room was maintained at 22°C, with lights automatically turned on/off in a 12 h rhythm (lights on at 7 am). All animal experiments were performed in compliance with the guidelines for the welfare of experimental animals issued by the Federal Government of Germany and the local ethics committee (Ulm University; ID Number: O.103 ‐7 and 1163).
Primary antibodies
Primary antibodies used for immunocytochemistry were purchased from commercial suppliers: anti‐c‐FOS (4): sc‐52 (dilution: 1:200, Santa Cruz, #F0215) and anti‐c‐FOS (dilution: 1:1,000, Abcam, #ab208942). For Western blotting, the following primary antibodies were purchased from commercial suppliers: anti‐PSD95 (dilution 1:4,000, Synaptic Systems, #124011), anti‐Homer1 (dilution 1:10,000, Synaptic Systems, #160022), anti‐mGluR5 (dilution 1:1,000, Millipore, #2757164), and anti‐Beta III Tubulin (dilution 1:250,000, Covance, #PRB‐435P).
Secondary antibodies
Secondary antibodies used for immunocytochemistry were all coupled to Alexa Fluor® 488 (dilution: 1:500, Life Technologies). Secondary antibodies used for Western blotting were HRP‐conjugated antibodies anti‐rabbit HRP (dilution 1:1,000, Dako, Hamburg, Germany, #P0448, LOT #20042622) and anti‐mouse HRP (dilution: 1:3,000, Dako, Hamburg, Germany, #P0260, LOT #20030273).
Biochemistry and quantitative immunoblot analyses
Subcellular fractionation of mouse brain tissue isolated from 9‐ to 12‐week‐old Shank2 +/+ and Shank2 −/− mice was performed as described previously with minor modifications (Distler et al, 2014). The brain regions were dissected, and tissue was homogenized with the Teflon douncer in buffer 1 (10 mM HEPES pH 7.4, 2 mM EDTA, 5 mM sodium orthovanadate, 30 mM sodium fluoride, 20 mM β‐glycerolphosphate, protease inhibitor cocktail (Roche)) with 12 strokes at 900 rpm. The homogenates were centrifuged at 500 × g for 5 min at 4°C to remove nuclei, extracellular matrix, and cell debris (all included in pellet P1) from the further procedure. Supernatant S1 was collected and centrifuged at 10,000 × g for 15 min at 4°C to separate the crude membrane fraction (P2) and the cytosol (S2). Pellet P2 was resuspended in 500 µl buffer 2 (50 mM HEPES pH 7.4, 2 mM EDTA, 2 mM EGTA, 5 mM sodium orthovanadate, 30 mM sodium fluoride, 20 mM β‐glycerolphosphate, 1% Triton X‐100, protease inhibitor cocktail (Roche)) and centrifuged at 20,000 × g for 80 min at 4°C to obtain pellet P3 (Triton X‐100 insoluble PSD fraction) and supernatant S3 (Triton X‐100 soluble synaptic cytosol). Pellet P3 was resuspended in 50 µl buffer 3 (50 mM Tris pH 9, 5 mM sodium orthovanadate, 30 mM sodium fluoride, 20 mM β‐glycerolphosphate, 1% NaDOC, protease inhibitor cocktail (Roche)) and frozen in liquid nitrogen to be stored at −80°C. Bradford analysis was performed to measure protein concentrations. 3 μg of total protein was loaded in 4× SDS sample buffer on an SDS–PAGE and subsequently blotted on nitrocellulose membranes. After incubation with the primary antibodies and an HRP‐conjugated secondary antibody, signals were visualized with the Pierce ECL Western blotting substrate and further detected with the MicroChemi 4.2 machine. For quantitative analysis, the gray value of each band was analyzed with GelAnalyzer software.
Immunocytochemistry
Free‐floating immunostaining
Mice were deeply anesthetized by intraperitoneal injection of ketamine 100 mg/kg and xylazine 16 mg/kg, solubilized in a NaCl solution, and then transcardially perfused with 25 ml cooled PBS and 50 ml paraformaldehyde 4%. Mice were then decapitated, and the brains were post‐fixed overnight in 4% paraformaldehyde and submerged in 30% sucrose in 0.1 M PBS (pH 7.4). Finally, brains were frozen in OCT compound and stored at −80°C until the day before cryostat sectioning. One day before sectioning, brains were put at −20°C to adapt to the cutting temperature (−22°C). 40 μm coronal brain sections were cut on a cryostat (Leica CM3050 S). The free‐floating sections were then transferred to PBS without calcium and magnesium (PBS−/−) and blocked (3% BSA + 0.1% Triton X‐100, diluted in PBS−/−) for 2 h at RT on a horizontal shaker. Coronal sections were then incubated for a period of 48 h at 4°C with primary antibodies and subsequently washed 3× in PBS−/− for 15 min at RT. After washing, sections were incubated for a period of 2 h at RT with fluorophore‐conjugated secondary antibodies coupled to Alexa Fluor® 488 (Life Technologies, dilution 1:500). The sections were rewashed 3× in PBS−/− for 15 min at RT and mounted with Moviol containing diluted 4,6‐diamidino‐2‐phenylindole DAPI (dilution 1:50,000).
DAB immunostaining
Coronal sections (40 μm) were cut on a cryostat (Leica CM3050 S) and fixed for 1 h in 4% PFA. Subsequently, slides were washed 3× in 0.1 M phosphate buffer (pH 7.4) and incubated for 45 min in 0.2% Triton X‐100 and 0.1 M phosphate buffer. Slides were rewashed 3× using 0.1 M phosphate buffer (pH 7.4) and incubated for 20 min in 1% hydrogen peroxide. After 20 min, sections were rewashed three times in 0.1 M phosphate buffer (pH 7.4) and blocked for 30 min in 2% goat serum diluted in 0.1 M phosphate buffer (pH 7.4). After blocking, sections were incubated overnight at RT with the primary c‐FOS antibody (c‐FOS (4): sc‐52, Santa Cruz Biotechnology, diluted 1:500 in 2% goat serum). Next morning, slices were washed 3× using 0.1 M phosphate buffer (pH 7.4) and incubated for 1 h with horseradish peroxidase‐conjugated secondary antibody (goat‐anti‐rabbit IgG/HRP PO 448, Dako, Germany, diluted in 0.1 M phosphate buffer, 1:200, or goat‐anti‐mouse IgG/HRP ab205719). After rewashing the slices for 3× in 0.1 M phosphate buffer, peroxidase reaction was performed using diaminobenzidine (DAB) and hydrogen peroxide (H2O2) and intensified by nickel chloride (8%). After 7 min incubation, slices were rewashed 3× in 0.1 M phosphate buffer and dehydrated for 5 min in a series of ethanol baths (70, 90, 2 × 100% ethanol), following three xylene incubations (5 min each). Finally, sections were embedded in Entellan.
Microscopic analysis
Brain areas were selected according to the mouse brain atlas of Paxinos and Franklin (Paxinos & Franklin, 2004) from each of the following brain regions and analyzed as described (Matsushita et al, 2015) (AON, LS, BNST, AMY, MPOA, NAcc at the following bregma coordinates: anterior olfactory nucleus (AON; 2.1 mm, plate: 13), lateral septum (LS; 0.62 and 0.38 mm, plate: 26,28), bed nucleus of the stria terminalis (BNST; 0.62 and 0.38 mm, plate: 26,28), cortical and medial amygdala (cAMY: anterior cortical amygdaloid area, posterolateral cortical amygdaloid area; mAMY: medial amygdaloid nucleus, posterodorsal part, medial amygdaloid nucleus, posteroventral part, −1.34 and −1.58 mm, plate: 42,44), medial preoptic area (MPOA; 0.14 mm, 0.02 mm, −0.1 mm, plate: 30,31,32), ventral tegmental area (VTA; −3.16 and −3.28 mm, plate: 57,58) nucleus accumbens (NAcc: NAcc core, NAcc shell); 1.34 and 1.18 mm, plate: 20,21). Images were obtained with an upright Axioscope microscope equipped with a Zeiss CCD camera (16 bits; 1,280 × 1,024 ppi) using Axiovision software (Zeiss). c‐FOS‐positive cells were counted in the bilateral areas of each section using ImageJ 1.50i. The same threshold was applied for corresponding sections. Across the two sections of each brain region, the average was calculated for each subject.
Nissl staining
Nissl staining was performed on paraffin sections (16 µm thickness) of 8‐ to 9‐week‐old Shank2 +/+ and Shank2 −/− mice. For Nissl stainings, the sections were hydrated in 0.5% w/v cresyl violet (Merck Millipore) for 3 min. After rinsing, sections were dehydrated and mounted with Entellan mounting medium. Images were taken with a Mirax scanner (Carl Zeiss, Germany).
Mammary gland whole‐mount preparation
Mammary glands were dissected from 8‐ to 10‐week‐old naive and pregnant (1 day before delivery) Shank2 +/+ and Shank2 −/− female mice as previously described (Plante et al, 2011). The No. 4 (inguinal) glands were stretched on a glass slide and subsequently fixed at 4°C overnight, by Carnoy’s fixative (100% ethanol, chloroform, glacial acetic acid, 6:3:1). On the next day, mammary glands were washed with 70% ethanol for a period of 15 min. Subsequently, mammary glands were rehydrated gradually using water baths for incubation of 5 min each in the sequence 70‐, 35‐, 15%‐ ethanol, and finally ddH2O. Glass slides were then placed in carmine alum staining solution overnight at room temperature. On the next day, carmine alum stained mammary glands were gradually dehydrated for a period of 5 min by a series of ethanol baths in the following sequence (50, 70, 95, 100%) flowed by 5‐min xylene incubation. Glass slides were then put in methyl salicylate solution, which was placed under the fume hood overnight. The next day, mammary glands were embedded in Entellan. Images were taken with a Leica M80 microscope.
Oxytocin‐induced milk ejection
Milk ejection of mammary glands was induced as previously described (Plante et al, 2011). Briefly, mice were sacrificed and the thoracic mammary glands (No. 2–3) of Shank2 +/+ and Shank2 −/− dams were incubated with oxytocin solution (1 mg/ml, Sigma‐Aldrich). After 1 min, the oxytocin solution was carefully removed with a transfer pipette and the milk entry into the ducts monitored.
Electron microscopy
Pituitary glands were removed from the brain of 10‐ to 12‐week‐old Shank2 +/+ and Shank2 −/− mice and incubated in immersion fixation [2% paraformaldehyde, 2.5% glutaraldehyde, 1% saccharose, diluted in 0.1 M cacodylate buffer (pH 7.4)] overnight. The next day, samples were washed in 0.1 M cacodylate buffer (pH 7.4) for 1 h. The samples were dehydrated and stained with 2% uranyl acetate and embedded in epoxy resin. Ultrathin sections were cut in the facility for electron microscopy (EM), University of Ulm and analyzed by transmission electron microscope LEO912 Omega (Zeiss) at 120 kV. For quantitative analysis of the vesicle number in the pituitary gland, we analyzed three independent Shank2 +/+ and Shank2 −/− littermates (per animal n = 50 pictures) using ImageJ 1.50i.
Quantitative Real‐time PCR
Isolation of total RNA from Shank2 +/+ and Shank2 −/− mice was performed using the RNeasy® kit (Qiagen, Germany) as described by the manufacturer. Isolated RNA was stored in RNase‐free water at −80°C. Quantitative real‐time reverse transcription PCR (qRT–PCR) was carried out in a one‐step, single‐tube format using the Rotor‐Gene™ SYBR®‐Green RT–PCR FAST Kit (Qiagen) as previously described (Grabrucker et al, 2014). Data were analyzed using the hydroxymethylbilane synthase (HMBS) gene to normalize transcript levels. Cycle threshold (c t) values were calculated by the Rotor‐ Gene‐Q Software (version 2.0.2, Qiagen). All reactions were run in technical triplicates, and mean c t values for each reaction were taken into account for data analysis. To ascertain primer specificity, a melting curve was obtained for the amplicon products to determine their melting temperatures. For all genes analyzed, commercially available QuantiTect primers from Qiagen were used.
In situ hybridization
In situ hybridization was performed as described previously (Boeckers et al, 2005). Briefly, reactions were performed with 16 µm cryosections from freshly frozen 8 weeks old Shank2 +/+ brain mouse sections which were cut on a cryostat (Leica CM3050 S). Transcripts encoding Shank2_Ex7 were detected with an S35 labeled cDNA antisense oligonucleotide (5′‐GCA GGG CTG GAA ATG CTG GCG TGG GTG TGA ATT CCT CAA T‐3′) purchased from Eurofins MWG Operon (Ebersberg, Germany).
Enzyme‐Linked Immunosorbent Assay
Plasma oxytocin peptide‐level measurements
Blood was collected via cardiac puncture from 8‐ to 10‐week‐old naive Shank2 +/+ and Shank2 −/− mice in tubes containing EDTA (2 mg/ml) as an anticoagulant and aprotinin (0.6 trypsin inhibitory units (TIU)/ml of blood) was added to inhibit the activity of proteinases. Blood was immediately centrifuged at 1,600 × g for 15 min at 4°C. The resulting supernatant (plasma) was collected. Oxytocin peptide was extracted from plasma according to the manufacturer’s instructions. Briefly, plasma was acidified by adding 500 μl of buffer A, mixed, and subsequently centrifuged at 12,000 × g for 20 min at 4°C. Acidified plasma was loaded on equilibrated SEP‐Columns containing 200 mg of C18. Columns were washed twice with 3 ml of buffer A and eluted with 3 ml of buffer B. The eluent was collected in polystyrene tubes and evaporated to dryness using a centrifugal concentrator (SpeedVac). The dried extract was reconstituted with 1× assay buffer. Oxytocin concentration was measured using an Enzyme‐Linked Immunosorbent Assay (ELISA) kit (Enzo Life Science, ADI‐901‐153), according to the manufacturer’s instructions.
Brain tissue oxytocin peptide‐level measurements
Mice were sacrificed between the age of 8–10 weeks using CO2, followed by decapitation. The hypothalamus and pituitary gland were immediately dissected from the brain and snap‐frozen in liquid nitrogen and stored at −80°C. Oxytocin peptide was extracted from neuronal tissue, according to the manufacturer’s instructions. Briefly, tissue was weighted and subsequently homogenized in three parts of 50% acetic acid containing protease inhibitor using a pulse sonicator. The total protein concentration was measured using a NanoDrop. After homogenization, the tissue was boiled for 10 min at 100°C. Cell debris was removed by centrifugation of the tissue homogenate at 11,000 g for 30 min at 4°C. The supernatant was carefully removed and combined with the same amount of buffer A to acidify the sample. Subsequently, the tissue homogenate was centrifuged for 20 min at 12,000 × rpm. The resulting supernatant was collected and loaded on an equilibrated SEP‐Column containing 200 mg of C18. Columns were washed slowly with 3 ml of buffer A, and finally, the peptide was eluted with 3 ml of buffer B. Eluant was evaporated to dryness using a centrifugal concentrator (SpeedVac). The dried extract was kept at −20°C as pellet overnight until reconstitution. The concentration of oxytocin of the tissue was determined using an enzyme‐linked immunoassay kit (Phoenix Pharmaceuticals, EK‐051‐01), according to the manufacturer's instructions.
Plasma progesterone level measurements
Blood was collected via cardiac puncture from 8‐ to 10‐week‐old Shank2 +/+ and Shank2 −/− dams (postnatal day 0) in tubes containing EDTA (2 mg/ml) as an anticoagulant and aprotinin (0.6 trypsin inhibitory units TIU/ml of blood) was added in order to inhibit the activity of proteinases. Blood was immediately centrifuged at 1,600 × g for 15 min at 4°C. The resulting supernatant (plasma) was collected. Progesterone concentration of the plasma was determined using an enzyme‐linked immunoassay kit (Enzo Life Science, ADI‐900‐011), according to the manufacturer’s instructions.
Plasma prolactin level measurements
Blood was collected via cardiac puncture from 8‐ to 10‐week‐old Shank2 +/+ and Shank2 −/− dams (postnatal day 0) in tubes containing EDTA (2 mg/ml) as an anticoagulant and aprotinin (0.6 trypsin inhibitory units TIU/ml of blood) was added in order to inhibit the activity of proteinases. Blood was immediately centrifuged at 1,600 × g for 15 min at 4°C. The resulting supernatant (plasma) was collected. Prolactin concentration of the plasma was determined using an enzyme‐linked immunoassay kit (Abcam, ab100736), according to the manufacturer’s instructions.
Plasma estradiol level measurements
Blood was collected via cardiac puncture from 8‐ to 10‐week‐old Shank2 +/+ and Shank2 −/− dams (postnatal day 0) in tubes containing EDTA (2 mg/ml) as an anticoagulant and aprotinin (0.6 trypsin inhibitory units TIU/ml of blood) was added in order to inhibit the activity of proteinases. Blood was immediately centrifuged at 1,600 × g for 15 min at 4°C. The resulting supernatant (plasma) was collected. To assure the measurement of 17‐beta‐estradiol in each mouse, the plasma was concentrated to times (2×) with amicon filters with a molecular cutoff of 10 kDa. The levels of estradiol were assessed using an enzyme‐linked immunoassay kit (Abcam, ab108667), according to the manufacturer’s instructions.
Behavioral studies
Breeding for behavioral experiments
Shank2 −/− and Shank2+/+ females were mated with wild‐type males at the age of 7–8 weeks. Upon pregnancy, Shank2 +/+ and Shank2 −/− were housed separately with a cotton nestlet (5 × 5 cm) available for nest building. The morning after birth, the number of pups born, and pup weight was assessed. Additionally, each neonatal pup was inspected for the following parameters: (i) removal or attachment of placenta, (ii) removal of extra‐embryonic tissue, and (iii) the number of pups which were scattered in the home cage (pups separated from each other > 5 cm) and compared to number of pups gathered in the nest area.
Cross‐fostering experiments
Age‐matched pups were placed into the nest of the recipient female the morning after delivery. Bodyweight of the pups was assessed for 1–7 postnatal days.
Retrieval experiments in postpartum females
Maternal behavior in postpartum females was assessed on postnatal day 1 and postnatal day 2 after delivery. Observation and recordings were made in a soundproof anechoic room. A video camera (Conrad CCD camera S/W) was mounted above the cage to allow observation and tracking of maternal behavior. Tracking was performed by the EthoVision XT (Noldus, Wageningen, Netherlands). One hour before the test, the own pups of the mother were removed from the home cage and kept warm. At the beginning of the test, the mother was briefly removed from the home cage and three not related 1–3 old naive C57BL/6J pups were placed in each corner of the cage that did not contain the nest. The mother was returned to the corner of the nest facing the wall. During the next 30 min, the behavior of the mother was recorded. Maternal behavior was assessed after a method described previously (Calamandrei & Keverne, 1994; Brown et al, 1996; Wu et al, 2014). Retrieval of the pups was defined as the mother picking up the pup from the corner and transporting it to the nest. Retrieval was only scored if the mother placed the pup entirely into the nest. If the mother dropped the pup on the route to the nest, retrieval was not counted.
Additionally, the following behavioral responses were scored: latency to approach the pup (first nose contact with the a pup (< 1 cm), grooming (sniffing and licking of the pups), crouching (mother laying in a nursing posture on top of the pups, at least two collected pups under the ventral side of the body), nest building (mother engages in nest building, collects, or arranges nest material), and maternal interaction (calculated as the cumulative time spent grooming, crouching, and nest building). For postpartum females, a second identical session of pup—retrieval was performed 1 day later (48 h after delivery). If a subject mouse displayed any signs of pup directed aggression, the assay was immediately ended.
Maternal behavior of virgin female mice
Maternal behavior of virgin females was assessed during five consecutive days with 20‐min exposure to pups each day before testing on day 5. Virgin female mice were housed in a group of 2–3 female littermates until they reached adulthood at the age of 8 weeks. Female mice that had never been exposed to pups before were housed individually for 2 days in standard plastic cages and were provided with nesting material and food and water available ad libitum. During the 5 days exposure to pups, the home cage was not cleaned and nesting material was not removed to minimize disturbance of the female. On days 1–5, females were exposed to 1‐ to 3‐day‐old C57BL/6J pups, which were placed in the recipient female’s home cage as described above. The pups were removed after 20 min, and behavior was analyzed and scored as described above. Average velocity was determined during the 20‐min test session when Shank2+/+ and Shank2 −/− mice did not engage in maternal behavior (retrieving, grooming, crouching, or nest building) using EthoVision XT software (Noldus, Wageningen, Netherlands).
Social anxiety of virgin female mice
To determine whether the pups induce social anxiety in Shank2+/+ and Shank2 −/− mice, recorded videos of the first trial of the pup retrieval test (day 1) were center‐point tracked during the first 2 min of social exposure toward the pups using EthoVision XT software (Noldus, Wageningen, Netherlands). During this period, Shank2+/+ and Shank2 −/− mice did not start to retrieve the pups and socially investigated the provided pups. The area of the home cage was divided into three pup interaction zones (corners containing pups, 6 cm × 6 cm) and corner zone (corner containing no pups, 6 cm × 6 cm). The total amount of time and average time Shank2+/+ and Shank2 −/− mice spent in the pup interaction zone and corner zone were measured using EthoVision XT software. An entry was defined as the center point of each mouse was in one of the pup interaction zones or corner zone. We also quantified manually time spent freezing with a stopwatch during the social investigation of the pups. Freezing was defined as the cessation of all body movements, except respiratory movements.
Parental behavior in male mice
Male mice were housed in groups of 2–3 male littermates. At the age of 7 weeks, they were individually housed for 2 days, provided with nesting material as well as food and water available ad libitum. The test paradigm was identical to virgin female mice. Male mice that displayed any signs of pup directed aggression were immediately removed and excluded from the test.
Olfactory habituation/dishabituation test
Mice were tested in the habituation/dishabituation test to assess their ability to detect and differentiate nonsocial and social odors after a method previously described (Yang & Crawley, 2009). Behavior was recorded in a soundproof chamber under a dim red light (15 lux). To avoid object neophobia, mice were habituated for 30 min to the test cage, containing a sterile dry cotton swab. After the habituation period, nonsocial odors, as well as social odors, were presented on cotton applicators inserted in sequential series in the cover‐lid for 2 min (inter‐trial interval 1 min). 50 μl of social and nonsocial odors were presented in the following order: water, water, water, almond, almond, almond, (1:100 dilution, almond extract, Ostmann, Germany), banana, banana, banana (1:100 dilution, Uncle Roys natural banana essence, Scotland) pup urine, pup urine, pup urine (1:5 dilution), male/female urine, male/female urine, male/female urine (1:5 dilution). Pup urine was collected from four different wild‐type litters (18 female/male pups, at the age of 5–6 days). Urine was pooled and stored at −20°C upon usage. Additionally, female or male urine was collected from five (8–10 weeks old) females or males (C57BL/6), pooled and stored at −20°C upon usage. All nonsocial odors were presented after dipping the cotton swabs for 1–2 s in the prepared solutions. Behavior was recorded for a total period of 60 min. Videos were subsequently analyzed for cumulative time spent sniffing on the cotton swab (contact of the nose with the applicator (< 2 cm). The starting point of each odor presentation was when the lid was placed on top of the cage.
Spontaneous alternation in a symmetrical Y maze
To assess spatial working memory, Shank2 +/+ and Shank2 −/− mice were tested for spontaneous alternation behavior (SAB) in the Y maze (3 arms, 40 × 9 cm with 16 cm high walls). Mice were placed in a symmetrical Y maze for 5 min, which was located in a soundproof chamber, and the numbers of arm choices (all four paws entering one arm) were recorded. Overlapping triplets of visited arms (A, B, C) were calculated by recording the order of visited arms (A, B, or C). The SAB score was calculated using the following formula: (number of spontaneous alternation)/(total number of arm visits − 2). To avoid odor traces, between mice, the walls and bottom of the Y maze were carefully cleaned with 70% ethanol.
Novel Object recognition test
To evaluate spatial short‐term memory, Shank2 +/+ and Shank2 −/− mice were tested in the novel object recognition test in an open field arena (50 × 50 cm). The test was performed in three phases: habituation, acquisition, and retention. Mice were first habituated to the open field arena (without any object inside) for 30 min and placed back into the home cage for approximately 1–2 min. In the meantime, two identical copies of the same objects were placed in the two corners of the open field arena, approximately 4 cm from the sidewall. The mouse was placed back into the same arena facing the wall on the opposite side of the objects and allowed to explore the setting for 10 min freely. After this acquisition period, the mouse was placed back into the home cage. Following a 10‐min retention interval, the subject mouse was transferred back to the arena where a novel object replaced one of the identical objects. The mouse was allowed to explore the setting for 10 min. Recorded videos were scored manually with a stopwatch. Object exploration was defined as a clear nose contact with the object. To measure recognition memory, a preference index for the novel object was calculated as the ratio of the time spent exploring the novel object over the total time spent exploring both objects: (discrimination index [DI] = novel object exploration × 100/(novel object exploration + old object exploration).
Viral vectors and AAV production
Viruses pAAV‐hSyn‐DIO‐hM3D(Gq)‐mCherry (44361‐AAV2) and pENN.AAV.hSyn.HI.eGFP‐Cre.WPRE.SV40 (105540‐AAV9) were purchased from Addgene. Plasmids were purified by iodixanol gradient ultracentrifugation.
AAV vectors were injected with a titer of (1.5–3.3) × 1013 particles per ml. All viral vectors were stored in aliquots at −80°C until use.
Stereotaxic surgery
Mice were anesthetized with isoflurane (Iso‐Vet, La Zootecnica), and their heads were placed in a stereotaxic injection frame (two biological instruments). Under continuous anesthesia, skin scalp was incised to expose the underlying bone and a hand‐held micro drill was used to drill a hole in the opportune location. All skull measurements were made relative to Bregma. A total of 0.8 µl of pAAV‐hSyn‐DIO‐hM3D(Gq)‐mCherry (Addgene, 44361‐AAV2) and pENN.AAV.hSyn.HI.eGFP‐Cre.WPRE.SV40 (Addgene, 105540‐AAV9) in 1:1 ratio viral solution was delivered bilaterally into the MPOA using the following coordinates: bregma: 0.0 mm; anterior‐posterior: 0.26 mm; dorsal‐ventral: 4.60 mm; lateral: ±0.35 mm. Viral injection was carried out with an Hamilton syringe (needle gauge 26S) at a speed of 0.1 μl/min, and the needle was kept in place for an additional 5 min to prevent backflow of the virus. Scalp skin was stitched together with silk suture (two biological instruments, K890H). After surgery, mice were carefully transferred to single cages for 5 days with access to water and food ad libitum. Shank2 +/+ and Shank2 −/− naive female mice were allowed 4 weeks of recovery after surgery.
Behavioral experiments after DREADD
Four weeks after AVV injection, Shank2 +/+ and Shank2 −/− naive female mice were subjected to a pup exposure behavioral test (20 min per day) for five consecutive days. For the tests, they were injected intraperitoneally on each day with either vehicle (DMSO (Sigma‐Aldrich, D5879) + (2‐Hydroxypropyl)‐β‐cyclodextrin 20% (Sigma‐Aldrich, 332607), in 1:9 ratio solution) or Clozapine‐N‐oxide (CNO) (5 mg/kg of bodyweight in DMSO + (2‐Hydroxypropyl)‐β‐cyclodextrin 20%) 30 min before the beginning of pup exposure. After habituation to the behavior room (approximately 20 min), 1–3 postnatal‐day‐old non‐related C57BL/6J pups were introduced in each corner of the recipient female’s home cage that did not contain the nest. The pups were removed after a 20 min test session per day. Maternal behavior was analyzed at the final day of pup exposure (day 5). Maternal behavioral responses (retrieval, grooming, crouching, nest building, maternal interaction) were scored for 20 min as described in detail in section “retrieval experiments in postpartum females.” During the 5 days of behavioral testing, the home cage was not cleaned and nesting material was not removed to minimize disturbance of the female. Subject mice were single‐housed 2 days before the pup exposure test. After behavioral experiments, mice were transcardially perfused and the brain analyzed for the efficiency of viral infection.
Apomorphine injection
0.25 mg/kg apomorphine (Sigma‐Aldrich) was prepared in 0.5% Tween containing 0.02% ascorbic acid (Sato et al, 2010). Shank2 +/+ and Shank2 −/− received subcutaneous administration of 0.1 ml/10 g of mouse body weight or as vehicle the same volume (0.5% Tween, 0.02% ascorbic acid). The drug was administrated 15 min before maternal behavior observation began. Rescue experiments were performed in naive Shank2 +/+ and Shank2 −/− female mice. Pup exposure was repeated for five consecutive days before testing on day 5 as described above.
Statistics
Data are depicted as mean with the standard error of the mean (SEM). Normal distribution was determined by Shapiro–Wilk test. For normally distributed data, single comparisons were tested using independent Student’s t‐test. Nonparametric data were examined using the Mann–Whitney U‐test. Experiments with more than two groups were subjected to a one‐way ANOVA if normally distributed and compared using Bonferroni’s post hoc test. Multiple comparisons of nonparametric data were made by a Kruskal–Wallis analysis followed by Dunn’s post hoc test.
Experiments with two between factors (treatment, genotype) were analyzed using a two‐way ANOVA, to determine genotype and treatment effect or interaction between both factors. Experiments with one “between‐subjects” factor (genotype) and one “within‐subjects” factor (trial) were analyzed using a two‐way mixed ANOVA. Statistical analysis was performed with SPSS version 22. Statistical tests were two‐tailed with a significance level of α ≤ 0.05. Statistically significant differences are indicated in the figures by *P ≤ 0.05, **P ≤ 0.01, and ***P ≤ 0.001.
Author contributions
TMB, SG, GE, and BH designed the outline of the study. SG, JP, JS, CU‐R, and KT carried out the experiments and wrote the manuscript together with CV, CS, RZ, SG, and JS performed data analyses. AMG, MS, JB, and GE critically revised the experiments. All authors read, edited, and approved the final version.
Conflict of interest
The authors declare that they have no conflict of interest.
Supporting information
Appendix
Expanded View Figures PDF
Review Process File
Acknowledgements
TMB has received funding from the Innovative Medicines Initiative 2 Joint Undertaking under grant agreement No 777394 for the project AIMS‐2‐TRIALS. This Joint Undertaking receives support from the European Union's Horizon 2020 research and innovation program and EFPIA and AUTISM SPEAKS, Autistica, SFARI. TMB is further supported by the DFG (Project‐ID 251293561—Collaborative Research Center (CRC) 1149), the Else Kröner‐Fresenius Stiftung and the DZNE, Ulm site. TMB and BH hold a common grant from the BIU2 (Boehringer—Ulm University cooperation). CV is supported by Comitato Telethon Fondazione Onlus; contract grant number: GGP16131. We thank Susanne Gerlach‐Arbeiter, Katharina Mangus and Natalie Damm for the excellent technical assistance. Open Access funding enabled and organized by ProjektDEAL
The EMBO Journal (2021) 40: e104267.
Data availability
This study includes no data deposition in external repositories.
References
- Barak B, Feng G (2016) Neurobiology of social behavior abnormalities in autism and Williams syndrome. Nat Neurosci 19: 647–655 [DOI] [PMC free article] [PubMed] [Google Scholar]
- Bauminger N, Shulman C, Agam G (2003) Peer interaction and loneliness in high‐functioning children with autism. J Autism Dev Disord 33: 489–507 [DOI] [PubMed] [Google Scholar]
- Berkel S, Marshall CR, Weiss B, Howe J, Roeth R, Moog U, Endris V, Roberts W, Szatmari P, Pinto D et al (2010) Mutations in the SHANK2 synaptic scaffolding gene in autism spectrum disorder and mental retardation. Nat Genet 42: 489–491 [DOI] [PubMed] [Google Scholar]
- Berkel S, Tang W, Treviño M, Vogt M, Obenhaus HA, Gass P, Scherer SW, Sprengel R, Schratt G, Rappold GA (2012) Inherited and de novo SHANK2 variants associated with autism spectrum disorder impair neuronal morphogenesis and physiology. Hum Mol Genet 21: 344–357 [DOI] [PMC free article] [PubMed] [Google Scholar]
- Boeckers TM, Bockmann J, Kreutz MR, Gundelfinger ED (2002) ProSAP/Shank proteins – a family of higher order organizing molecules of the postsynaptic density with an emerging role in human neurological disease. J Neurochem 81: 903–910 [DOI] [PubMed] [Google Scholar]
- Boeckers TM, Liedtke T, Spilker C, Dresbach T, Bockmann J, Kreutz MR, Gundelfinger ED (2005) C‐terminal synaptic targeting elements for postsynaptic density proteins ProSAP1/Shank2 and ProSAP2/Shank3. J Neurochem 92: 519–524 [DOI] [PubMed] [Google Scholar]
- Bridges RS, Numan M, Ronsheim PM, Mann PE, Lupini CE (1990) Central prolactin infusions stimulate maternal behavior in steroid‐treated, nulliparous female rats. Proc Natl Acad Sci USA 87: 8003–8007 [DOI] [PMC free article] [PubMed] [Google Scholar]
- Broad KD, Curley JP, Keverne EB (2006) Mother‐infant bonding and the evolution of mammalian social relationships. Philos Trans R Soc Lond B Biol Sci 361: 2199–2214 [DOI] [PMC free article] [PubMed] [Google Scholar]
- Brown JR, Ye H, Bronson RT, Dikkes P, Greenberg ME (1996) A defect in nurturing in mice lacking the immediate early gene fosB. Cell 86: 297–309 [DOI] [PubMed] [Google Scholar]
- Burke AR, McCormick CM, Pellis SM, Lukkes JL (2017) Impact of adolescent social experiences on behavior and neural circuits implicated in mental illnesses. Neurosci Biobehav Rev 76: 280–300 [DOI] [PubMed] [Google Scholar]
- Calamandrei G, Keverne EB (1994) Differential expression of Fos protein in the brain of female mice dependent on pup sensory cues and maternal experience. Behav Neurosci 108: 113–120 [DOI] [PubMed] [Google Scholar]
- Carter CS (1998) Neuroendocrine perspectives on social attachment and love. Psychoneuroendocrinology 23: 779–818 [DOI] [PubMed] [Google Scholar]
- Caumes R, Smol T, Thuillier C, Balerdi M, Lestienne‐Roche C, Manouvrier‐Hanu S, Ghoumid J (2020) Phenotypic spectrum of SHANK2‐related neurodevelopmental disorder. Eur J Med Genet 63: 104072 [DOI] [PubMed] [Google Scholar]
- Chilian B, Abdollahpour H, Bierhals T, Haltrich I, Fekete G, Nagel I, Rosenberger G, Kutsche K (2013) Dysfunction of SHANK2 and CHRNA7 in a patient with intellectual disability and language impairment supports genetic epistasis of the two loci. Clin Genet 84: 560–565 [DOI] [PubMed] [Google Scholar]
- Costas J (2015) The role of SHANK2 rare variants in schizophrenia susceptibility. Mol Psychiatry 20: 1486 [DOI] [PubMed] [Google Scholar]
- Cservenák M, Kis V, Keller D, Dimén D, Menyhárt L, Oláh S, Szabó ÉR, Barna J, Renner É, Usdin TB et al (2017) Maternally involved galanin neurons in the preoptic area of the rat. Brain Struct Funct 222: 781–798 [DOI] [PMC free article] [PubMed] [Google Scholar]
- Distler U, Schmeisser MJ, Pelosi A, Reim D, Kuharev J, Weiczner R, Baumgart J, Boeckers TM, Nitsch R, Vogt J et al (2014) In‐depth protein profiling of the postsynaptic density from mouse hippocampus using data‐independent acquisition proteomics. Proteomics 14: 2607–2613 [DOI] [PubMed] [Google Scholar]
- Dölen G (2015) Autism: oxytocin, serotonin, and social reward. Soc Neurosci 10: 450–465 [DOI] [PubMed] [Google Scholar]
- Ehret G, Koch M (1989) Ultrasound‐induced parental behavior in house mice is controlled by female sex hormones and parental experience. Ethology 80: 81–93 [Google Scholar]
- Ehret G, Buckenmaier J (1994) Estrogen‐receptor occurrence in female mouse brain: effects of maternal experience, ovariectomy, estrogen and anosmia. J Physiol Paris 88: 315–329 [DOI] [PubMed] [Google Scholar]
- Eltokhi A, Rappold G, Sprengel R (2018) Distinct phenotypes of Shank2 mouse models reflect neuropsychiatric spectrum disorders of human patients with SHANK2 variants. Front Mol Neurosci 11: 240 [DOI] [PMC free article] [PubMed] [Google Scholar]
- Ey E, Torquet N, de Chaumont F, Lévi‐Strauss J, Ferhat AT, Le Sourd AM, Boeckers TM, Bourgeron T (2018) Shank2Mutant mice display hyperactivity insensitive to methylphenidate and reduced flexibility in social motivation, but normal social recognition. Front Mol Neurosci 11: 365 [DOI] [PMC free article] [PubMed] [Google Scholar]
- Fang YY, Yamaguchi T, Song SC, Tritsch NX, Lin D (2018) A hypothalamic midbrain pathway essential for driving maternal behaviors. Neuron 98: 192–207 [DOI] [PMC free article] [PubMed] [Google Scholar]
- Fleming AS, Suh EJ, Korsmit M, Rusak B (1994) Activation of Fos‐like immunoreactivity in the medial preoptic area and limbic structures by maternal and social interaction in rats. Behav Neurosci 108: 724–734 [DOI] [PubMed] [Google Scholar]
- Gallitto E, Leth‐Steensen C (2015) Autistic traits and adult attachment styles. Personality Individ Differ 79: 63–67 [Google Scholar]
- Gandelman R, Zarrow MX, Denenberg VH (1972) Reproductive and maternal performance in the mouse following removal of the olfactory bulbs. J Reprod Fertil 28: 453–456 [DOI] [PubMed] [Google Scholar]
- Geissler DB, Sabine Schmidt H, Ehret G (2013) Limbic brain activation for maternal acoustic perception and responding is different in mothers and virgin female mice. J Physiol Paris 107: 62–71 [DOI] [PubMed] [Google Scholar]
- Grabrucker AM, Schmeisser MJ, Schoen M, Boeckers TM (2011) Postsynaptic ProSAP/Shank scaffolds in the cross‐hair of synaptopathies. Trends Cell Biol 21: 594–603 [DOI] [PubMed] [Google Scholar]
- Grabrucker S, Jannetti L, Eckert M, Gaub S, Chhabra R, Pfaender S, Mangus K, Reddy PP, Rankovic V, Schmeisser MJ et al (2014) Zinc deficiency dysregulates the synaptic ProSAP/Shank scaffold and might contribute to autism spectrum disorders. Brain 137: 137–152 [DOI] [PubMed] [Google Scholar]
- Guilmatre A, Huguet G, Delorme R, Bourgeron T (2014) The emerging role of SHANK genes in neuropsychiatric disorders. Dev Neurobiol 74: 113–122 [DOI] [PubMed] [Google Scholar]
- Hadjikhani N, Joseph RM, Snyder J, Tager‐Flusberg H (2007) Abnormal activation of the social brain during face perception in autism. Hum Brain Mapp 28: 441–449 [DOI] [PMC free article] [PubMed] [Google Scholar]
- von dem Hagen EA, Stoyanova RS, Baron‐Cohen S, Calder AJ (2013) Reduced functional connectivity within and between 'social' resting state networks in autism spectrum conditions. Soc Cogn Affect Neurosci 8: 694–701 [DOI] [PMC free article] [PubMed] [Google Scholar]
- Homann OR, Misura K, Lamas E, Sandrock RW, Nelson P, McDonough SI, DeLisi LE (2016) Whole‐genome sequencing in multiplex families with psychoses reveals mutations in the SHANK2 and SMARCA1 genes segregating with illness. Mol Psychiatry 21: 1690–1695 [DOI] [PMC free article] [PubMed] [Google Scholar]
- van Ijzendoorn MH, Rutgers AH, Bakermans‐Kranenburg MJ, Swinkels SH, van Daalen E, Dietz C, Naber FB, Buitelaar JK, van Engeland H (2007) Parental sensitivity and attachment in children with autism spectrum disorder: comparison with children with mental retardation, with language delays, and with typical development. Child Dev 78: 597–608 [DOI] [PubMed] [Google Scholar]
- Insel TR (1997) A neurobiological basis of social attachment. Am J Psychiatry 154: 726–735 [DOI] [PubMed] [Google Scholar]
- Insel TR (2003) Is social attachment an addictive disorder? Physiol Behav 79: 351–357 [DOI] [PubMed] [Google Scholar]
- Johnson ZV, Young LJ (2015) Neurobiological mechanisms of social attachment and pair bonding. Curr Opin Behav Sci 3: 38–44 [DOI] [PMC free article] [PubMed] [Google Scholar]
- Kahane L, El‐Tahir M (2015) Attachment behavior in children with autistic spectrum disorders. Adv Ment Health Intellect Disabil 9: 79–89 [Google Scholar]
- Kanner L (1968) Autistic disturbances of affective contact. Acta Paedopsychiatr 35: 100–136 [PubMed] [Google Scholar]
- Kim R, Kim J, Chung C, Ha S, Lee S, Lee E, Yoo YE, Kim W, Shin W, Kim E (2018) Cell‐type‐specific Shank2 deletion in mice leads to differential synaptic and behavioral phenotypes. J Neurosci 38: 4076–4092 [DOI] [PMC free article] [PubMed] [Google Scholar]
- Kohl J, Autry AE, Dulac C (2017) The neurobiology of parenting: a neural circuit perspective. BioEssays 39: 1–11 [DOI] [PMC free article] [PubMed] [Google Scholar]
- Kohl J, Babayan BM, Rubinstein ND, Autry AE, Marin‐Rodriguez B, Kapoor V, Miyamishi K, Zweifel LS, Luo L, Uchida N et al (2018) Functional circuit architecture underlying parental behaviour. Nature 556: 326–331 [DOI] [PMC free article] [PubMed] [Google Scholar]
- Kohls G, Schulte‐Rüther M, Nehrkorn B, Müller K, Fink GR, Kamp‐Becker I, Herpertz‐Dahlmann B, Schultz RT, Konrad K (2013) Reward system dysfunction in autism spectrum disorders. Soc Cogn Affect Neurosci 8: 565–572 [DOI] [PMC free article] [PubMed] [Google Scholar]
- Kron M, Howell CJ, Adams IT, Ransbottom M, Christian D, Ogier M, Katz DM (2012) Brain activity mapping in Mecp2 mutant mice reveals functional deficits in forebrain circuits, including key nodes in the default mode network, that are reversed with ketamine treatment. J Neurosci 32: 13860–13872 [DOI] [PMC free article] [PubMed] [Google Scholar]
- Lamport D, Turner LA (2014) Romantic attachment, empathy, and the broader autism phenotype among college students. J Genet Psychol 175: 202–213 [DOI] [PubMed] [Google Scholar]
- Leblond CS, Heinrich J, Delorme R, Proepper C, Betancur C, Huguet G, Konyukh M, Chaste P, Ey E, Rastam M et al (2012) Genetic and functional analyses of SHANK2 mutations suggest a multiple hit model of autism spectrum disorders. PLoS Genet 8: e1002521 [DOI] [PMC free article] [PubMed] [Google Scholar]
- Leblond CS, Nava C, Polge A, Gauthier J, Huguet G, Lumbroso S, Giuliano F, Stordeur C, Depienne C, Mouzat K et al (2014) Meta‐analysis of SHANK mutations in autism spectrum disorders: a gradient of severity in cognitive impairments. PLoS Genet 10: e1004580 [DOI] [PMC free article] [PubMed] [Google Scholar]
- Lee S, Lee E, Kim R, Kim J, Lee S, Park H, Yang E, Kim H, Kim E (2018) Shank2 deletion in parvalbumin neurons leads to moderate hyperactivity, enhanced self‐grooming and suppressed seizure susceptibility in mice. Front Mol Neurosci 11: 209 [DOI] [PMC free article] [PubMed] [Google Scholar]
- Lieberwirth C, Wang Z (2014) Social bonding: regulation by neuropeptides. Front Neurosci 8: 171 [DOI] [PMC free article] [PubMed] [Google Scholar]
- Lim S, Naisbitt S, Yoon J, Hwang JI, Suh PG, Sheng M, Kim E (1999) Characterization of the Shank family of synaptic proteins. Multiple genes, alternative splicing, and differential expression in brain and development. J Biol Chem 274: 29510–29518 [DOI] [PubMed] [Google Scholar]
- Lloyd‐Fox S, Blasi A, Elwell CE, Charman T, Murphy D, Johnson MH (2013) Reduced neural sensitivity to social stimuli in infants at risk for autism. Proc Biol Sci 280: 20123026 [DOI] [PMC free article] [PubMed] [Google Scholar]
- Matsushita N, Muroi Y, Kinoshita K, Ishii T (2015) Comparison of c‐Fos expression in brain regions involved in maternal behavior of virgin and lactating female mice. Neurosci Lett 590: 166–171 [DOI] [PubMed] [Google Scholar]
- McHenry JA, Otis JM, Rossi MA, Robinson JE, Kosyk O, Miller NW, McElligott ZA, Budygin EA, Rubinow DR, Stuber GD (2017) Hormonal gain control of a medial preoptic area social reward circuit. Nat Neurosci 20: 449–458 [DOI] [PMC free article] [PubMed] [Google Scholar]
- Modahl C, Green L, Fein D, Morris M, Waterhouse L, Feinstein C, Levin H (1998) Plasma oxytocin levels in autistic children. Biol Psychiatry 43: 270–277 [DOI] [PubMed] [Google Scholar]
- Mogi K, Nagasawa M, Kikusui T (2011) Developmental consequences and biological significance of mother‐infant bonding. Prog Neuropsychopharmacol Biol Psychiatry 35: 1232–1241 [DOI] [PubMed] [Google Scholar]
- Naisbitt S, Kim E, Tu JC, Xiao B, Sala C, Valtschanoff J, Weinberg RJ, Worley PF, Sheng M (1999) Shank, a novel family of postsynaptic density proteins that binds to the NMDA receptor/PSD‐95/GKAP complex and cortactin. Neuron 23: 569–582 [DOI] [PubMed] [Google Scholar]
- Neuhaus E, Beauchaine TP, Bernier R (2010) Neurobiological correlates of social functioning in autism. Clin Psychol Rev 30: 733–748 [DOI] [PubMed] [Google Scholar]
- Numan M, Insel TR (2003) The neurobiology of parental behavior. New York, NY: Springer; [Google Scholar]
- Numan M (2007) Motivational systems and the neural circuitry of maternal behavior in the rat. Dev Psychobiol 49: 12–21 [DOI] [PubMed] [Google Scholar]
- Numan M, Young LJ (2016) Neural mechanisms of mother‐infant bonding and pair bonding: Similarities, differences, and broader implications. Horm Behav 77: 98–112 [DOI] [PMC free article] [PubMed] [Google Scholar]
- Pappas AL, Bey AL, Wang X, Rossi M, Kim YH, Yan H, Porkka F, Duffney LJ, Phillips SM, Cao X et al (2017) Deficiency of Shank2 causes mania‐like behavior that responds to mood stabilizers. JCI Insight 2: 92052 [DOI] [PMC free article] [PubMed] [Google Scholar]
- Paxinos G, Franklin DBJ (2004) The mouse brain in stereotaxic coordinates, San Diego, CA: Elsevier Science; [Google Scholar]
- Peykov S, Berkel S, Degenhardt F, Rietschel M, Nöthen MM, Rappold GA (2015a) Rare SHANK2 variants in schizophrenia. Mol Psychiatry 20: 1487–1488 [DOI] [PMC free article] [PubMed] [Google Scholar]
- Peykov S, Berkel S, Schoen M, Weiss K, Degenhardt F, Strohmaier J, Weiss B, Proepper C, Schratt G, Nöthen MM et al (2015b) Identification and functional characterization of rare SHANK2 variants in schizophrenia. Mol Psychiatry 20: 1489–1498 [DOI] [PMC free article] [PubMed] [Google Scholar]
- Pinkham AE, Hopfinger JB, Pelphrey KA, Piven J, Penn DL (2008) Neural bases for impaired social cognition in schizophrenia and autism spectrum disorders. Schizophr Res 99: 164–175 [DOI] [PMC free article] [PubMed] [Google Scholar]
- Pinto D, Pagnamenta AT, Klei L, Anney R, Merico D, Regan R, Conroy J, Magalhaes TR, Correia C, Abrahams BS et al (2010) Functional impact of global rare copy number variation in autism spectrum disorders. Nature 466: 368–372 [DOI] [PMC free article] [PubMed] [Google Scholar]
- Plante I, Stewart MK, Laird DW (2011) Evaluation of mammary gland development and function in mouse models. J Vis Exp 21: 2828 [DOI] [PMC free article] [PubMed] [Google Scholar]
- Prasad A, Merico D, Thiruvahindrapuram B, Wei J, Lionel AC, Sato D, Rickaby J, Lu C, Szatmari P, Roberts W et al (2012) A discovery resource of rare copy number variations in individuals with autism spectrum disorder. G3: Genes ‐ Genomes ‐ Genetics 2: 1665–1685 [DOI] [PMC free article] [PubMed] [Google Scholar]
- Rauch A, Wieczorek D, Graf E, Wieland T, Endele S, Schwarzmayr T, Albrecht B, Bartholdi D, Beygo J, Di Donato N et al (2012) Range of genetic mutations associated with severe non‐syndromic sporadic intellectual disability: an exome sequencing study. Lancet 380: 1674–1682 [DOI] [PubMed] [Google Scholar]
- Rilling JK, Young LJ (2014) The biology of mammalian parenting and its effect on offspring social development. Science 345: 771–776 [DOI] [PMC free article] [PubMed] [Google Scholar]
- Rosenblatt JS (1967) Nonhormonal basis of maternal behavior in the rat. Science 156: 1512–1514 [DOI] [PubMed] [Google Scholar]
- Rutgers AH, Bakermans‐Kranenburg MJ, van Ijzendoorn MH, van Berckelaer‐Onnes IA (2004) Autism and attachment: a meta‐analytic review. J Child Psychol Psychiatry 45: 1123–1134 [DOI] [PubMed] [Google Scholar]
- Rutgers AH, van Ijzendoorn MH, Bakermans‐Kranenburg MJ, Swinkels SH, van Daalen E, Dietz C, Naber FB, Buitelaar JK, van Engeland H (2007) Autism, attachment and parenting: a comparison of children with autism spectrum disorder, mental retardation, language disorder, and non‐clinical children. J Abnorm Child Psychol 35: 859–870 [DOI] [PubMed] [Google Scholar]
- Sala C, Vicidomini C, Bigi I, Mossa A, Verpelli C (2015) Shank synaptic scaffold proteins: keys to understanding the pathogenesis of autism and other synaptic disorders. J Neurochem 135: 849–858 [DOI] [PubMed] [Google Scholar]
- Sanders SJ, Murtha MT, Gupta AR, Murdoch JD, Raubeson MJ, Willsey AJ, Ercan‐Sencicek AG, DiLullo NM, Parikshak NN, Stein JL et al (2012) De novo mutations revealed by whole‐exome sequencing are strongly associated with autism. Nature 485: 237–241 [DOI] [PMC free article] [PubMed] [Google Scholar]
- Sato A, Nakagawasai O, Tan‐No K, Onogi H, Niijima F, Tadano T (2010) Effect of non‐selective dopaminergic receptor agonist on disrupted maternal behavior in olfactory bulbectomized mice. Behav Brain Res 210: 251–256 [DOI] [PubMed] [Google Scholar]
- Sato W, Toichi M, Uono S, Kochiyama T (2012) Impaired social brain network for processing dynamic facial expressions in autism spectrum disorders. BMC Neurosci 13: 99 [DOI] [PMC free article] [PubMed] [Google Scholar]
- Schluth‐Bolard C, Labalme A, Cordier MP, Till M, Nadeau G, Tevissen H, Lesca G, Boutry‐Kryza N, Rossignol S, Rocas D et al (2013) Breakpoint mapping by next generation sequencing reveals causative gene disruption in patients carrying apparently balanced chromosome rearrangements with intellectual deficiency and/or congenital malformations. J Med Genet 50: 144–150 [DOI] [PubMed] [Google Scholar]
- Schmeisser MJ, Ey E, Wegener S, Bockmann J, Stempel AV, Kuebler A, Janssen AL, Udvardi PT, Shiban E, Spilker C et al (2012) Autistic‐like behaviours and hyperactivity in mice lacking ProSAP1/Shank2. Nature 486: 256–260 [DOI] [PubMed] [Google Scholar]
- Scott‐Van Zeeland AA, Dapretto M, Ghahremani DG, Poldrack RA, Bookheimer SY (2010) Reward processing in autism. Autism Res 3: 53–67 [DOI] [PMC free article] [PubMed] [Google Scholar]
- Stack EC, Numan M (2000) The temporal course of expression of c‐Fos and Fos B within the medial preoptic area and other brain regions of postpartum female rats during prolonged mother–young interactions. Behav Neurosci 114: 609–622 [DOI] [PubMed] [Google Scholar]
- Stroobants S, Creemers J, Bosmans G, D'Hooge R (2020) Post‐weaning infant‐to‐mother bonding in nutritionally independent female mice. PLoS One 15: e0227034 [DOI] [PMC free article] [PubMed] [Google Scholar]
- Taylor EL, Target M, Charman T (2008) Attachment in adults with high‐functioning autism. Attach Hum Dev 10: 143–163 [DOI] [PubMed] [Google Scholar]
- Vivanti G, Nuske HJ (2017) Autism, attachment, and social learning: three challenges and a way forward. Behav Brain Res 325: 251–259 [DOI] [PubMed] [Google Scholar]
- Wischmeijer A, Magini P, Giorda R, Gnoli M, Ciccone R, Cecconi L, Franzoni E, Mazzanti L, Romeo G, Zuffardi O et al (2011) Olfactory receptor‐related duplicons mediate a microdeletion at 11q13.2q13.4 associated with a syndromic phenotype. Mol Syndromol 1: 176–184 [DOI] [PMC free article] [PubMed] [Google Scholar]
- Won H, Lee HR, Gee HY, Mah W, Kim JI, Lee J, Ha S, Chung C, Jung ES, Cho YS et al (2012) Autistic‐like social behaviour in Shank2‐mutant mice improved by restoring NMDA receptor function. Nature 486: 261–265 [DOI] [PubMed] [Google Scholar]
- Wu Z, Autry AE, Bergan JF, Watabe‐Uchida M, Dulac CG (2014) Galanin neurons in the medial preoptic area govern parental behaviour. Nature 509: 325–330 [DOI] [PMC free article] [PubMed] [Google Scholar]
- Yang M, Crawley JN (2009) Simple behavioral assessment of mouse olfaction. Curr Protoc Neurosci Chapter 8: Unit 8.24 [DOI] [PMC free article] [PubMed] [Google Scholar]
Associated Data
This section collects any data citations, data availability statements, or supplementary materials included in this article.
Supplementary Materials
Appendix
Expanded View Figures PDF
Review Process File
Data Availability Statement
This study includes no data deposition in external repositories.