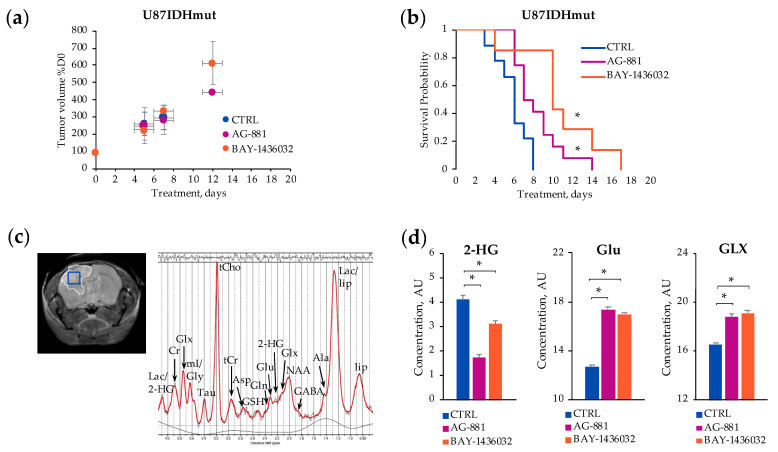
Figure 2.
Temporal evolution of average U87IDHmut tumor volume as a percentage of D0 (a). Kaplan–Meier survival plot of U87IDHmut-bearing mice (* p-value ≤ 0.05) (b). A representative axial T2-weighted image of control U87IDHmut-bearing mouse and corresponding in vivo 1H-MRS spectrum acquired from the voxel marked in blue on the image (c). Quantification of 2-HG, Glu and GLX concentrations acquired from the voxel placed in control, AG-881- and BAY-1436032-treated tumors at D5 ± 1 (* p-value < 0.003) (d).

