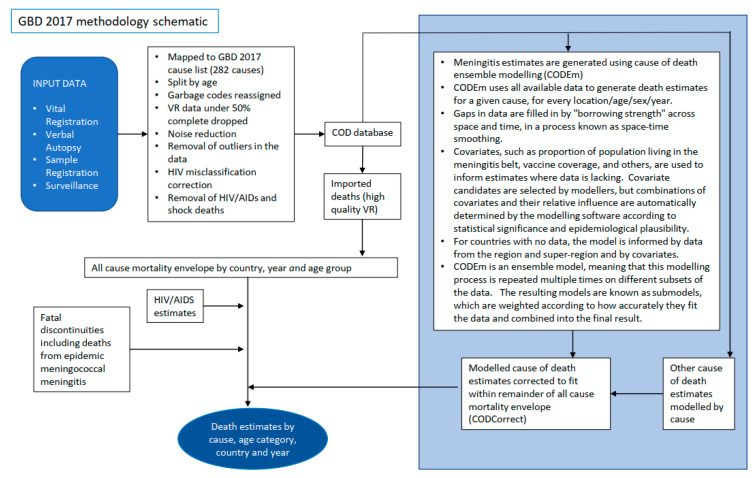
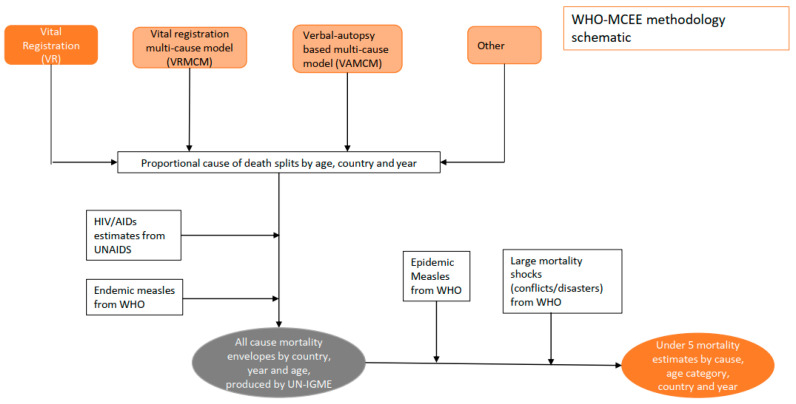
Figure 4.
Simplified schematic of the different mortality modelling approaches. VR Data—Data from 76 countries with high quality VR data covering >80% of the population was mapped directly to cause of death categories (see appendix for ICD10 codes mapped to meningitis and sepsis and other severe infections in the neonatal period). VRMCM—Data from the countries with high quality VR data was used to fit a multinomial logistic regression model which was used to predict cause of death proportions in 38 low mortality countries (<35 deaths/1000 live births 2000–2010) with low quality VR data. Covariates used in the model are provided in appendix. VAMCM—In 78 high mortality countries (>35 deaths/1000 live births 2000–2010) verbal autopsy data from 119 research studies in 39 high mortality countries was used to fit a multinomial model to predict causes of death. Cause of death proportions for India were estimated using a combination of VAMCM for the neonatal period and data from the million deaths study and INDEPTH sites in India for the post neonatal period. See appendix for model covariates Other – Cause of death proportions for China were estimated using data from the China Maternal and Child Health Surveillance system. A complete explanation of methods used to produce WHO/MCEE estimates is outlined elsewhere [27].


