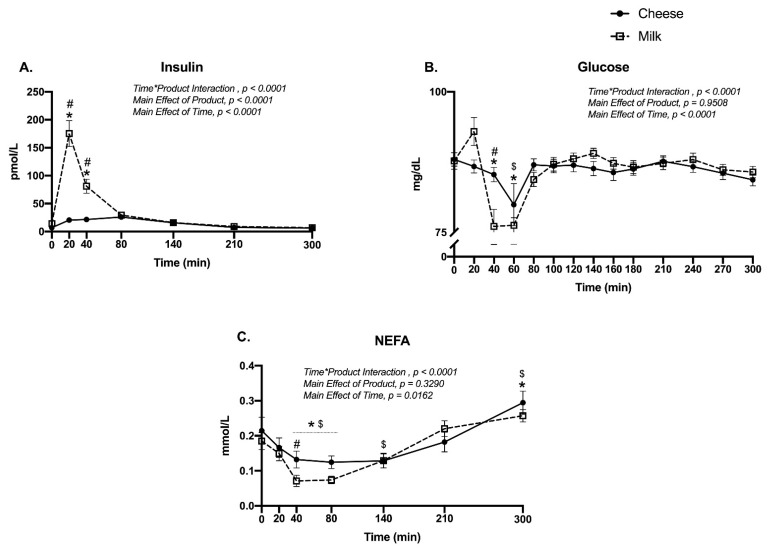
Figure 2.
Plasma (A) insulin (pmol/L), (B) glucose (mg/dL), and (C) non-esterified fatty acids (mmol/L) in the fasted state (0 min) and over a 300 min time period following the ingestion of either cheese (solid line) or milk (dotted line) in men and women (n = 24). Different from baseline (0 min) for milk (*) and cheese ($), p < 0.05. #, Different between groups at the specific time point, p < 0.05.

