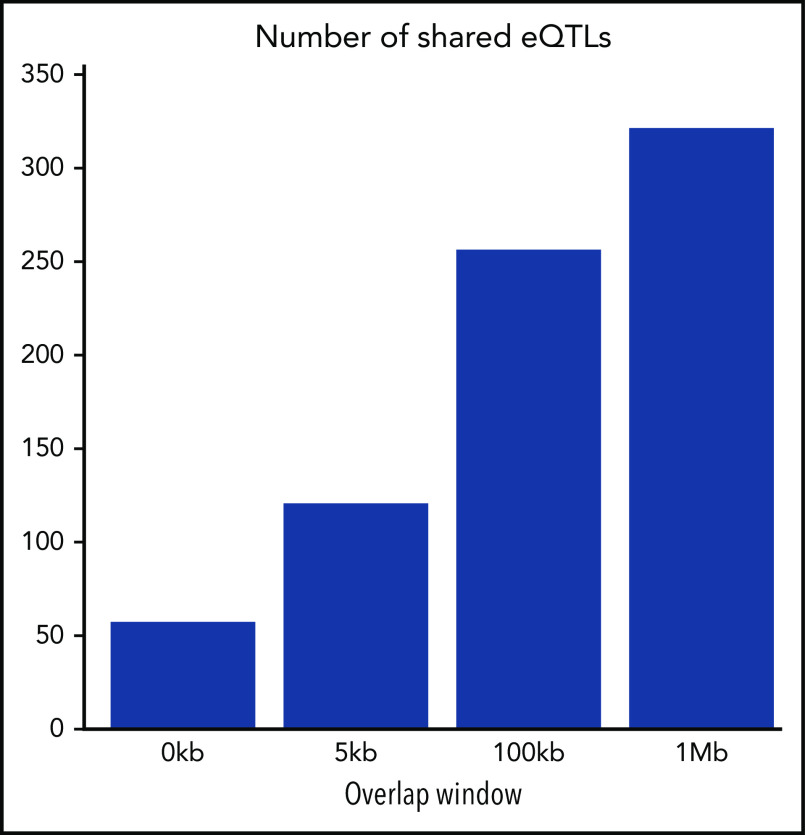
Figure 3.
Number of shared eQTLs in MKs and platelets. Barplots represent the number of shared eQTLs in MKs and platelets for direct matches (0 kb) as well as 5-kb, 100-kb, and 1-Mb replication windows. There is greater overlap with the distance-based approach compared with the direct overlap in discovery signal. The overlap is higher when allowing for a larger overlap window.

