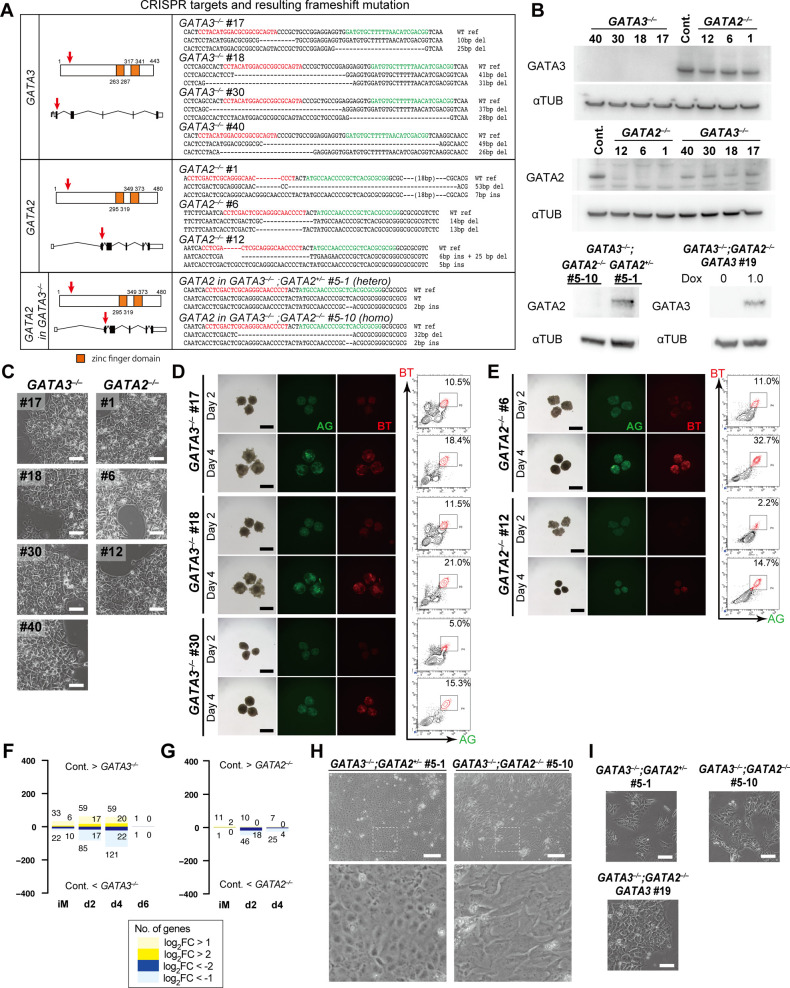
Figure S4. Dose-dependent function of GATA transcription factors in human primordial germ-cell-like cell specification.
(A) The CRISPR targets (left) and resulting mutations (right) for GATA3 (top), GATA2 (middle), and GATA2 in the GATA3−/− #40 clone (bottom). The same gRNA was used to create GATA2 mutants. (left) The amino acid sequences and the genomic structures (the exons: black boxes; introns: folded lines; un-translated regions: white boxes) of GATA3 and GATA2 are indicated, with the position of zinc finger DNA binding domain (orange) and the CRISPR target sites (red arrows). (right) The DNA sequences of both alleles for the indicated knockout lines are shown. Red and green letters indicate the positions of the gRNAs including the PAM sequences. del, deletion; ins, insertion. (B) Western blot analysis of GATA3 and GATA2 expression in TE-like cells induced from the GATA3−/−, GATA2−/−, GATA3−/−:GATA2+/−, and GATA3−/−:GATA2−/− clones, and in the GATA3−/−:GATA2−/−: GATA3 (rescued) clones cultured with or without 1.0 μg/ml of Dox for 24 h. α-TUBULIN was used as a loading control. (C) Phase-contrast images of iMeLCs in the designated clones. No apparent morphological differences were seen among the clones. Representative images of four (GATA3−/−) and two (GATA2−/−) independent experiments are shown. Bars, 50 μm. (D, E) Bright-field and fluorescence (AG/BT) images, and FACS analyses for BTAG expression in d2/d4 floating aggregates of the GATA3−/−#17, #18, #30 (D) or GATA2−/− #6, #12 (E) clones induced by bone morphogenetic protein 4. Representative images of four (D) and two (E) independent experiments are shown. Bars, 200 μm. (F, G) The numbers of differentially expressed genes between the parental and GATA3−/− (E) or GATA2−/− (F) clones in iMeLCs (iM), d2/d4/d6 BT+AG+ cells (P < 0.01 by Tukey–Kramer test, log2[RPM + 1] > 4 in cells with higher expression, log2[fold change: FC] > 1 [up, pale yellow; down, pale blue] or 2 [up, yellow; down, blue]). (H) Phase-contrast images of the TE-like cells induced from the designated clones. The GATA3−/−:GATA2+/− #5-1 clone exhibited a cobblestone-like epithelial morphology similar to TE, whereas the GATA3−/−:GATA2−/− #5-10 clone failed to show TE-like differentiation and exhibited a mesenchymal morphology. Bars, 200 μm. (I) Phase-contrast images of iMeLCs in the designated clones. No apparent morphological differences were seen among the clones. Representative images of at least two independent experiments are shown (indicated in Fig 5F). Bars, 50 μm.
Source data are available for this figure.

