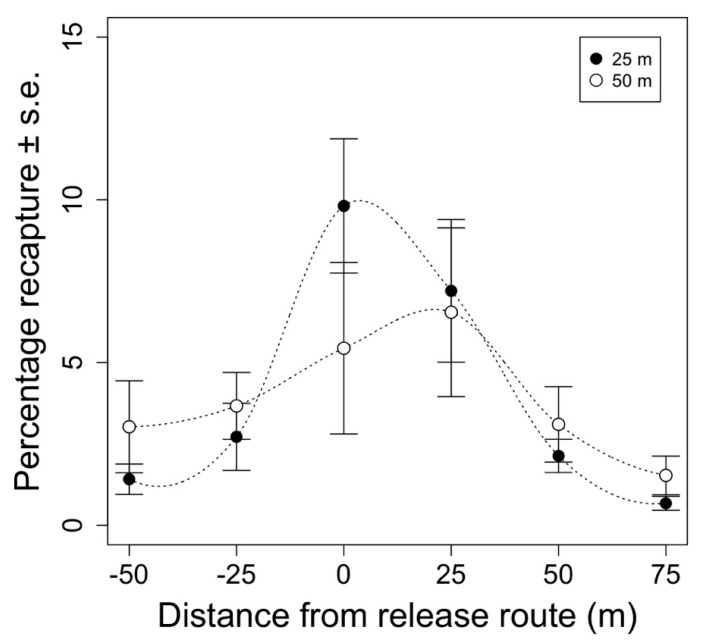
Figure 3.
Mean percentage of recaptured moths vs. distance from the aerial release route (m). Each distance from the release route represents the sum of 11 traps in the grid at the specified distance from the release route for each replicate. Points represent week-long total recaptures averaged across replicates ±1 standard error for each distance (n = 6). Black and white points represent recaptures of moths that were release from 25 or 50 m above ground, respectively.

