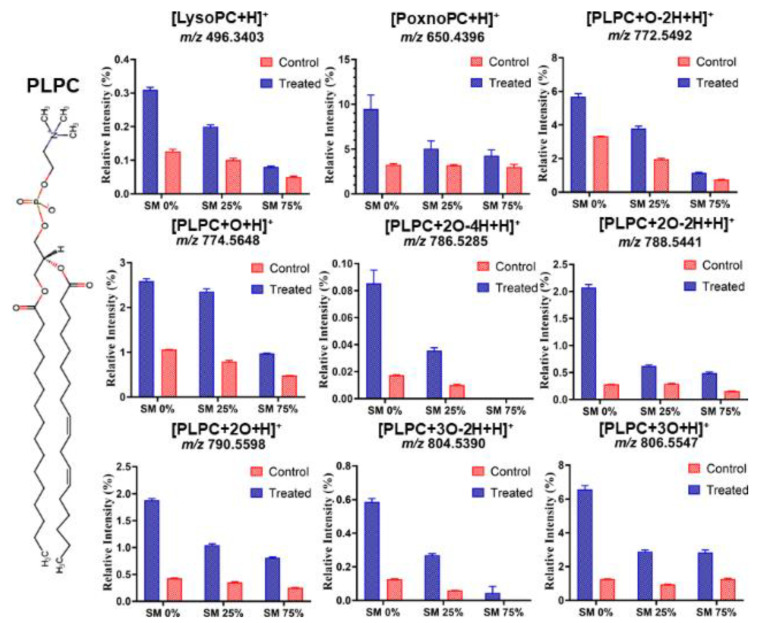
Figure 3.
The relative intensity for different PLPC oxidation products obtained from lipid bilayers with different SM fraction after 30 min plasma treatment (Treated) and after auto-oxidation (Control) (n = 3). Data were obtained by HR-mass spectroscopy. The relative intensity of each lipid peroxidation product (LPP) is calculated as the peak area of LPP divided by the peak area of unmodified PLPC in the same sample. Note that the different graphs have different scaling of the y-axis. 1-Palmitoyl-2-hydroxy-sn-glycero-3-phosphocholine and 1-palmitoyl-2-(9′-oxo-nonanoyl)-sn-glycero-3-phosphocholine were presented as LysoPC and PoxnoPC, respectively.

