Abstract
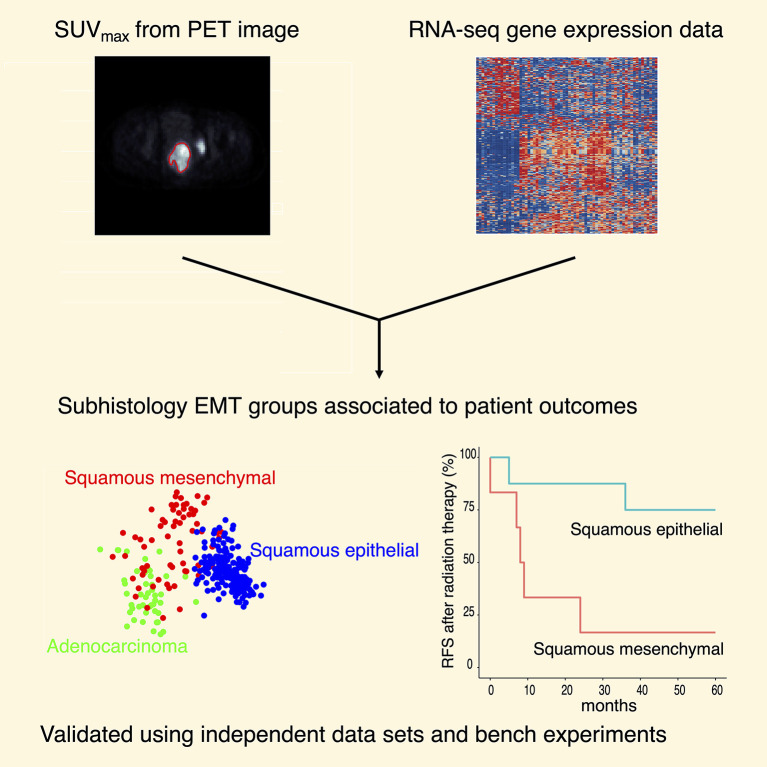
Approaches using a single type of data have been applied to classify human tumors. Here we integrate imaging features and transcriptomic data using a prospectively collected tumor bank. We demonstrate that increased maximum standardized uptake value on pretreatment 18F-fluorodeoxyglucose–positron emission tomography correlates with epithelial-to-mesenchymal transition (EMT) gene expression. We derived and validated 3 major molecular groups, namely squamous epithelial, squamous mesenchymal, and adenocarcinoma, using prospectively collected institutional (n = 67) and publicly available (n = 304) data sets. Patients with tumors of the squamous mesenchymal subtype showed inferior survival outcomes compared with the other 2 molecular groups. High mesenchymal gene expression in cervical cancer cells positively correlated with the capacity to form spheroids and with resistance to radiation. CaSki organoids were radiation-resistant but sensitive to the glycolysis inhibitor, 2-DG. These experiments provide a strategy for response prediction by integrating large data sets, and highlight the potential for metabolic therapy to influence EMT phenotypes in cervical cancer.
Keywords: Genetics, Oncology
Keywords: Cancer, Radiation therapy, Transcription
Introduction
Cervical cancer ranks among the top 3 cancer diagnoses in women worldwide, accounting for approximately 300,000 deaths per year (1). The majority of cervical cancers are caused by persistent infection with human papillomaviruses (HPV) and research has culminated in advances in HPV screening and prevention (2). However, disparate factors including access disparities, provider recommendation, rate of voluntary vaccination, and vaccine efficacy affect population-based immunity to HPV and the ability to eliminate cervical cancer (3). Early-stage disease can be treated with surgery or radiation alone, while the standard-of-care for locally advanced cervical cancer (LACC) is pelvic radiation therapy (RT) with the concurrent administration of cisplatin chemotherapy. As many as 30%–50% of patients with LACC experience recurrence after standard-of-care chemoradiation therapy (CRT) depending on pretreatment factors (4). Recurrent or metastatic cervical cancer is incurable, and more-sophisticated prognostic markers and targeted therapeutic options are therefore needed (5).
We have previously demonstrated that 18F-fluorodeoxyglucose (FDG) uptake quantified by maximum standardized uptake value (SUVmax) on pretreatment positron emission tomography (PET) is associated with poor outcomes after definitive RT (6, 7). We have also demonstrated a connection between RNA expression and cervical tumor response to RT (8, 9). The Cancer Genome Atlas (TCGA) consortium study on cervical cancer (TCGA-CESC) proposed keratin-low, keratin-high, and adenocarcinoma-rich as molecular subgroups based on gene expression data; however, these groups were not associated with patient outcomes (2). The purpose of the current study is to test whether integrating SUVmax into whole-transcriptome sequencing (RNA-seq) data improves molecular grouping, histological subgrouping, and treatment response prediction in cervical cancer.
Results and Discussion
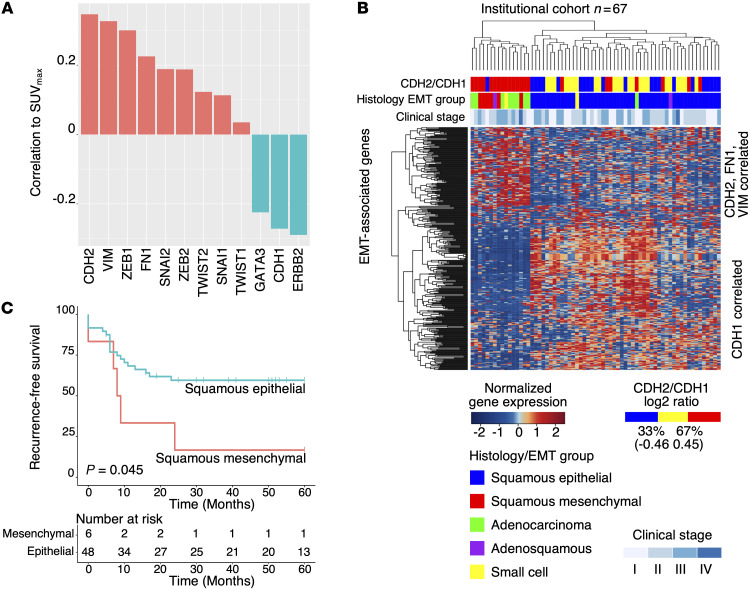
To identify the molecular basis responsible for increased FDG uptake (measured as SUVmax), we performed RNA-seq on 67 primary cervical cancer samples from our institutional cervical cancer tumor bank (Supplemental Table 1). Patients were treated uniformly with curative-intent CRT, and associated FDG-PET imaging data and clinical outcome data were prospectively collected. Gene set enrichment analysis (GSEA) using pretreatment SUVmax as a continuous variable demonstrated that enrichment of the epithelial-to-mesenchymal transition (EMT) gene signatures positively correlate with SUVmax (Supplemental Figure 1; supplemental material available online with this article; https://doi.org/10.1172/JCI139232DS1). SUVmax is positively correlated to gene expression of representative mesenchymal markers CDH2 (encodes N-cadherin), VIM, and FN1, and transcription factors ZEB1, ZEB2, SNAI1, SNAI2, TWIST1, and TWIST2 (Figure 1A). SUVmax is negatively correlated to representative epithelial markers ERBB2, GATA3, and CDH1 (encodes E-cadherin) (Figure 1A).
Figure 1. Discovery of subhistology EMT groups using SUVmax and RNA-seq.
(A) Pearson correlation of SUVmax with representative EMT genes. (B) Hierarchical clustering using EMT-correlated genes and histology identified 3 major molecular groups: squamous epithelial, squamous mesenchymal, and adenocarcinoma. Adenosquamous (n = 2) and small cell (n = 2) samples were also present in the cohort (n = 67). (C) Squamous mesenchymal patients showed inferior recurrence-free survival compared with squamous epithelial (log rank test, P = 0.045).
To identify clinically meaningful molecular classification, we categorized the institutional cohort tumors (n = 67) into distinct mesenchymal- and epithelial-like groups (Figure 1B) using a hierarchical clustering method (10) based on genes correlated to CDH2, VIM, FN1, and CDH1 (see Methods). For the 54 squamous cell carcinoma (SCC) samples, 6 (11.1%) were assigned to the mesenchymal group and 48 (88.9%) were assigned to the epithelial group. Eight (88.9%) of the 9 adenocarcinoma samples were clustered in close proximity to the squamous mesenchymal samples. Altogether, we identified 3 major subhistology EMT groups: squamous epithelial (n = 48), squamous mesenchymal (n = 6), and adenocarcinoma (n = 8) (Figure 1B). Adenosquamous (n = 2) and small cell (n = 2) samples were also represented in this unbiased analysis (Figure 1B). Patients with squamous mesenchymal cervical cancer (n = 6) have worse recurrence-free survival than patients with squamous epithelial cervical cancer (n = 48) (log rank test, P = 0.045; Figure 1C). The squamous mesenchymal group also has inferior outcomes compared with the adenocarcinoma group (log rank test, P = 0.022; Supplemental Figure 2). A comprehensive list of clinical features for the squamous mesenchymal samples, including SUVmax and metastatic status, are included in Supplemental Table 2.
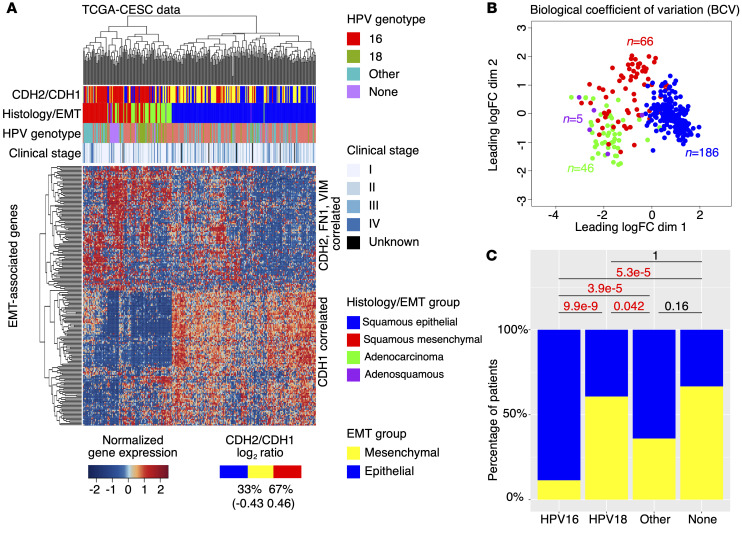
To validate the subhistology EMT groups identified above, we analyzed RNA-seq data from the TCGA-CESC cohort (n = 304) using the same method. In the TCGA-CESC cohort, 66 (26.2%) of the 252 SCC samples were in the mesenchymal group, and 186 (73.8%) were in the epithelial group (Figure 2A). Forty-six (97.9%) of the 47 adenocarcinoma samples are clustered in close proximity to the squamous mesenchymal samples, and 4 (80%) of the 5 adenosquamous samples are clustered in close proximity to the adenocarcinoma samples (Figure 2A). No small cell samples are represented in the TCGA data. Biological coefficient of variation (BCV) analysis using 201 EMT-correlated genes (Supplemental Table 3) from Figure 2A also confirmed the 3 major subhistology EMT groups (Figure 2B). Using all expressed genes (n = 12,463; see Methods), the above subhistology EMT groups still show significant separation under BCV analysis (Supplemental Figure 3). Patients with squamous mesenchymal cancer show inferior overall survival compared with those with squamous epithelial and adenocarcinoma (log rank test, P = 0.0049) (Supplemental Figure 4A). This is also the case for the subcohort of TCGA-CESC patients who were treated with RT (Figures S4B and S4C). Multivariate (MV) analysis confirmed the survival differences between the subhistology EMT groups (Supplemental Table 4), and our reclassification of TCGA-CESC samples is independent of the previous classification reported in the TCGA consortium study (Supplemental Figure 5) (2).
Figure 2. Validation of subhistology EMT groups using TCGA data.
(A) Hierarchical clustering validated 3 major molecular groups, namely squamous epithelial, squamous mesenchymal, and adenocarcinoma. In addition, adenosquamous samples (n = 5) are shown in purple. n = 304. (B) BCV analysis using EMT-correlated genes confirmed the 3 major molecular groups. One outlier adenocarcinoma sample is excluded in the BCV analysis. Adenosquamous samples are clustered close to adenocarcinoma samples. (C) Comparison of HPV genotype-specific mesenchymal gene expression with 2-proportions tests.
In addition to the subhistology EMT groups, we observed further heterogeneity within the squamous mesenchymal group with respect to EMT gene expression (Figure 2A). We observed that the mesenchymal samples with the same HPV genotype tend to cluster together, suggesting an HPV genotype–specific regulation of mesenchymal gene expression. To test whether EMT is linked to HPV genotype, we compared the proportions of mesenchymal and epithelial samples in different HPV genotypes (Supplemental Figure 6) for all SCC samples (n = 186; Figure 2C). While only 11.4% (16/140) of HPV16 SCC samples displayed mesenchymal gene expression signature and categorized into the squamous mesenchymal subgroup, a significantly higher proportion (60.7% = 17/28) of HPV18 SCC samples displayed this signature and categorized into the squamous mesenchymal subgroup (2-proportions test, P = 9.9 × 10⁻⁹). Samples with other HPV genotypes showed significantly higher proportion in the squamous mesenchymal subgroup than those with HPV16 (2-proportions test, P = 3.9× 10⁻⁵), but significantly lower proportion in squamous mesenchymal subgroup than those with HPV18 (2-proportions test, P = 0.042; Figure 2C). Comparing the squamous mesenchymal and epithelial samples, we also identified additional enriched pathways (Supplemental Figure 7A and Supplemental Table 5) and differentially expressed genes (Supplemental Figure 7B and Supplemental Table 6).
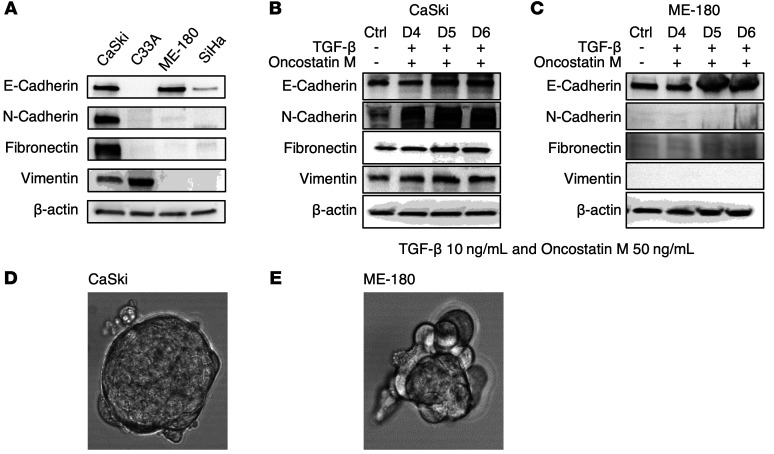
In order to model mesenchymal phenotype in vitro, we evaluated mesenchymal marker (CDH2, VIM, and FN1) gene expression in a panel of cervical cancer cell lines (CaSki, C33A, ME-180, and SiHa) using Western blot (Figure 3A) and quantitative reverse transcription PCR (qRT-PCR) (Supplemental Figure 8). CDH1 was also tested to select cell lines with epithelial phenotype for comparison purposes. Within the panel of cervical cancer cell lines, CaSki has high gene expression for all 3 mesenchymal marker genes tested (CDH2, VIM, and FN1). Also, our previous study showed that CaSki has higher FDG uptake in vitro compared with C33A, ME-180, and SiHa (11). Using these markers to define EMT status, we selected the mesenchymal CaSki and epithelial ME-180 cell lines for further evaluation. The cell lines were treated with TGF-β (10 ng/mL) and Oncostatin M (50 ng/mL) for 7 days. CaSki (with mesenchymal gene expression) responded to TGF-β and Oncostatin M treatment by upregulating mesenchymal gene expression (Figure 3B), whereas ME-180 (with only epithelial gene expression) did not show response (Figure 3C). High mesenchymal gene expression in CaSki positively correlated with the capacity to form spheroids (which is another mesenchymal feature) in vitro (Figure 3D), while ME-180 with only CDH1 (E-cadherin) expression did not form spheroids (Figure 3E).
Figure 3. Creating a mesenchymal spheroid model using cervical cancer cells.
(A) Mesenchymal and epithelial marker gene expression in cervical cancer cell lines. (B) CaSki responds to TGF-β and Oncostatin M treatment by upregulating mesenchymal genes. (C) ME-180 does not respond to TGF-β and Oncostatin M treatment. (D) Spheroid formation in CaSki cells. (E) ME-180 does not form spheroids.
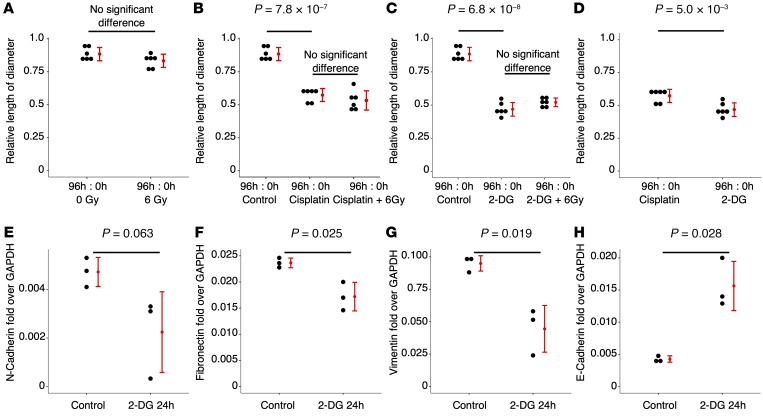
Given the link between tumor glycolysis as measured by FDG uptake (SUVmax) and EMT gene expression signatures, we then asked if CaSki spheroid formation can be disrupted by inhibition of glycolysis with 2-DG. For comparison purposes, we tested the sensitivity of CaSki 3D organoids to sham, 6 Gy of radiation (RT), Cisplatin (with/without RT), and 2-DG (with/without RT). The established CaSki 3D organoid diameters (Supplemental Figure 9) were measured at time 0 and again at 96 hours after treatment (repeated 6 times). Relative length of diameter, i.e., the diameter at 96 hours divided by the diameter at 0 hour, was calculated for each organoid in each treatment setting and compared. We found that the relative diameters of the CaSki 3D spheroids treated with sham and 6 Gy RT were not significantly different (Figure 4A). The size of the CaSki 3D spheroids was significantly reduced when treated with Cisplatin (Figure 4B) and 2-DG (Figure 4C). Adding 6 Gy RT to Cisplatin and 2-DG did not further reduce the sizes of the spheroids (Figure 4, B and C). Compared with Cisplatin, treatment using 2-DG had a significantly stronger effect in reducing the size of the CaSki spheroids (Figure 4D and Supplemental Figure 10). We used qRT-PCR to measure expression of mesenchymal marker genes CDH2, VIM, and FN1, and epithelial marker gene CDH1, before and after treating CaSki with 2-DG. Gene expression of all the 3 mesenchymal markers (CDH2, VIM, and FN1) were downregulated after 2-DG treatment, and gene expression of the epithelial marker CDH1 was upregulated after 2-DG treatment (Figure 4E).
Figure 4. Treating CaSki 3D organoids.
(A) CaSki 3D spheroids do not respond to radiation. (B) CaSki 3D spheroids respond to Cisplatin. (C) CaSki 3D spheroids respond to 2-DG. (D) 2-DG treatment has stronger effects than Cisplatin in reducing the sizes of the CaSki 3D organoids. (E) 2-DG treatment downregulates mesenchymal and upregulates epithelial gene expression of CaSki cells. Experiments were repeated 3–6 times.
In this study, we integrated imaging and RNA-seq to identify a clinically meaningful molecular classification to improve outcome prediction in cervical cancer. We created a 3D organoid model, induced mesenchymal phenotypes, and characterized the response to treatments including radiation and a glycolysis inhibitor. Our experiments emphasized the potential for 3D cell culture to influence the response of cervical cancer cells to standard treatments. In addition, our findings highlight the potential for metabolic therapy, specifically inhibition of glycolysis to prevent EMT, which is thought to be necessary for the development of distant metastasis.
As a biomarker, the mesenchymal status can be determined using multiple genes (e.g., the mesenchymal marker genes in Figure 3) and therefore can be more accurate than using single clinical or molecular-based factors. For example, HPV status (i.e., HPV-positive and HPV-negative) as a single factor may represent cases that are either in epithelial or mesenchymal groups. Our results report a more frequent association of HPV18 genotype with expression of EMT genes. This is in contrast to previous studies in head and neck cancer, which failed to demonstrate an association between HPV status and EMT gene expression (12). It should be noted that the HPV16 genotype is the most common genotype in head and neck cancer. Interestingly, expression of both E6 and E7 from HPV16 has been shown to induce expression of EMT-associated genes (13). Further work will be needed to determine whether HPV genotype is an important factor in regulating EMT genes in cervical and head and neck cancers.
Our results provide a biological explanation to support the previous observation that a subset of patients with cervical cancer with HPV-positive SCC are resistant to CRT and have inferior outcomes. Previous studies using cervical cancer cell lines have demonstrated direct and indirect roles of HPV oncogenes in inducing EMT (14). Our analyses using human data from the TCGA-CESC cohort showed HPV genotype-specific mesenchymal gene expression patterns (Figure 2, A and C). These results suggested that HPV oncogene expression is necessary not only in cervical cancer tumorigenesis but also in cervical cancer tumor progression through development of the mesenchymal transition, which has been associated with distant metastasis. These results also complement our recent research on local immune response and HPV expression in CRT (15).
The complexity of EMT in cervical cancer, involving both HPV and human genes through different signaling pathways (Supplemental Table 5), poses a challenge to developing effective treatments targeting all possible pathways, given that EMT gene expression can promote resistance to standard-of-care CRT. However, the association of EMT and glucose uptake suggested an interaction of EMT and tumor metabolism in cervical cancer. This association has recently been reported in other cancer types, including breast, pancreatic, and lung cancers (16–18). To test treatments targeting tumor metabolism, we used 3D organoid cultures to validate the relationship between EMT gene expression and sensitivity to the glycolysis inhibitor, 2-DG. This study reports differential RT sensitivity in organoid models for cervical cancer, and demonstrates specifically that the administration of an inhibitor of glycolysis can disrupt cervical cancer spheroid growth. This result supports developing new treatments targeting cervical cancer metabolism, which may benefit patients with LACC who are at risk to develop recurrence and distant metastasis after standard-of-care chemoradiation. We hypothesize that inhibition of EMT by therapeutic glycolysis inhibition may reduce the formation of distant metastasis after chemoradiation, but additional studies will be required to demonstrate this effect.
While this study focuses on EMT in squamous cancers, we have included all other available histology types in our unbiased analyses. Due to the small sample sizes, it is not possible to acquire statistically and biologically significant results for adenosquamous and small cell histologies. These rare histology types in cervical cancer warrant further investigations with larger sample sizes and dedicated molecular biology experiments.
Overall, our research showed that integration of SUV from FDG-PET into RNA-seq data improved prognostication and treatment response prediction in cervical cancer. Expression of EMT related genes is associated with cervical tumor cell glucose uptake quantified by FDG-PET imaging. Determining the relationship of FDG-PET features, EMT, and radiation response will help optimize cervical cancer chemoradiation by identifying radiation-resistant cancers prior to treatment and cases where treatment intensification can be applied. We used an in vitro model of the mesenchymal phenotype with 3D organoid cultures of cervical cancer, and demonstrated their resistance to standard-of-care radiation therapy but sensitivity to a novel treatment approach, by targeting tumor glucose metabolism. These experiments support the development of new personalized treatment approaches for patients with cervical cancer. Since the data analysis methods and in vitro procedures can be applied to other cancers, this work is of broad impact and can be expanded to other clinical sites.
Methods
RNA-seq and imaging.
Tumor samples (n = 67) with sufficiently high-quality RNA as defined previously (2) were included for RNA-seq. PolyA selection was performed before multiplexed sequencing (Illumina HiSeq 3000, 1 × 50 nt, approximately 40 million reads per sample). Genes with consistently low expression (i.e., <1 FPKM or <200 reads) in at least 95% of samples were excluded. FDG-PET imaging was performed according to our institution’s protocols, and SUVmax was derived as previously defined (6). Genes were ranked according to their Pearson correlation with SUVmax, and used for GSEA analysis using H: hallmark and C2: curated gene sets.
Discovering subhistology EMT groups.
Genes with their expression positively or negatively correlated to at least 2 of the 4 mesenchymal or epithelial signature genes, CDH1, CDH2, VIM, and FN1, were used in hierarchical clustering (Euclidean method). For each EMT signature gene, the top 10% expressed genes that were either positively (5%) or negatively (5%) correlated to the signature gene were retained. To enhance the power, bimodal indices (19) were also calculated, and only the top 10% with high bimodal indices were retained. The mesenchymal and epithelial groups were then combined with histology data to define the subhistology EMT groups.
Validation and analyses using TCGA data.
Gene expression data were downloaded from NCI Genomic Data Commons (GDC). Molecular groups were discovered using the same method described above. Biological coefficient of variation and DE analyses were using the Bioconductor package edgeR.
Cell culture and reagents.
Cervical cancer cell lines (CaSki, SiHa, C33A, and ME-180) were obtained from ATCC and maintained as previously described (11). Short-tandem repeat profiling was last performed in November 2020, which confirmed positive match and full cell line authentication per ATCC reference standards. Cells were trypsinized, counted, and passed through 40 μM filters. Spheroids were formed by seeding 3000 cells onto low-affinity flat-bottom 96-well plates for 5 days. The spheroids were not embedded or fixed. The spheroids were treated with 5 μM Cisplatin, 40 mM 2-DG and or 6 Gy single fraction radiation using an RS2000 160 kV X-ray Irradiator using a 0.3 mm copper filter (Rad Source Technologies). Radiation dose was verified using Radcal 2186 dose meter (radcal.com). CaSki was treated with 20 mM 2-DG for 24 hours to test mesenchymal and epithelial marker gene expression.
Western blotting.
Western blotting was performed with primary antibodies against E-cadherin, N-cadherin, fibronectin, vimentin (1:1000; Cell Signaling Technology), and actin (1:1000, Santa Cruz Biotechnology). Blots were probed with HRP-conjugated anti-rabbit (Cell Signaling Technology) or anti-mouse polyclonal IgG secondary antibodies (Santa Cruz-Biotechnology) for 1 hour at room temperature. Amersham ECL select (GE Healthcare) was used for detection. Images were acquired using Chemidoc Imaging systems (BioRad).
RNA extraction, cDNA synthesis, and qRT-PCR.
RNA was extracted using Trizol and isolated RNA was measured using NanoDrop. cDNA was prepared using the High Capacity cDNA Reverse Transcription Kit (Applied Biosystems). All qRT-PCR assays were performed using TaqMan master mix (Applied Biosystems).
Statistics.
Log rank tests were used in Kaplan-Meier survival analyses. Two-proportions tests were used to compare HPV genotype–specific mesenchymal gene expression. Student’s t tests were used to compare treatments to spheroids. A P value less than 0.05 was considered significant.
Study approval.
The institutional cohort patients were enrolled prospectively on an IRB-approved tumor banking study, and all patients provided written informed consent (201105374). RNA-seq data were analyzed retrospectively (201201099). RNA-seq data can be accessed at Gene Expression Omnibus (GEO) with accession number GSE151666.
Author contributions
JZ and JKS conceived and planned the data analyses and experiments. JZ, MI, KJ, and MRW performed the data analyses. RR and FR carried out the experiments. JZ, PWG, SM, and JKS contributed to the interpretation of the results. JZ and JKS took the lead in writing the manuscript.
Supplementary Material
Acknowledgments
This work was supported in part by NIH R01CA181745 (to JKS), NIH K08CA237822 (to SM), and NCI K22CA237839 (to JZ).
Version 1. 03/01/2021
Print issue publication
Footnotes
Conflict of interest: The authors have declared that no conflict of interest exists.
Copyright: © 2021, American Society for Clinical Investigation.
Reference information: J Clin Invest. 2021;131(5):e139232.https://doi.org/10.1172/JCI139232.
Contributor Information
Jin Zhang, Email: jin.zhang@wustl.edu.
Ramachandran Rashmi, Email: rashmi@wustl.edu.
Matthew Inkman, Email: m.inkman@wustl.edu.
Kay Jayachandran, Email: kayj@email.wustl.edu.
Fiona Ruiz, Email: Fiona@wustl.edu.
Michael R. Waters, Email: mrw.waters@gmail.com.
Perry W. Grigsby, Email: pgrigsby@wustl.edu.
Stephanie Markovina, Email: smarkovina@wustl.edu.
Julie K. Schwarz, Email: jschwarz@wustl.edu.
References
- 1.Arbyn M, et al. Estimates of incidence and mortality of cervical cancer in 2018: a worldwide analysis. Lancet Glob Health. 2020;8(2):e191–e203. doi: 10.1016/S2214-109X(19)30482-6. [DOI] [PMC free article] [PubMed] [Google Scholar]
- 2.Cancer Genome Atlas Research Network, et al. Integrated genomic and molecular characterization of cervical cancer. Nature. 2017;543(7645):378–384. doi: 10.1038/nature21386. [DOI] [PMC free article] [PubMed] [Google Scholar]
- 3.Rodriguez SA, et al. Factors associated with adolescent HPV vaccination in the U.S.: A systematic review of reviews and multilevel framework to inform intervention development. Prev Med. 2020;131:105968. doi: 10.1016/j.ypmed.2019.105968. [DOI] [PMC free article] [PubMed] [Google Scholar]
- 4.Huang YT, et al. Long-term outcome and prognostic factors for adenocarcinoma/adenosquamous carcinoma of cervix after definitive radiotherapy. Int J Radiat Oncol Biol Phys. 2011;80(2):429–436. doi: 10.1016/j.ijrobp.2010.02.009. [DOI] [PubMed] [Google Scholar]
- 5.Uyar D, Rader J. Genomics of cervical cancer and the role of human papillomavirus pathobiology. Clin Chem. 2014;60(1):144–146. doi: 10.1373/clinchem.2013.212985. [DOI] [PubMed] [Google Scholar]
- 6.Kidd EA, et al. The standardized uptake value for F-18 fluorodeoxyglucose is a sensitive predictive biomarker for cervical cancer treatment response and survival. Cancer. 2007;110(8):1738–1744. doi: 10.1002/cncr.22974. [DOI] [PubMed] [Google Scholar]
- 7.Kidd EA, et al. Pelvic lymph node F-18 fluorodeoxyglucose uptake as a prognostic biomarker in newly diagnosed patients with locally advanced cervical cancer. Cancer. 2010;116(6):1469–1475. doi: 10.1002/cncr.24972. [DOI] [PubMed] [Google Scholar]
- 8.Hu X, et al. A microRNA expression signature for cervical cancer prognosis. Cancer Res. 2010;70(4):1441–1448. doi: 10.1158/0008-5472.CAN-09-3289. [DOI] [PMC free article] [PubMed] [Google Scholar]
- 9.Schwarz JK, et al. Pathway-specific analysis of gene expression data identifies the PI3K/Akt pathway as a novel therapeutic target in cervical cancer. Clin Cancer Res. 2012;18(5):1464–1471. doi: 10.1158/1078-0432.CCR-11-2485. [DOI] [PMC free article] [PubMed] [Google Scholar]
- 10.Byers LA, et al. An epithelial-mesenchymal transition gene signature predicts resistance to EGFR and PI3K inhibitors and identifies Axl as a therapeutic target for overcoming EGFR inhibitor resistance. Clin Cancer Res. 2013;19(1):279–290. doi: 10.1158/1078-0432.CCR-12-1558. [DOI] [PMC free article] [PubMed] [Google Scholar]
- 11.Rashmi R, et al. Radioresistant cervical cancers are sensitive to inhibition of glycolysis and redox metabolism. Cancer Res. 2018;78(6):1392–1403. doi: 10.1158/0008-5472.CAN-17-2367. [DOI] [PMC free article] [PubMed] [Google Scholar]
- 12.Lefevre M, et al. Epithelial to mesenchymal transition and HPV infection in squamous cell oropharyngeal carcinomas: the papillophar study. Br J Cancer. 2017;116(3):362–369. doi: 10.1038/bjc.2016.434. [DOI] [PMC free article] [PubMed] [Google Scholar]
- 13.Hellner K, et al. HPV16 E7 oncogene expression in normal human epithelial cells causes molecular changes indicative of an epithelial to mesenchymal transition. Virology. 2009;391(1):57–63. doi: 10.1016/j.virol.2009.05.036. [DOI] [PMC free article] [PubMed] [Google Scholar]
- 14.Chen X, et al. The epithelial-mesenchymal transition (EMT) is regulated by oncoviruses in cancer. Faseb J. 2016;30(11):3901–3910. doi: 10.1096/fj.201600388RERR. [DOI] [PubMed] [Google Scholar]
- 15.Cosper PF, et al. Decreased local immune response and retained HPV gene expression during chemoradiotherapy are associated with treatment resistance and death from cervical cancer. Int J Cancer. 2020;146(7):2047–2058. doi: 10.1002/ijc.32793. [DOI] [PMC free article] [PubMed] [Google Scholar]
- 16.Liu M, et al. Epithelial-mesenchymal transition induction is associated with augmented glucose uptake and lactate production in pancreatic ductal adenocarcinoma. Cancer Metab. 2016;4:19. doi: 10.1186/s40170-016-0160-x. [DOI] [PMC free article] [PubMed] [Google Scholar]
- 17.Kondaveeti Y, et al. Epithelial-mesenchymal transition induces similar metabolic alterations in two independent breast cancer cell lines. Cancer Lett. 2015;364(1):44–58. doi: 10.1016/j.canlet.2015.04.025. [DOI] [PubMed] [Google Scholar]
- 18.Lucena MC, et al. Epithelial mesenchymal transition induces aberrant glycosylation through hexosamine biosynthetic pathway activation. J Biol Chem. 2016;291(25):12917–12929. doi: 10.1074/jbc.M116.729236. [DOI] [PMC free article] [PubMed] [Google Scholar]
- 19.Wang J, et al. The bimodality index: a criterion for discovering and ranking bimodal signatures from cancer gene expression profiling data. Cancer Inform. 2009;7:199–216. doi: 10.4137/cin.s2846. [DOI] [PMC free article] [PubMed] [Google Scholar]
Associated Data
This section collects any data citations, data availability statements, or supplementary materials included in this article.


